Loading resources…
Total 1760 resources
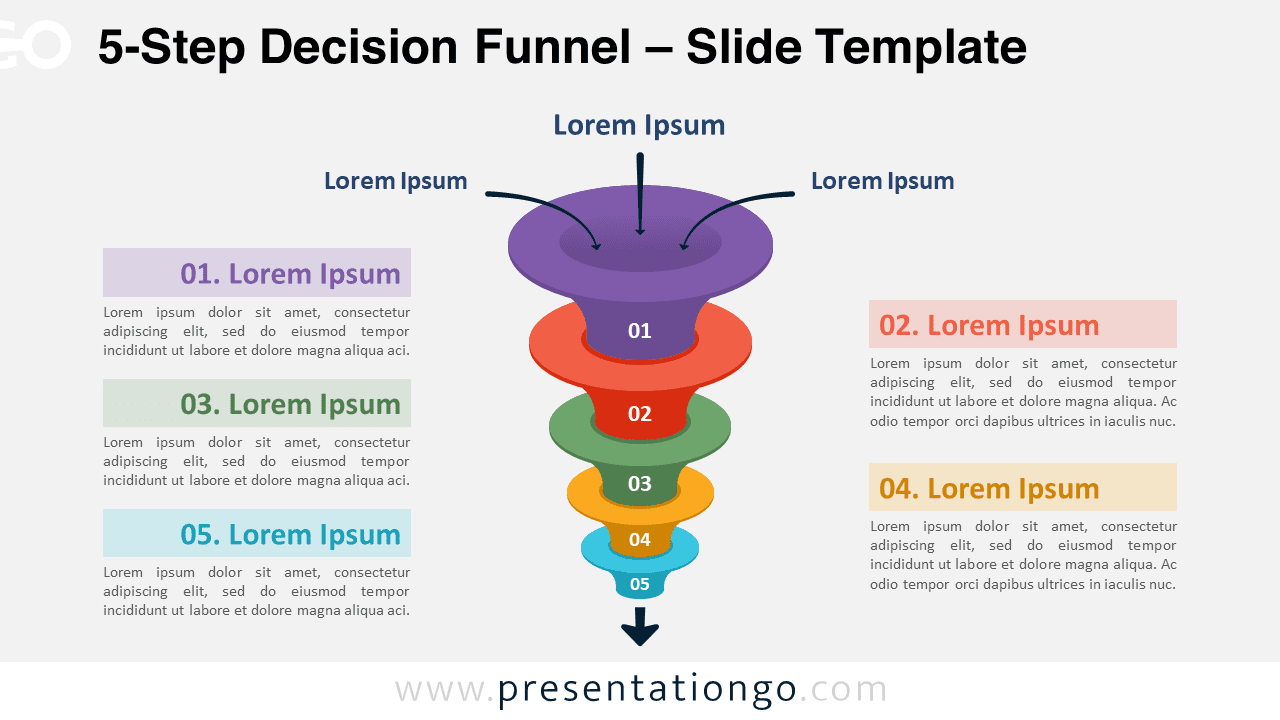
Illustrate convergence and narrowing processes using the 5-Step Decision Funnel template for PowerPoint and Google Slides. Fully customizable.
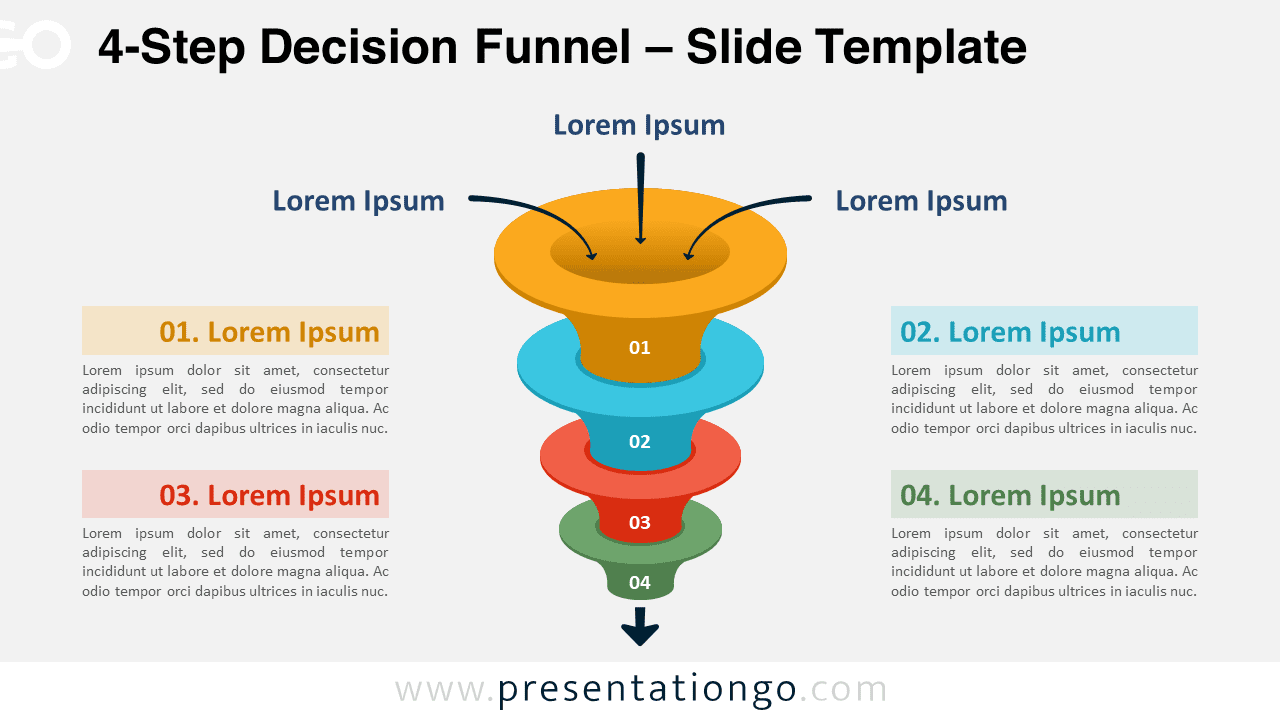
Simplify complex processes with our 4-Step Decision Funnel for PowerPoint & Google Slides. Perfect for visualizing decision-making hierarchies
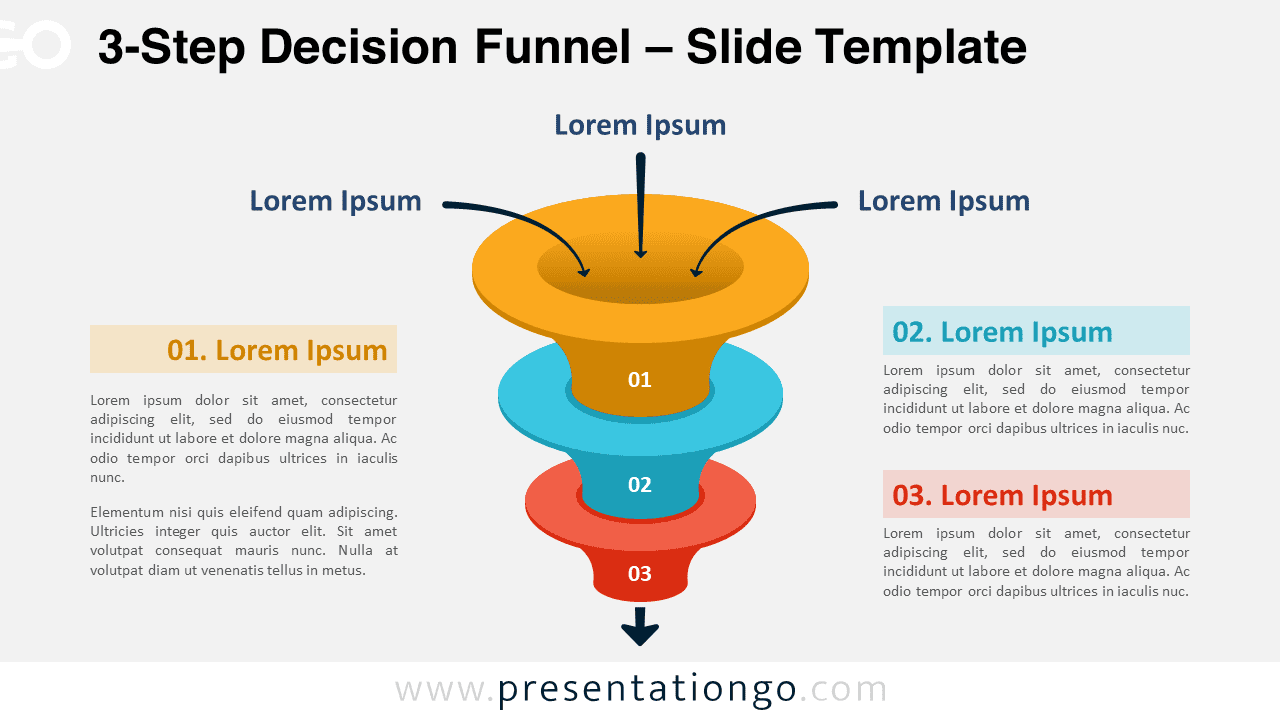
The 3-Step Decision Funnel for PowerPoint and Google Slides is a visually engaging diagram template for simplifying complex processes.
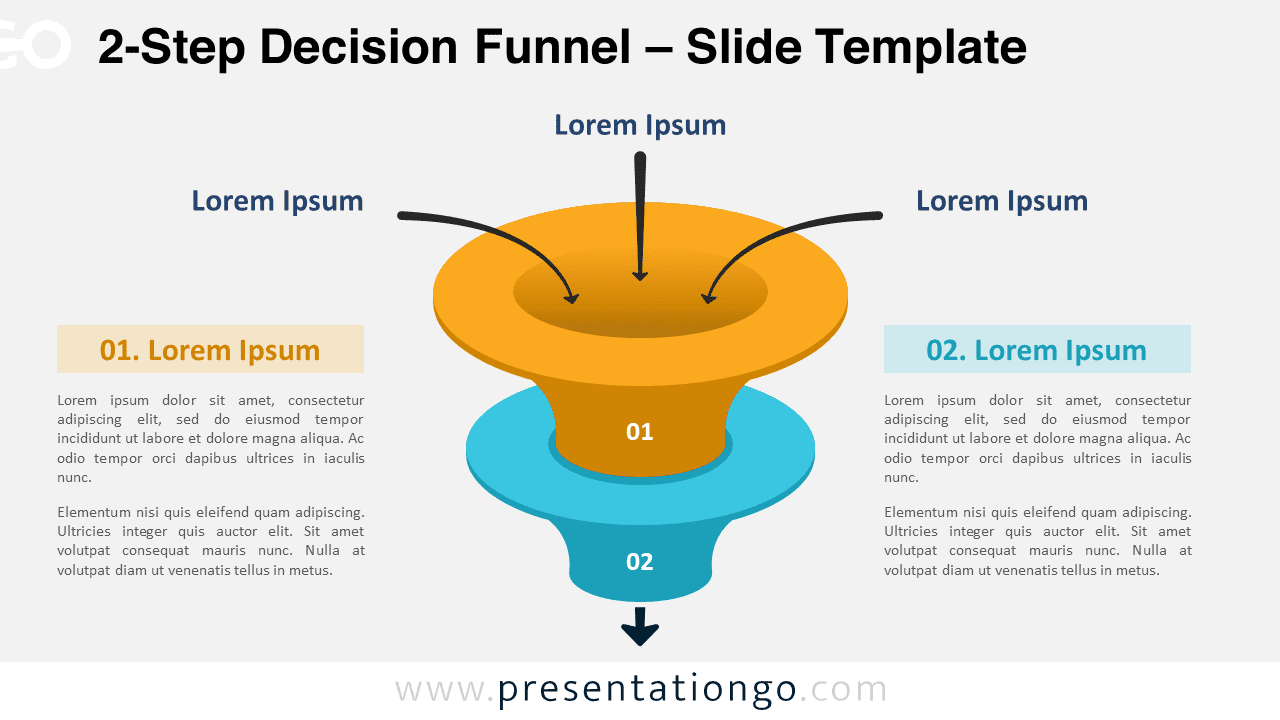
The 2-Step Decision Funnel for PowerPoint and Google Slides delivers a streamlined approach to process explanation and decision-making.
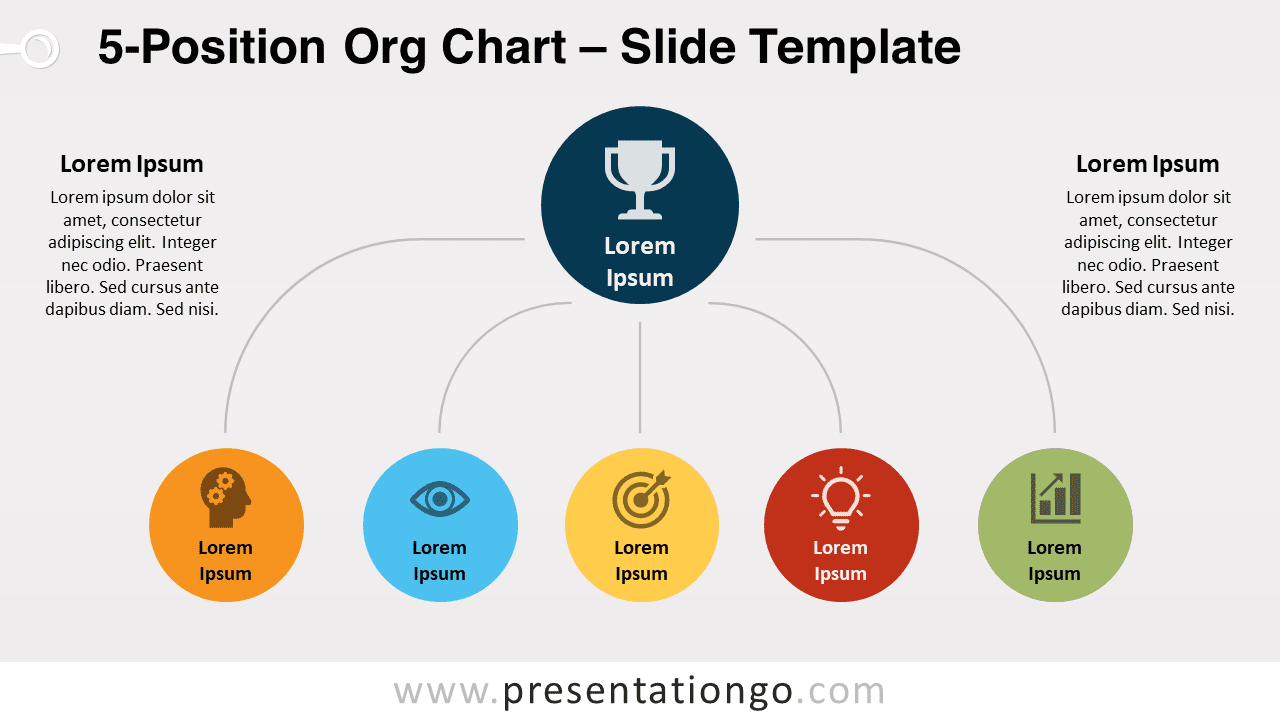
The 5-Position Org Chart for PowerPoint and Google Slides is an editable infographic featuring a central node connected to five elements.
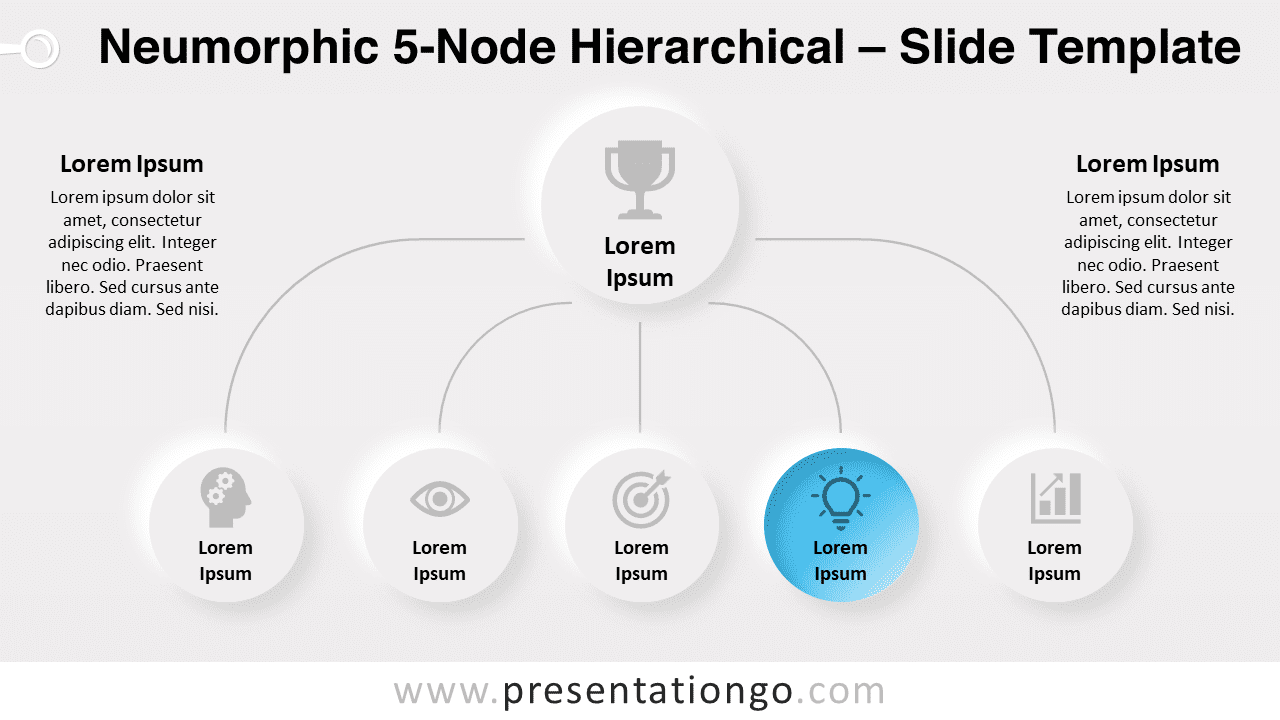
The Neumorphic 5-Node Hierarchical template for PowerPoint and Google Slides is perfect for showcasing organizational structures.
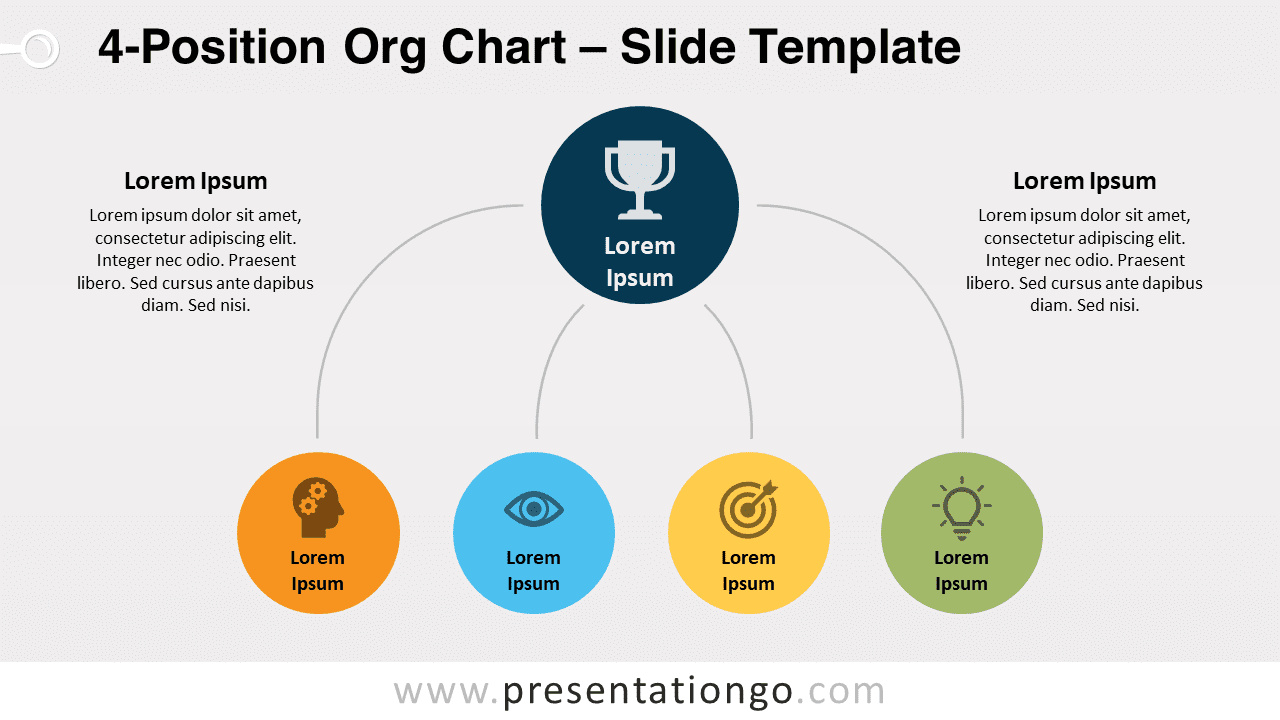
Download the customizable 4-Position Org Chart for PowerPoint and Google Slides. Ideal for illustrating reporting relationships and roles.
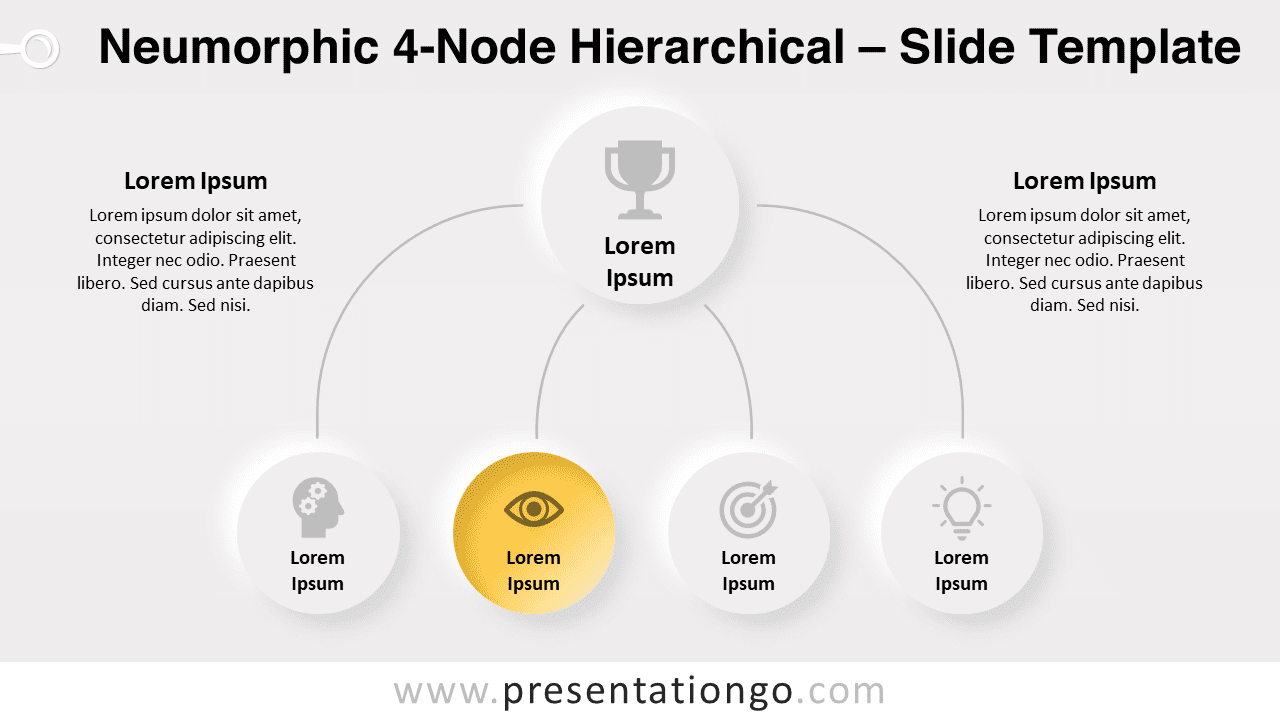
The Neumorphic 4-Node Hierarchical template for PowerPoint and Google Slides is ideal for illustrating one-level hierarchies with clarity.
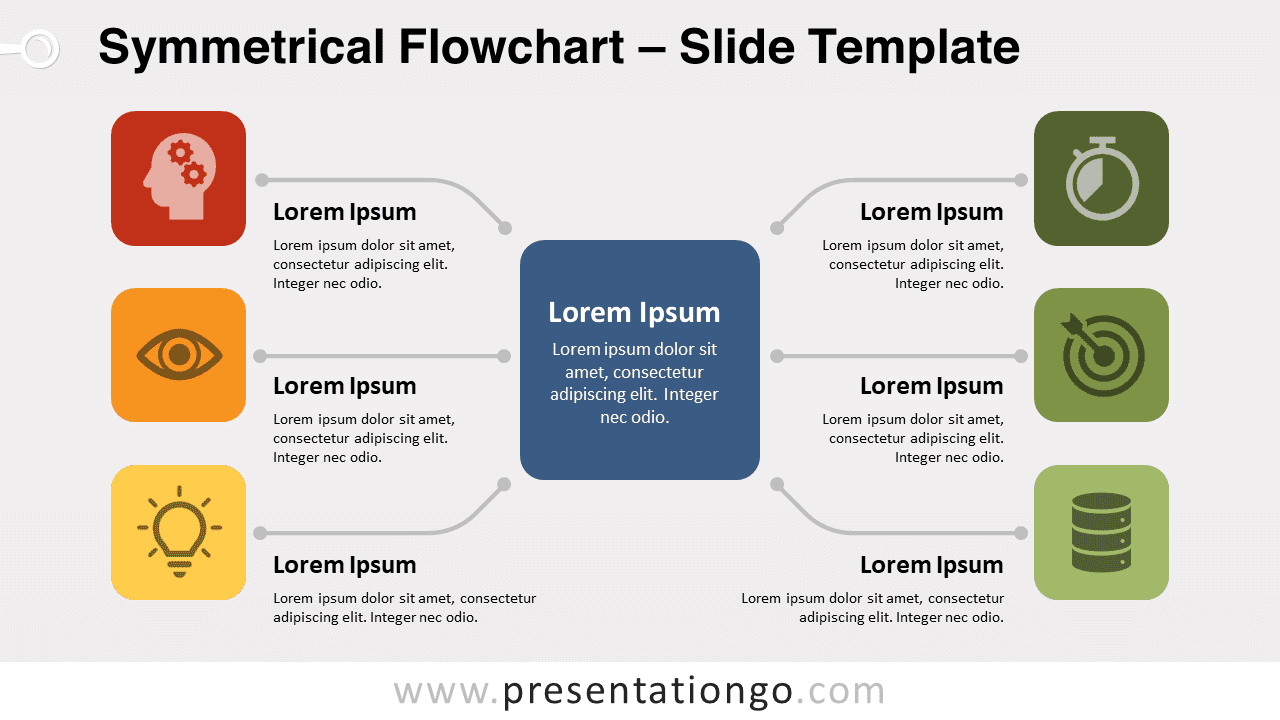
Present with precision using the Symmetrical Flowchart for PowerPoint & Google Slides, showcasing your central idea effectively.
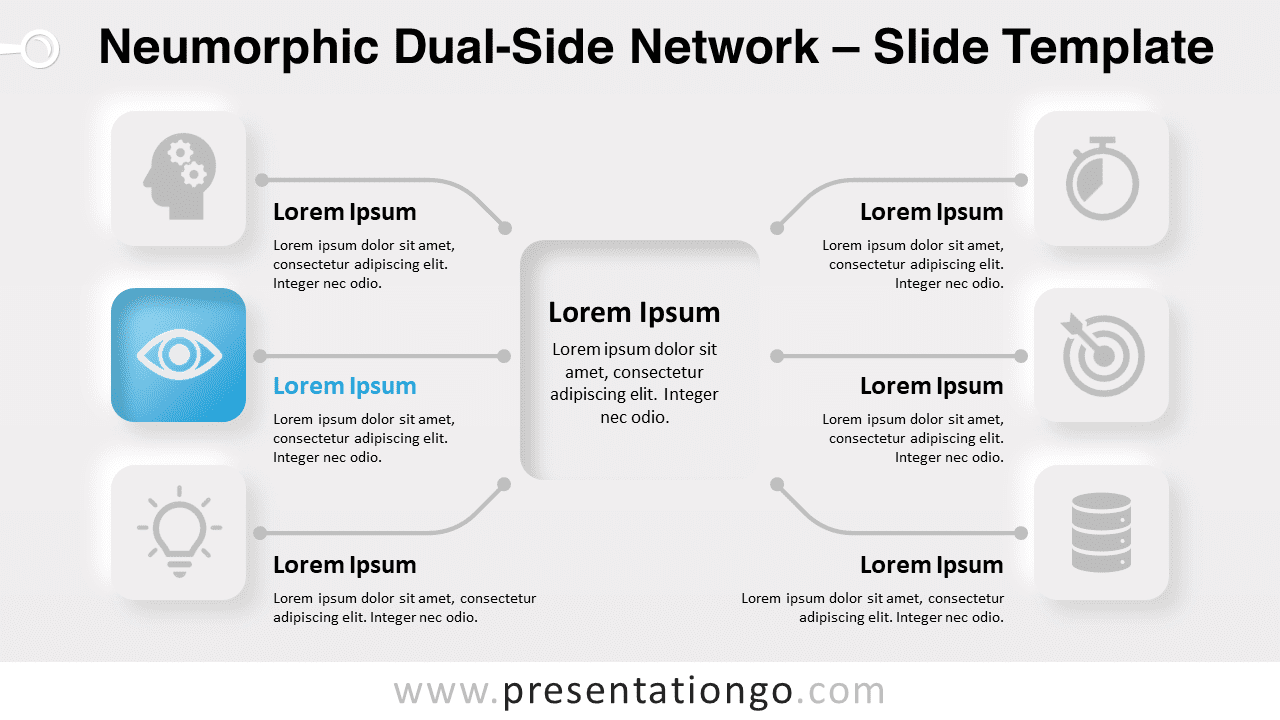
Neumorphic Dual-Side Network for PowerPoint & Google Slides: a modern diagram to visualize core relationships in a stylish design.
The 1-2-3 Horizontal Hierarchy for PowerPoint and Google Slides is a modern & customizable template for presenting hierarchical information.
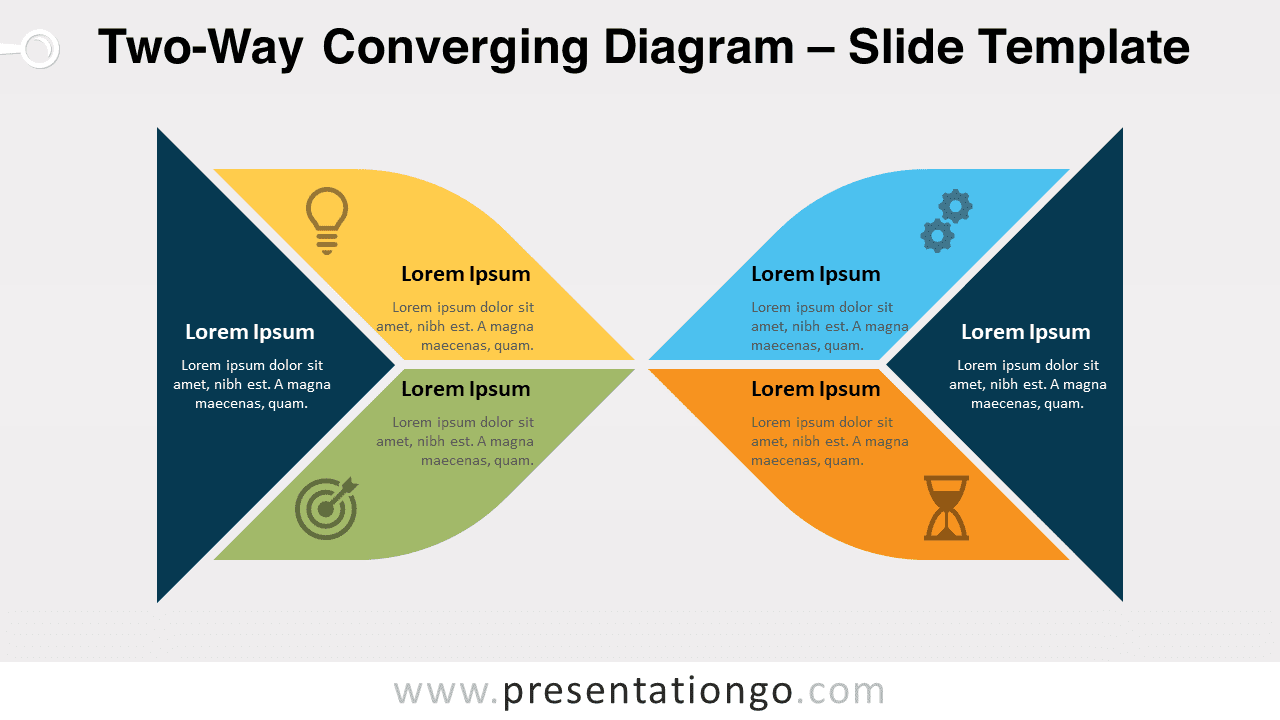
The Two-Way Converging Diagram for PowerPoint and Google Slides visually guides attention to the center, perfect for comparative analysis.
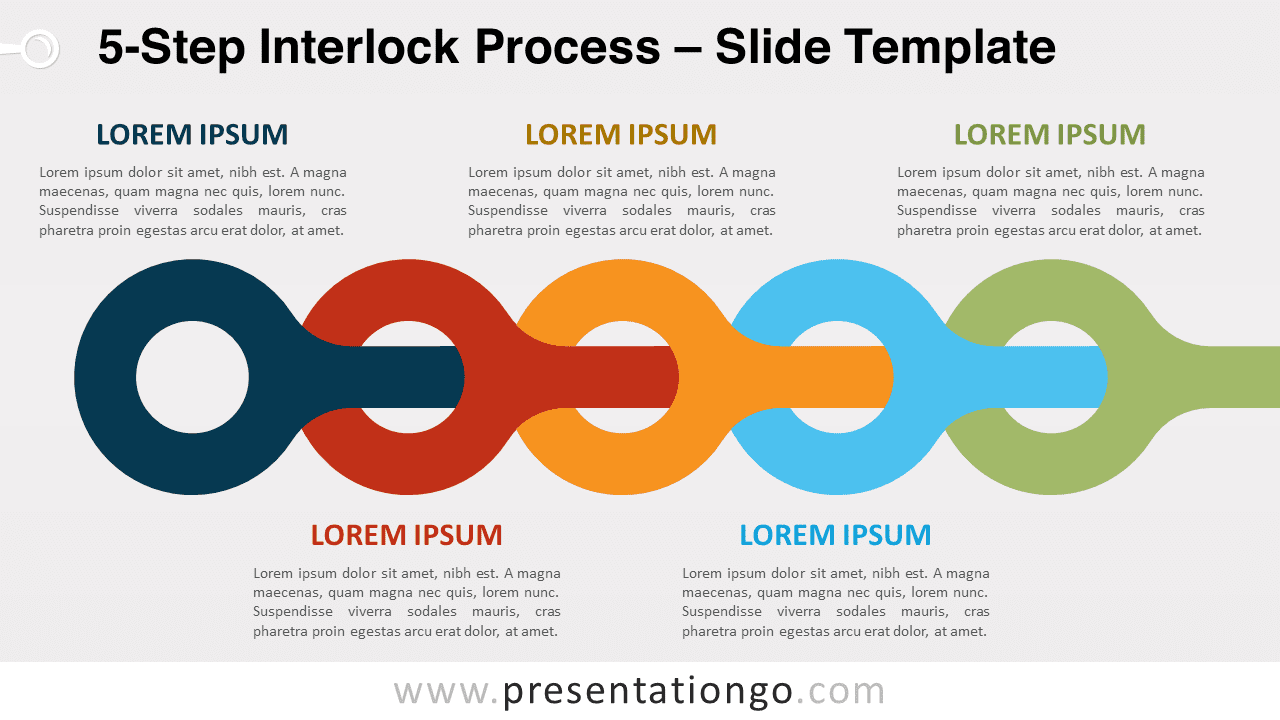
Visualize 5-step processes with this interlocking circular PowerPoint & Google Slides template. Customize colors and text to suit your needs.
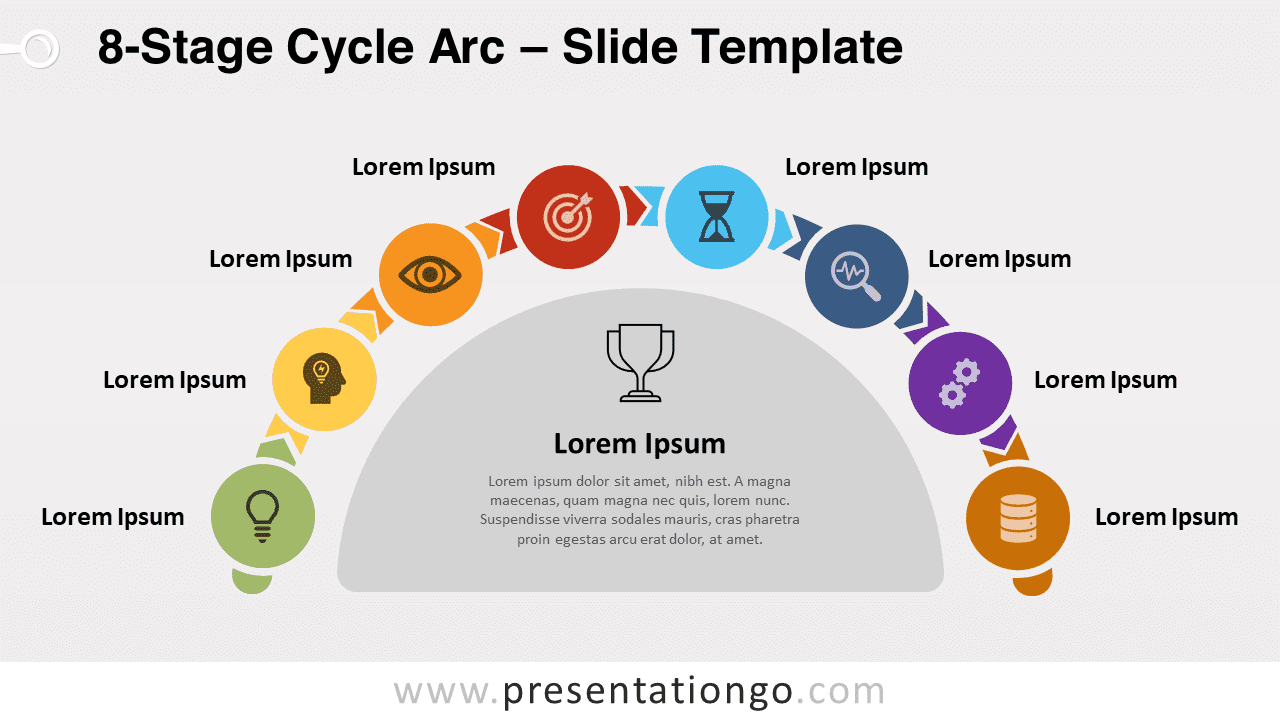
Present complex processes with the 8-Stage Cycle Arc for PowerPoint & Google Slides. A semi-circular flow that highlights every step.
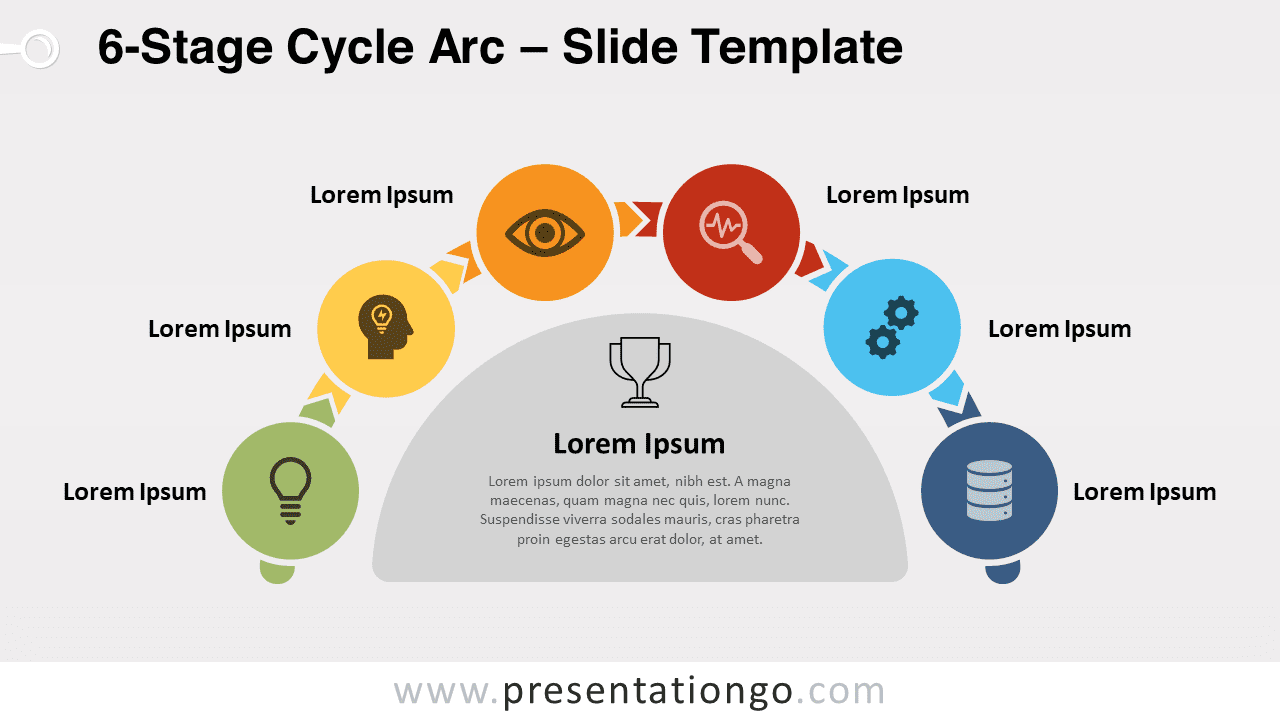
The 6-Stage Cycle Arc template for PowerPoint & Google Slides simplifies visualizing a 6-step sequence in an engaging, circular process flow.
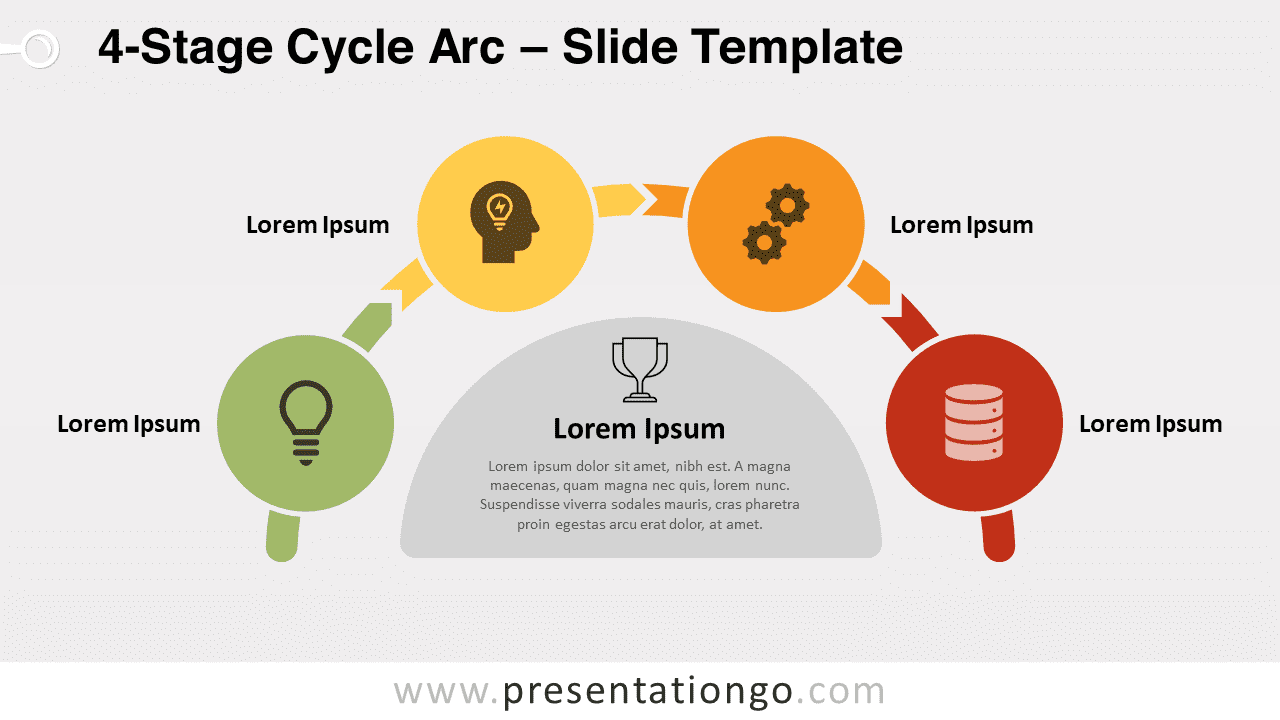
Use the 4-Stage Cycle Arc PowerPoint & Google Slides template to visually map 4-phase processes or workflows in a semicircular flow diagram.
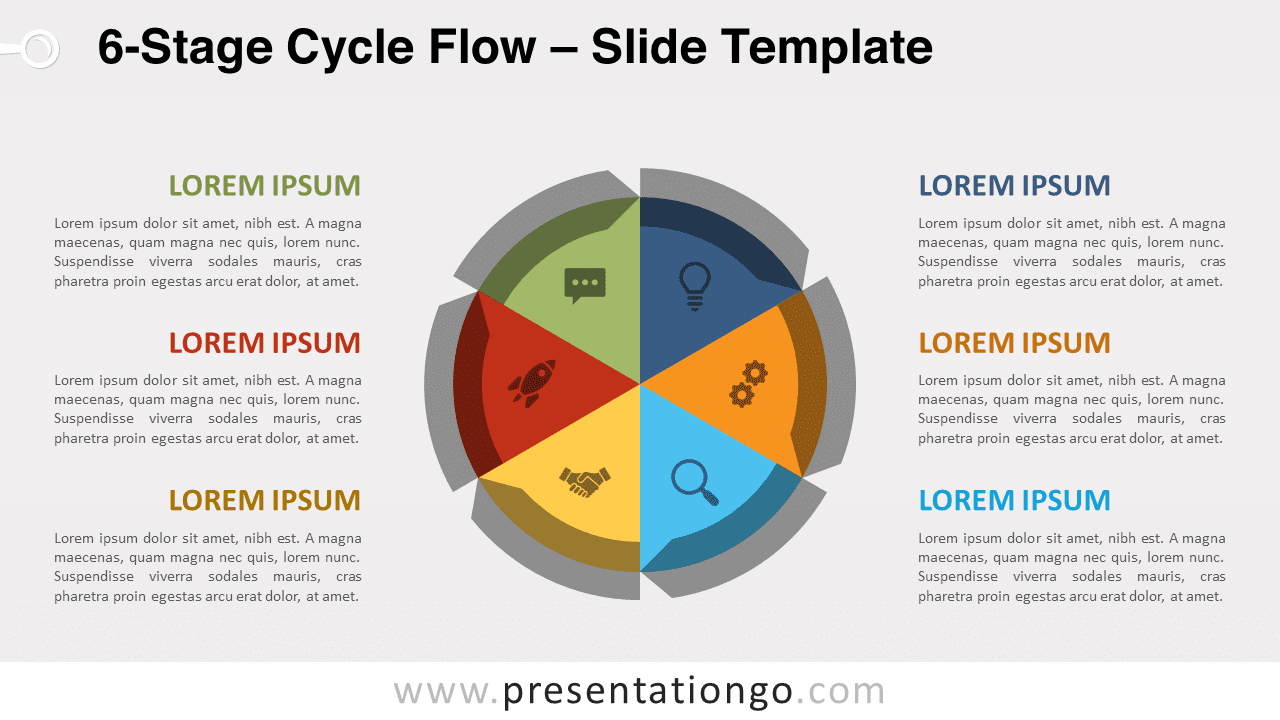
The 6-Stage Cycle Flow for PowerPoint & Google Slides features a customizable circular diagram to map any process with six repetitive stages.
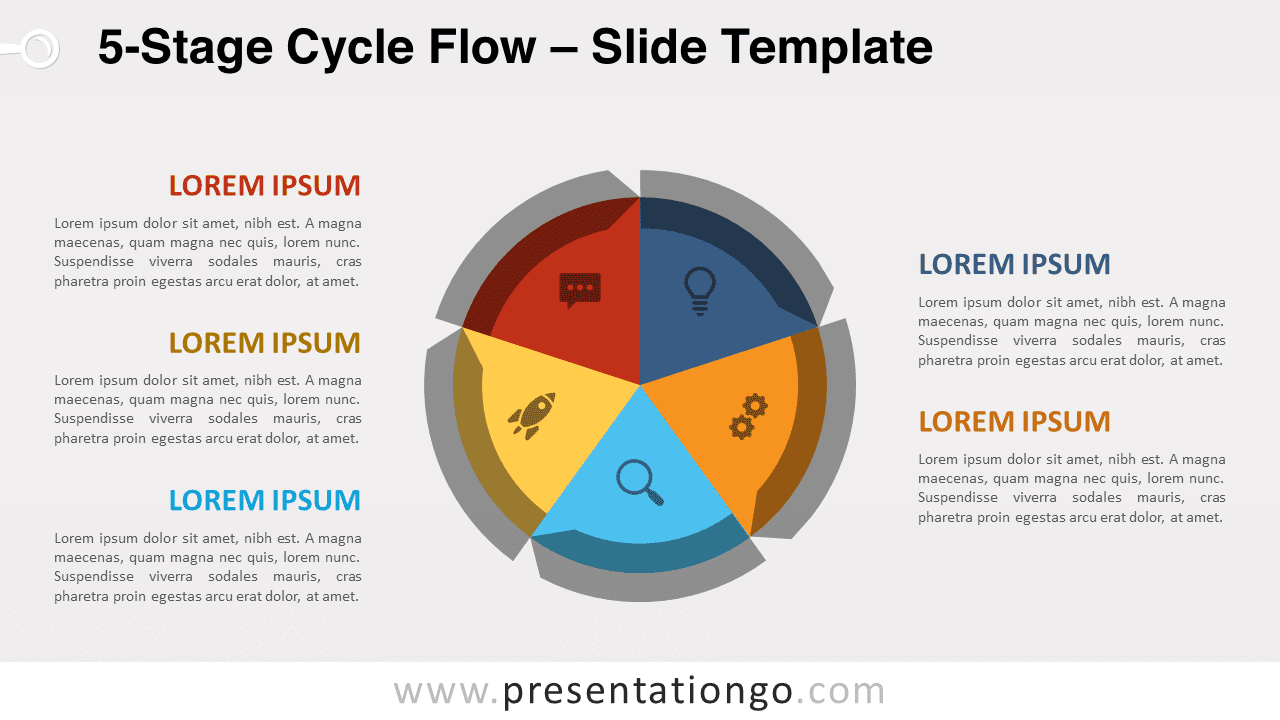
The 5-Stage Cycle Flow for PowerPoint provides a circular diagram to visually map any repeating 5-step sequence or process professionally.
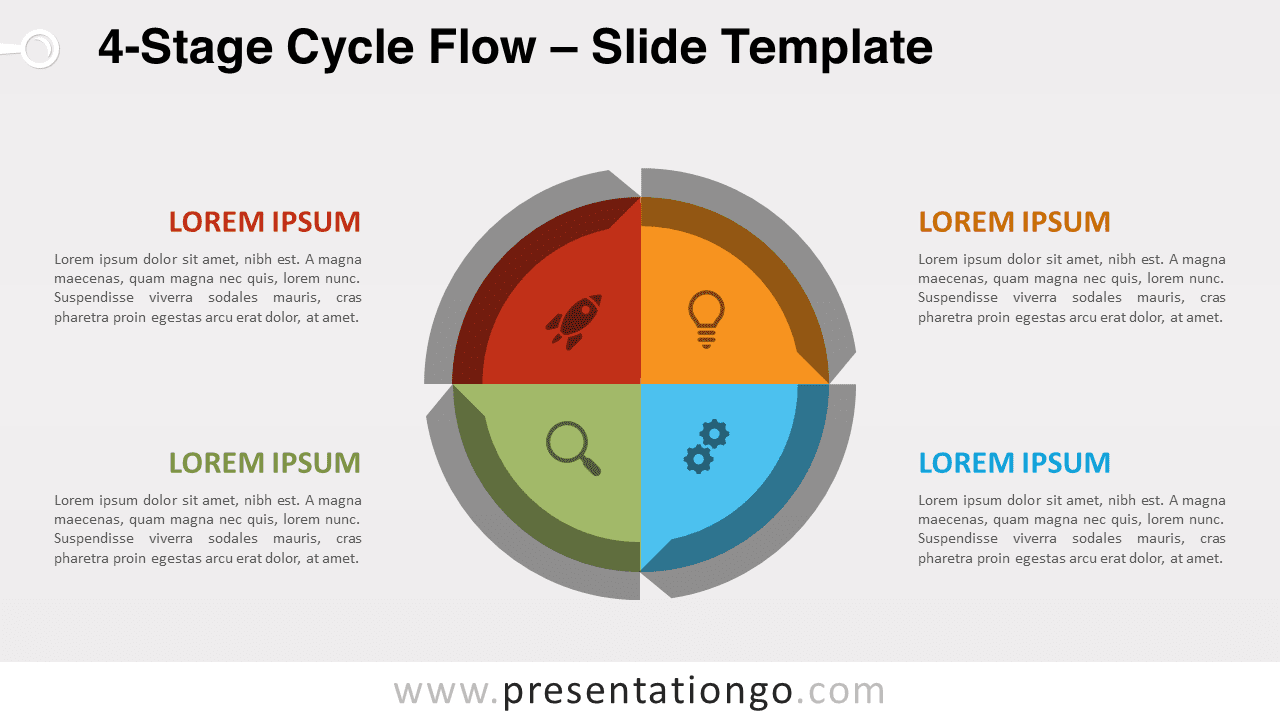
The 4-Stage Cycle Flow for PowerPoint & Google Slides features a 4-quadrant circular diagram to visually map repeating sequences, cycles & processes.
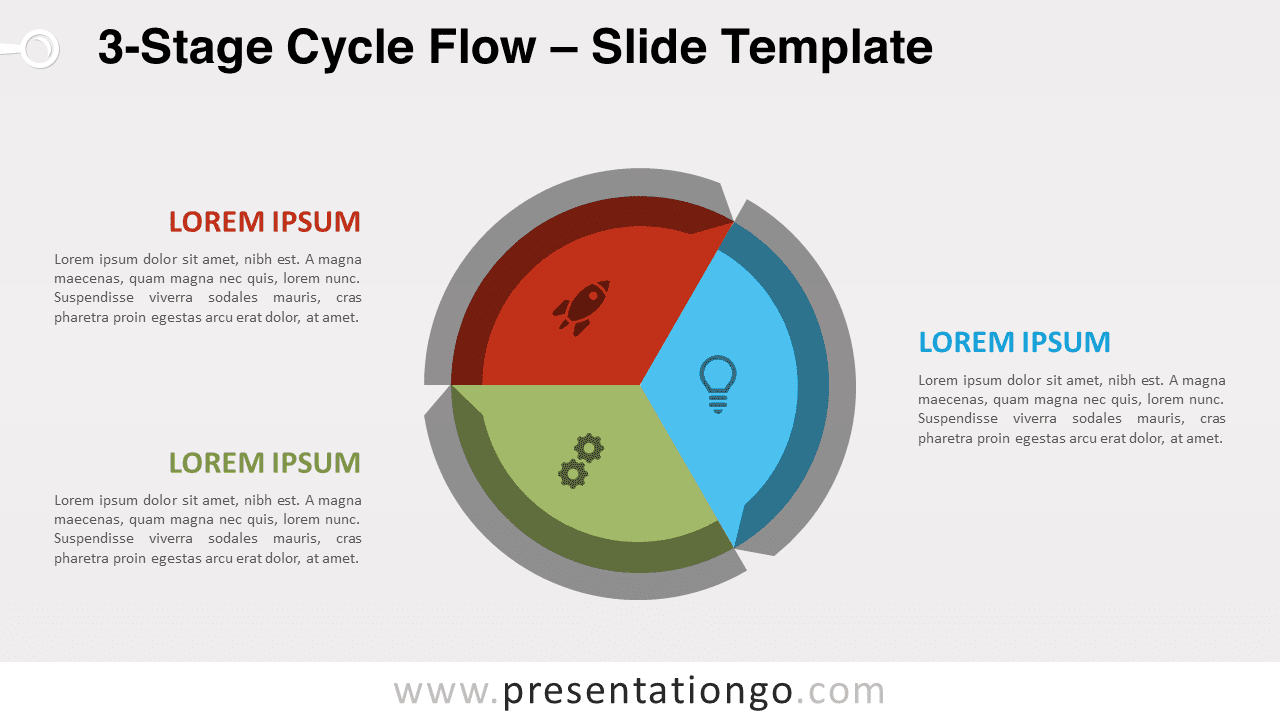
The 3-Stage Cycle Flow PowerPoint diagram offers a unique circular diagram to visually communicate repetitive workflows or processes.
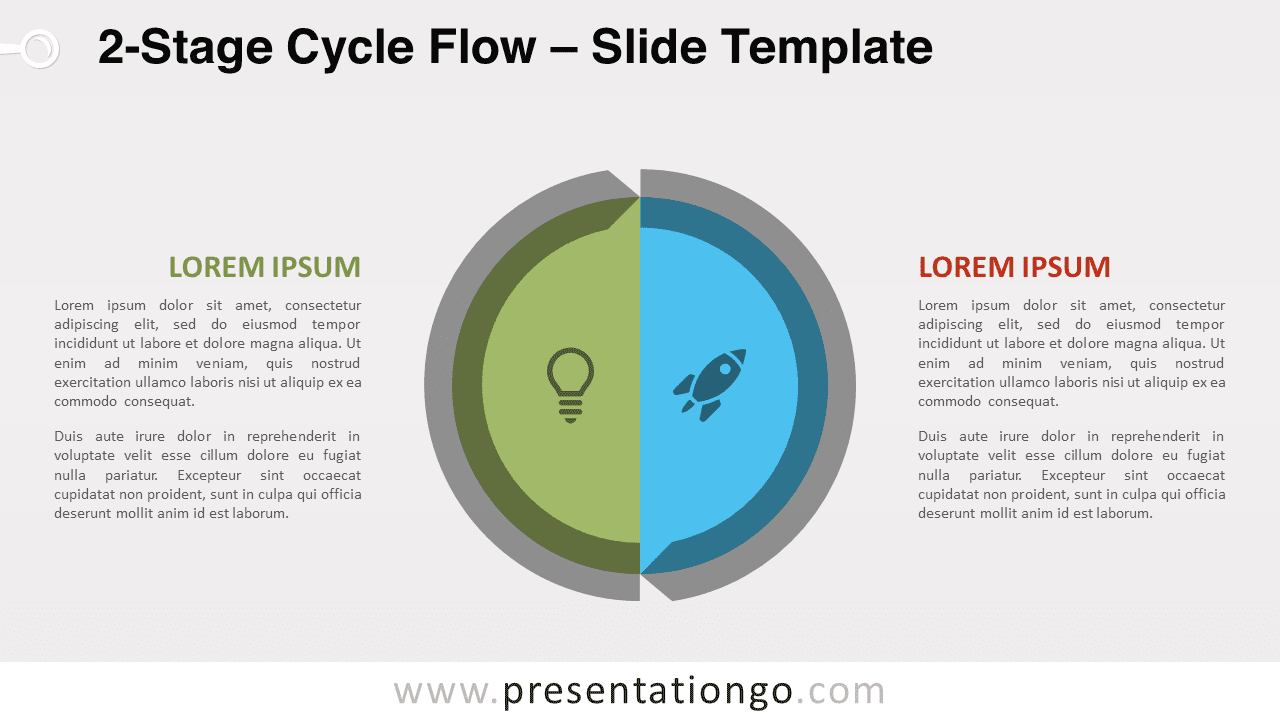
This 2-stage cycle flow PowerPoint diagram maps any repeating 2-phase process into a clean, circular visualization split into halves.
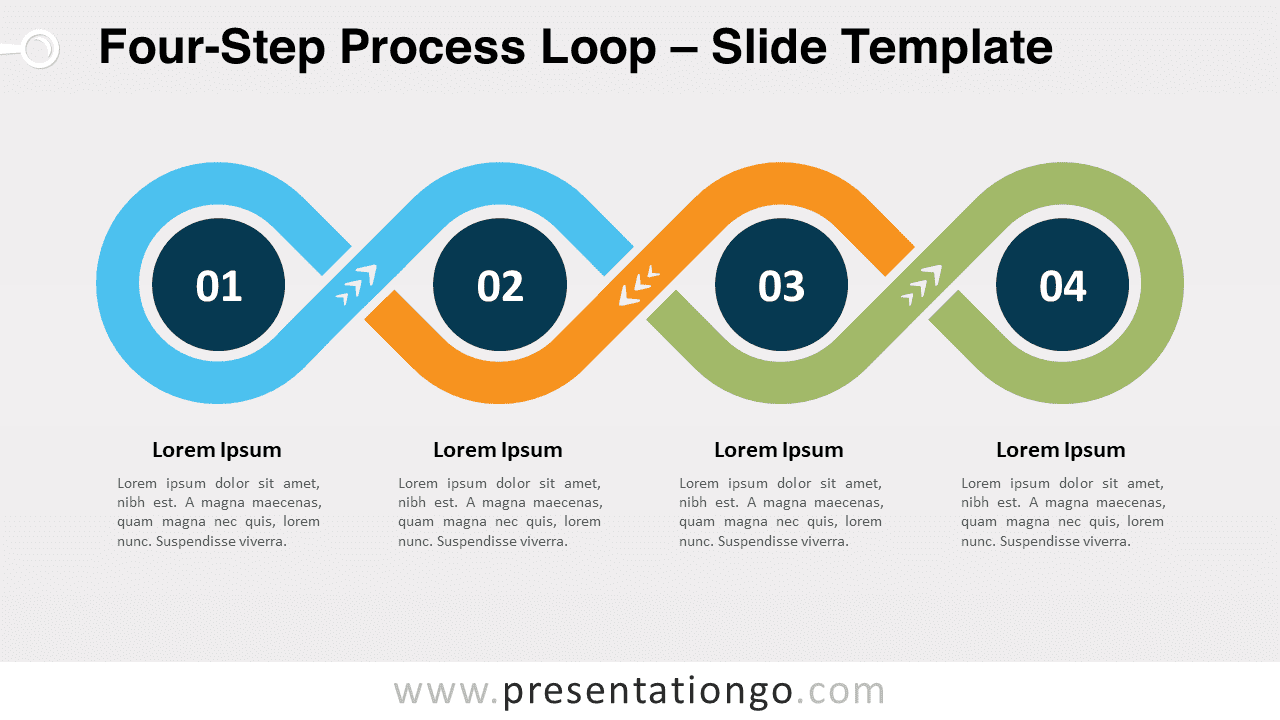
The Four-Step Process Loop for PowerPoint and Google Slides features interconnected infinity loops to display repeating four-phase sequences.
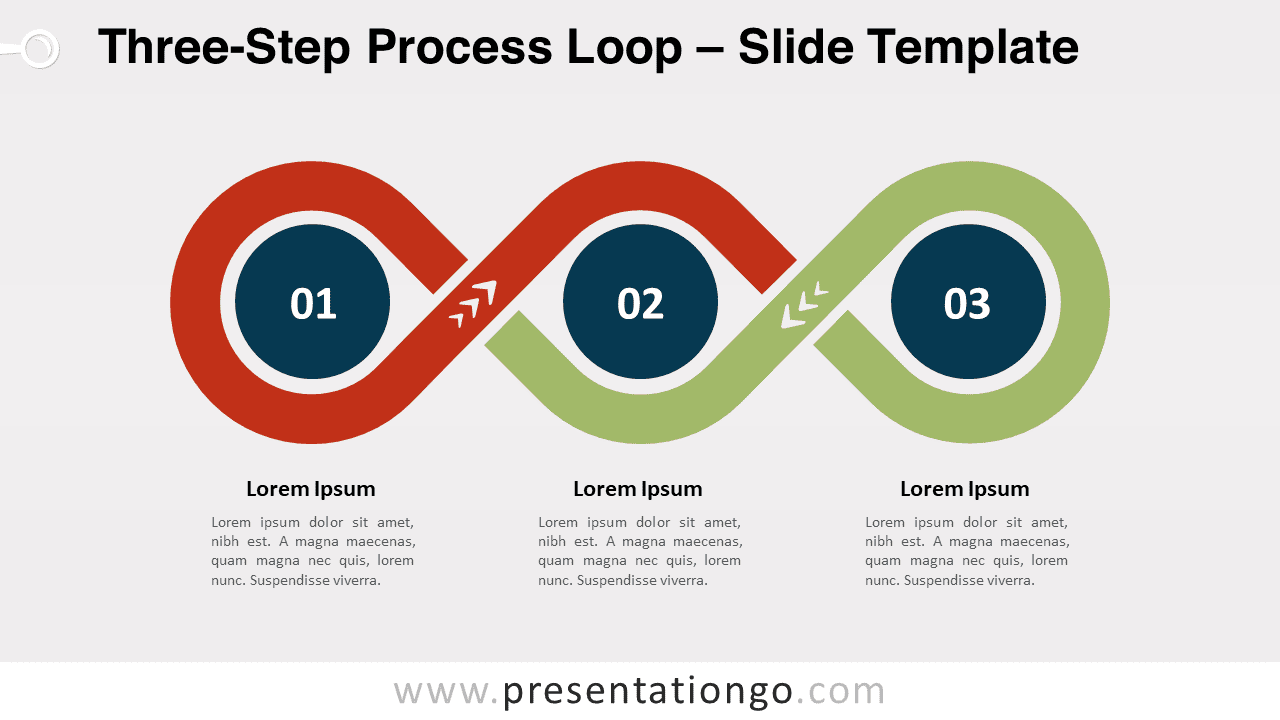
Showcase 3-part process in your PowerPoint & Google Slides presentation with interconnected infinity loops and circular numbered markers.
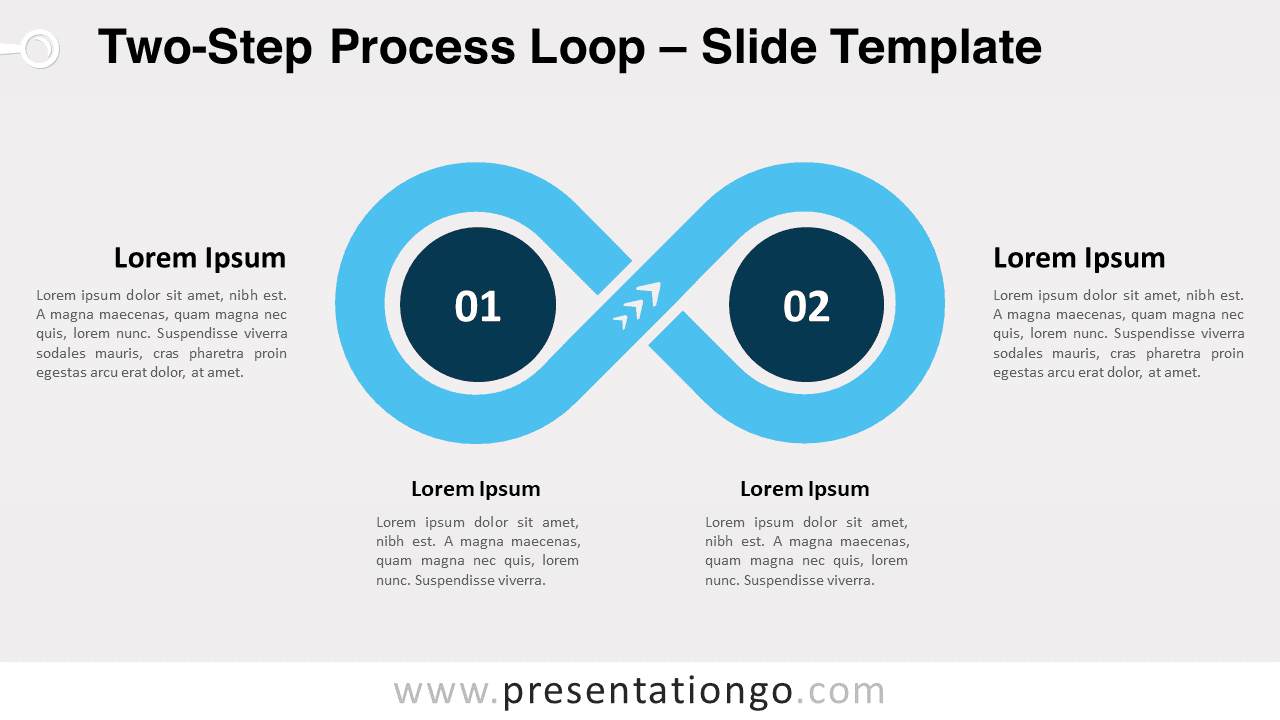
The Two-Step Process Loop PowerPoint & Google Slides diagram features interconnected loops for presenting repetitive processes or sequences.