Loading resources…
Total 1760 resources
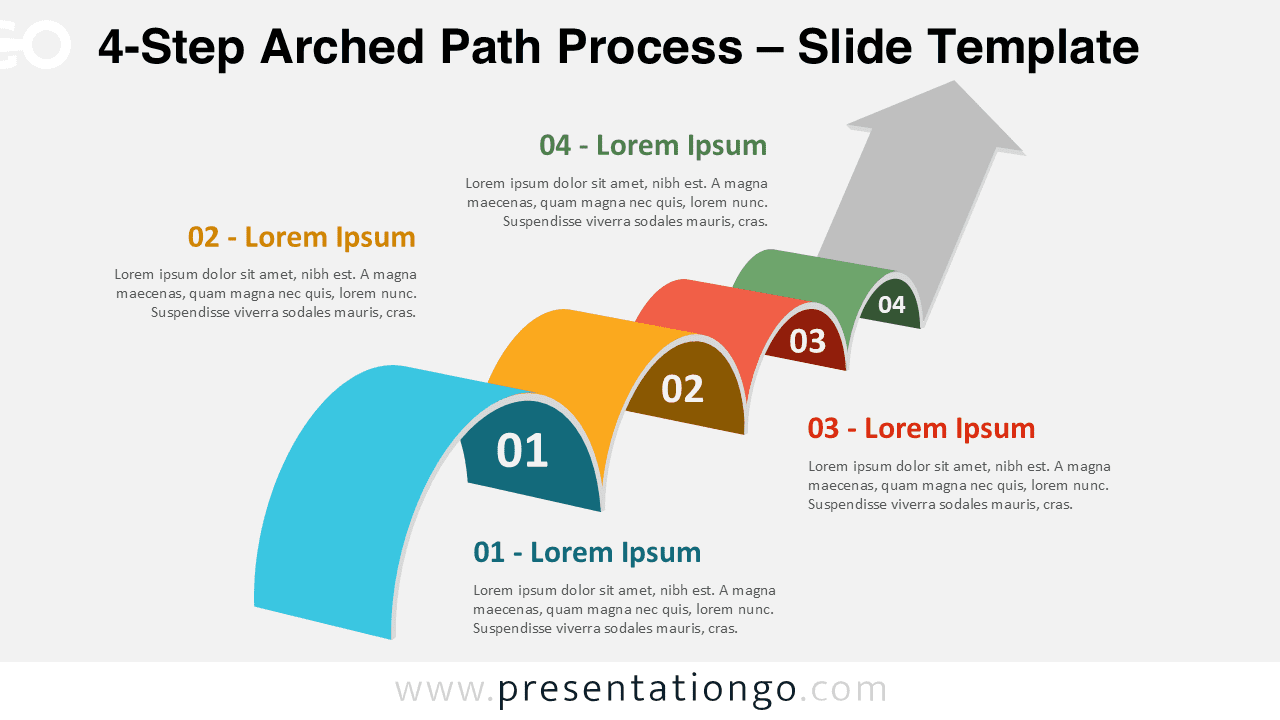
Show progress across four steps with the 4-Step Arched Path Process. Free, editable diagram for PowerPoint and Google Slides featuring curved 3D arches.
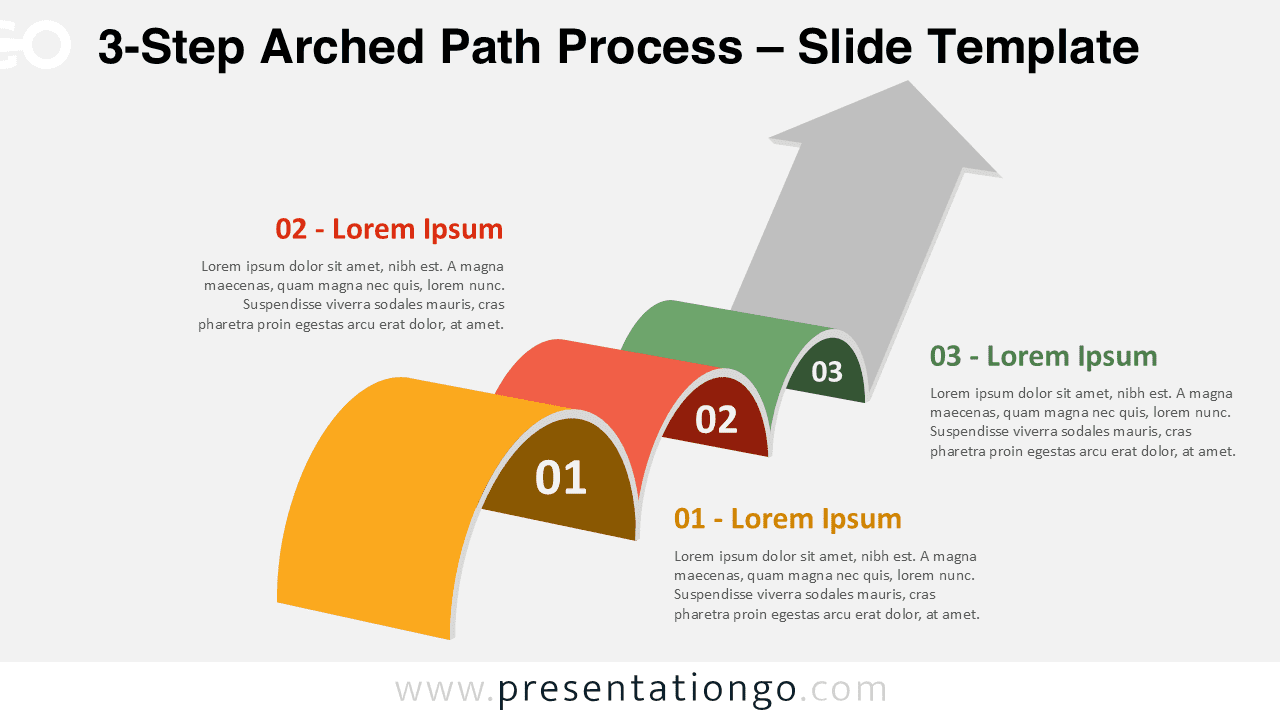
Free 3-Step Arched Path Process diagram for PowerPoint and Google Slides. Perfect for workflows, goals, milestones, and business stages.
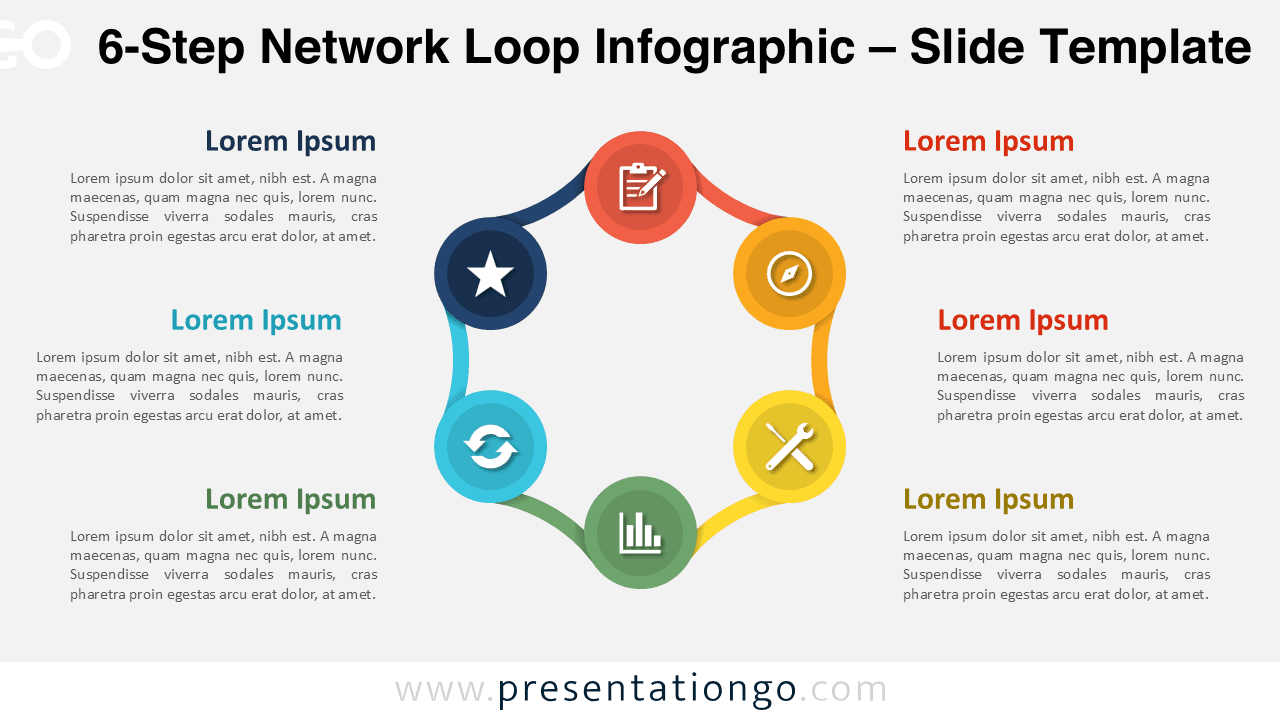
Download this 6-Step Network Loop Infographic for PowerPoint and Google Slides. Display six connected elements in a circular flow for any project.
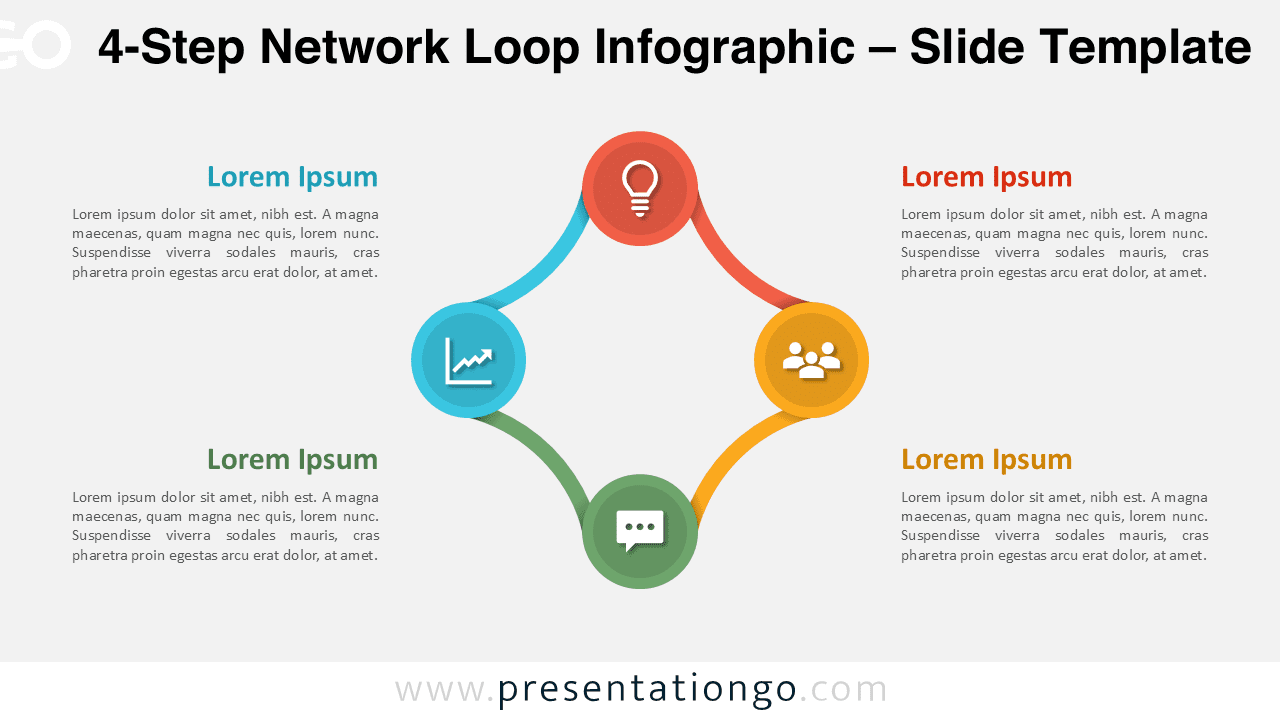
Download the 4-Step Network Loop Infographic to display four linked stages in a cycle. Easily editable in PowerPoint and Google Slides.
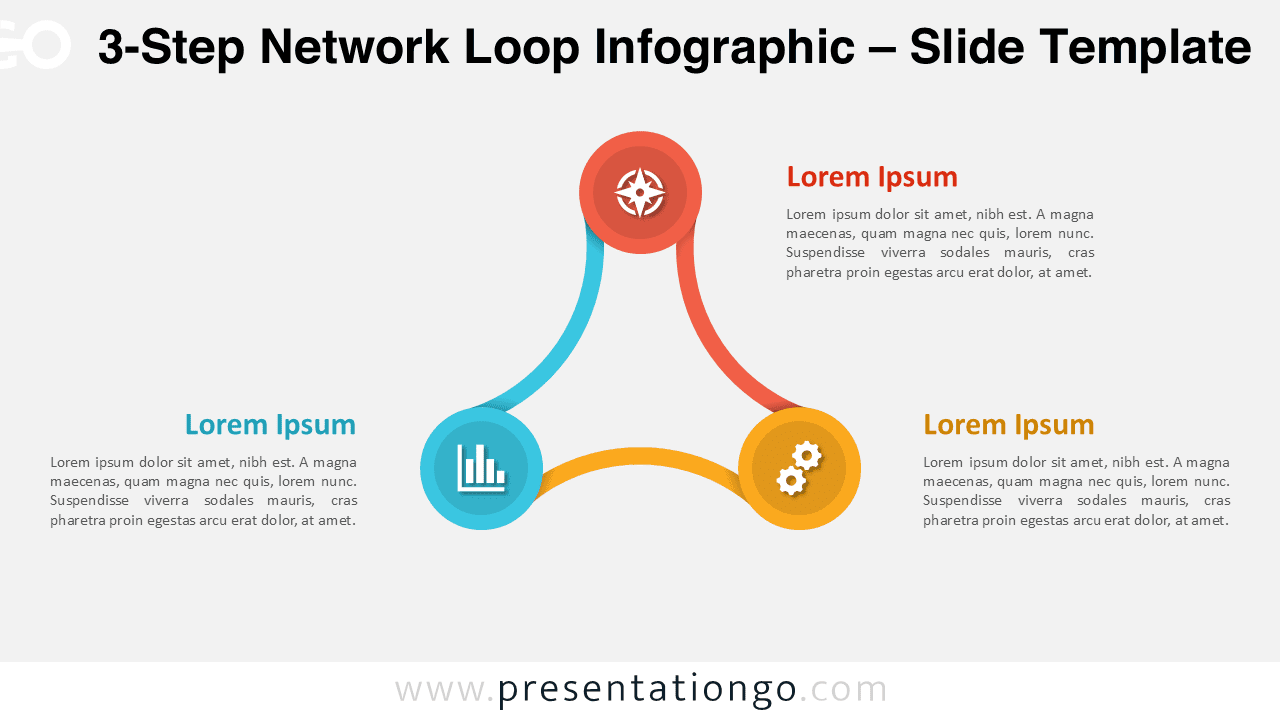
Download the 3-Step Network Loop Infographic to illustrate workflow or teamwork concepts. Fully editable for PowerPoint and Google Slides presentations.
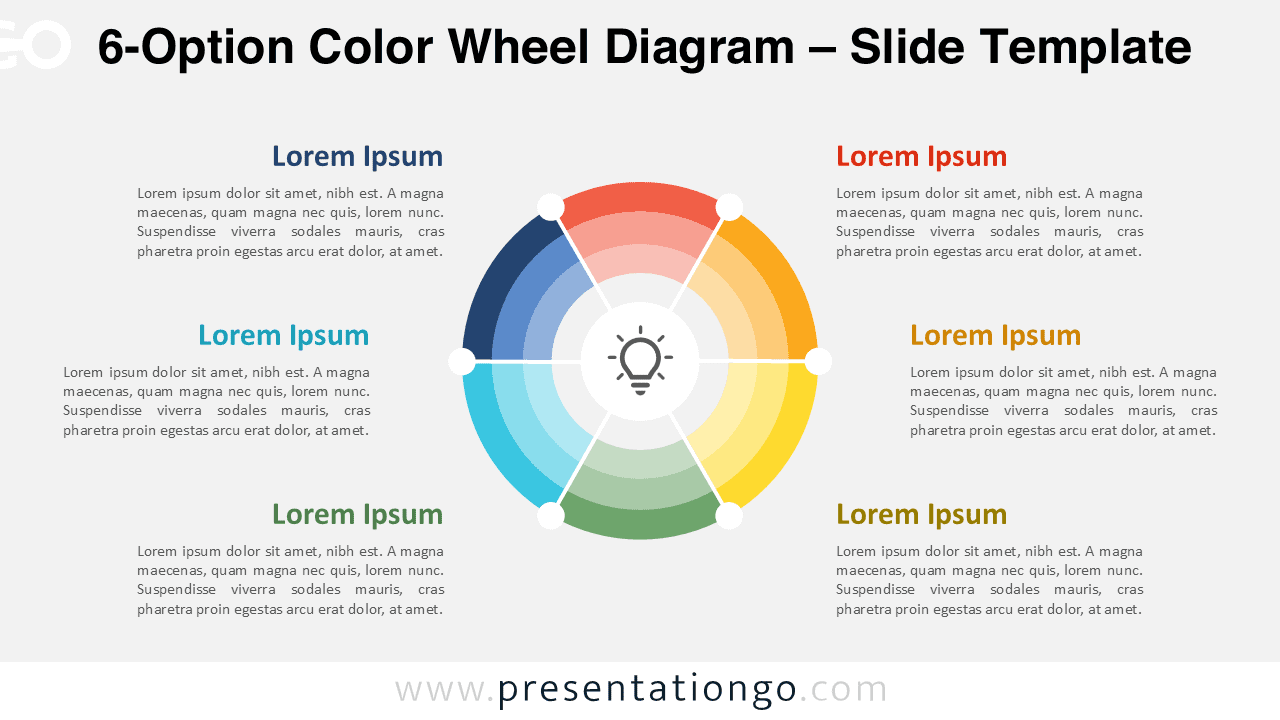
Show six related stages or categories in one cohesive wheel. The 6-option color wheel diagram is fully editable for PowerPoint and Google Slides.
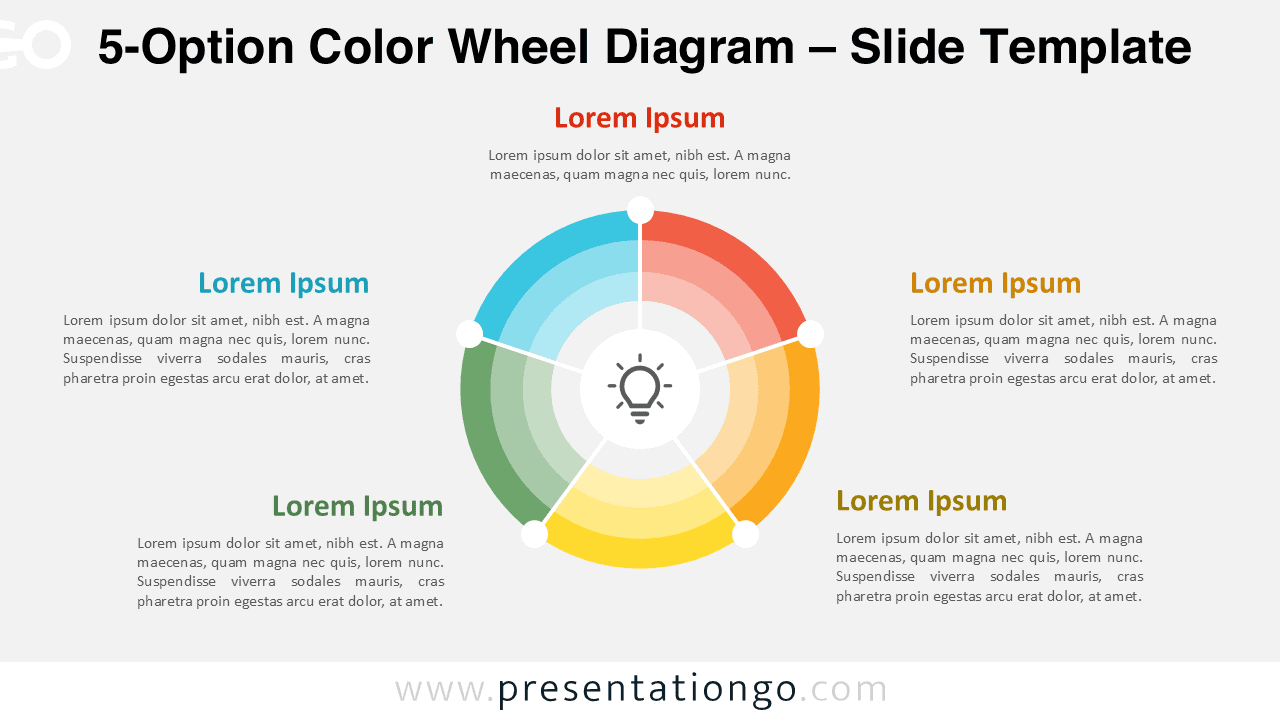
Illustrate five connected ideas or steps with a bright radial layout. The 5-option color wheel diagram is editable for PowerPoint and Google Slides.
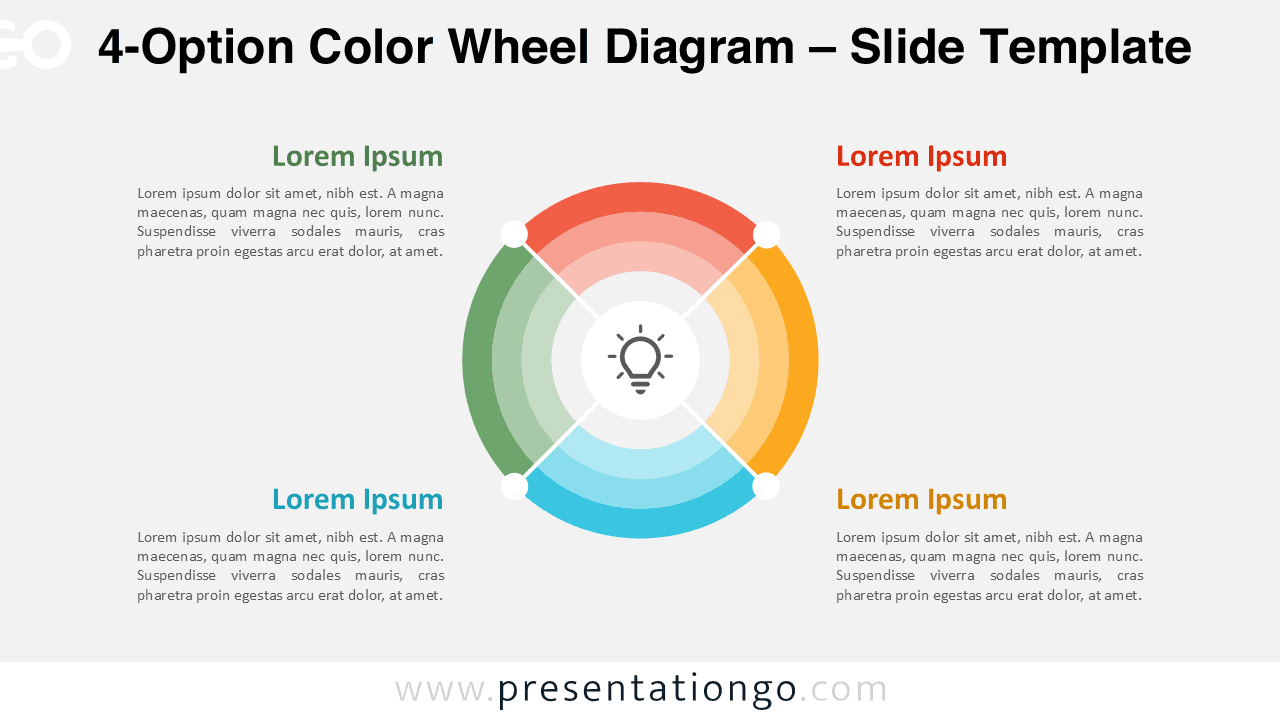
Visualize a four-step process or cycle with this modern color wheel diagram for PowerPoint and Google Slides. Simple and customizable.
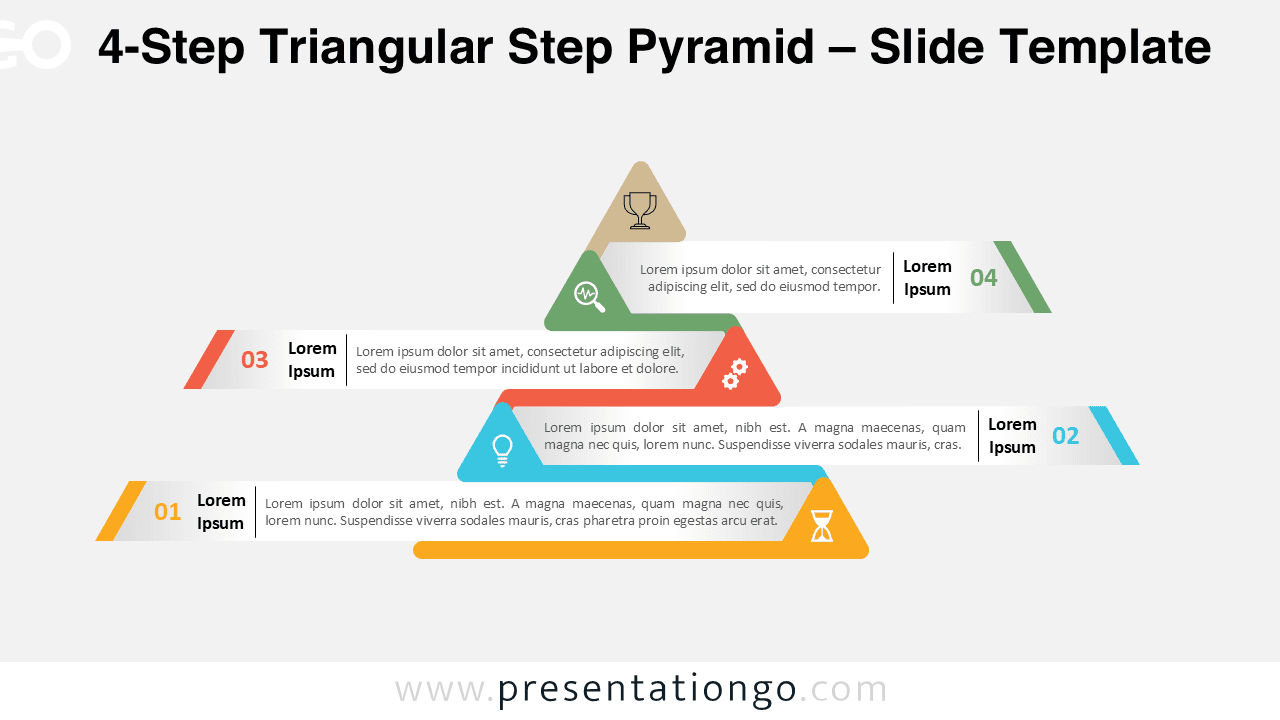
Showcase four process stages with this editable 4-Step Triangular Step Pyramid. Great for business, planning, or strategic models.
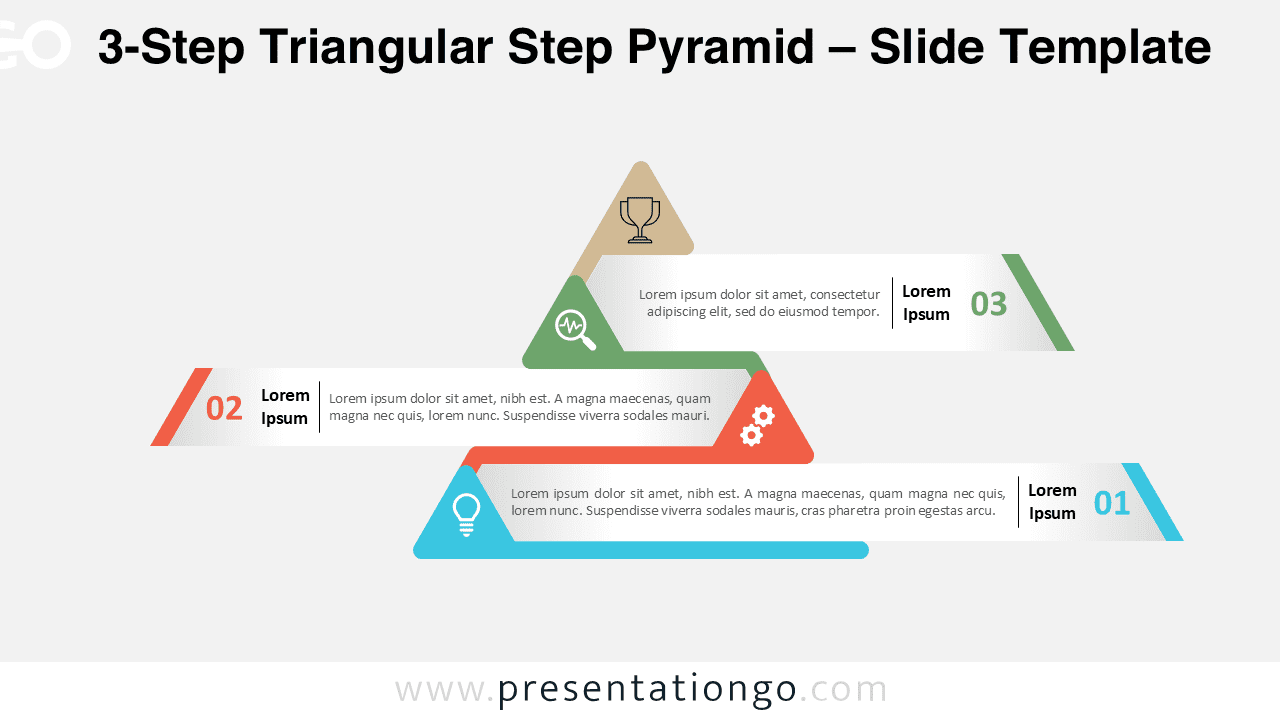
Illustrate three key stages with this 3-Step Triangular Step Pyramid for PowerPoint and Google Slides. Perfect for growth, process, or strategic hierarchy visuals.
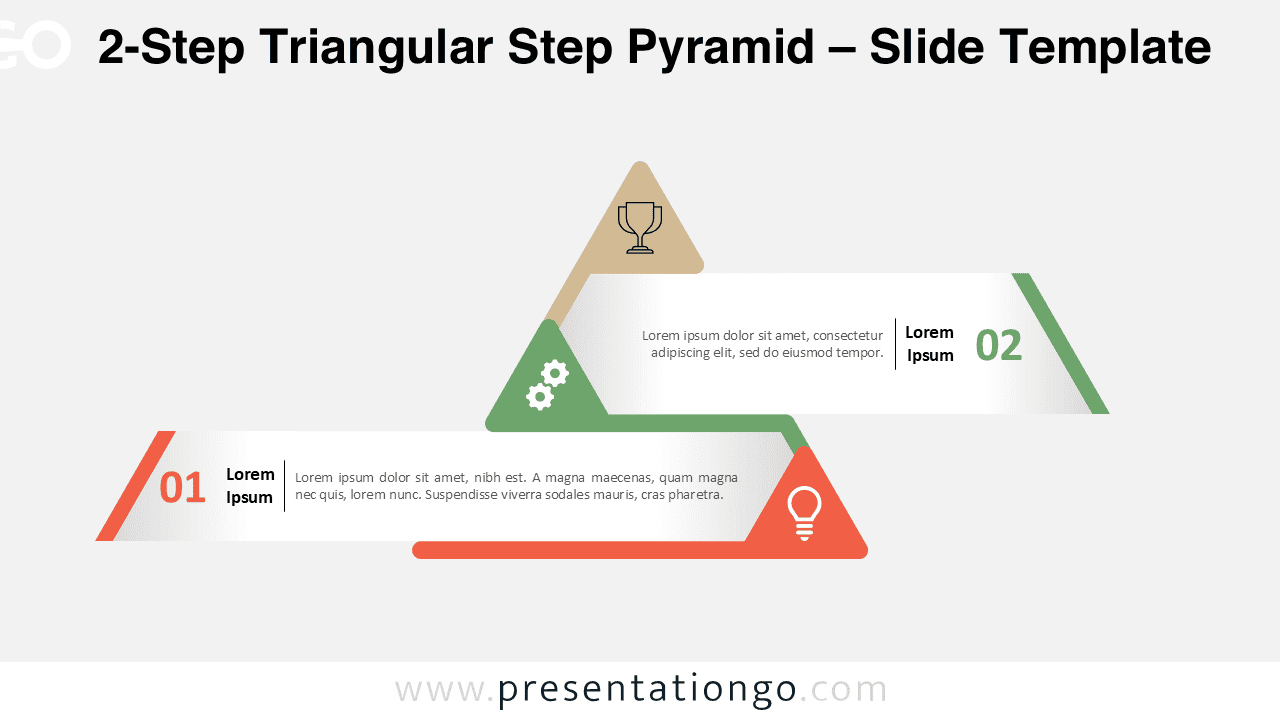
Show progress and hierarchy with this 2-Step Triangular Step Pyramid for PowerPoint and Google Slides. Perfect for illustrating sequential processes.
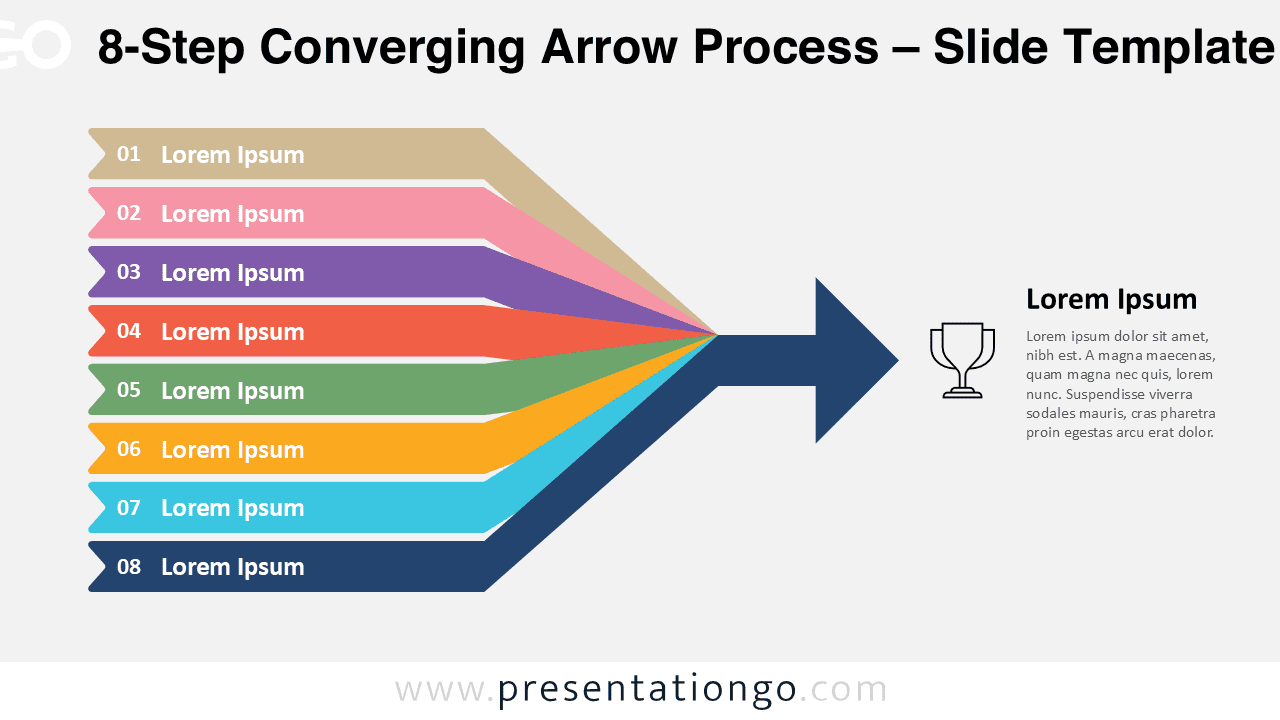
Visualize eight connected stages converging toward one objective with this PowerPoint and Google Slides template.
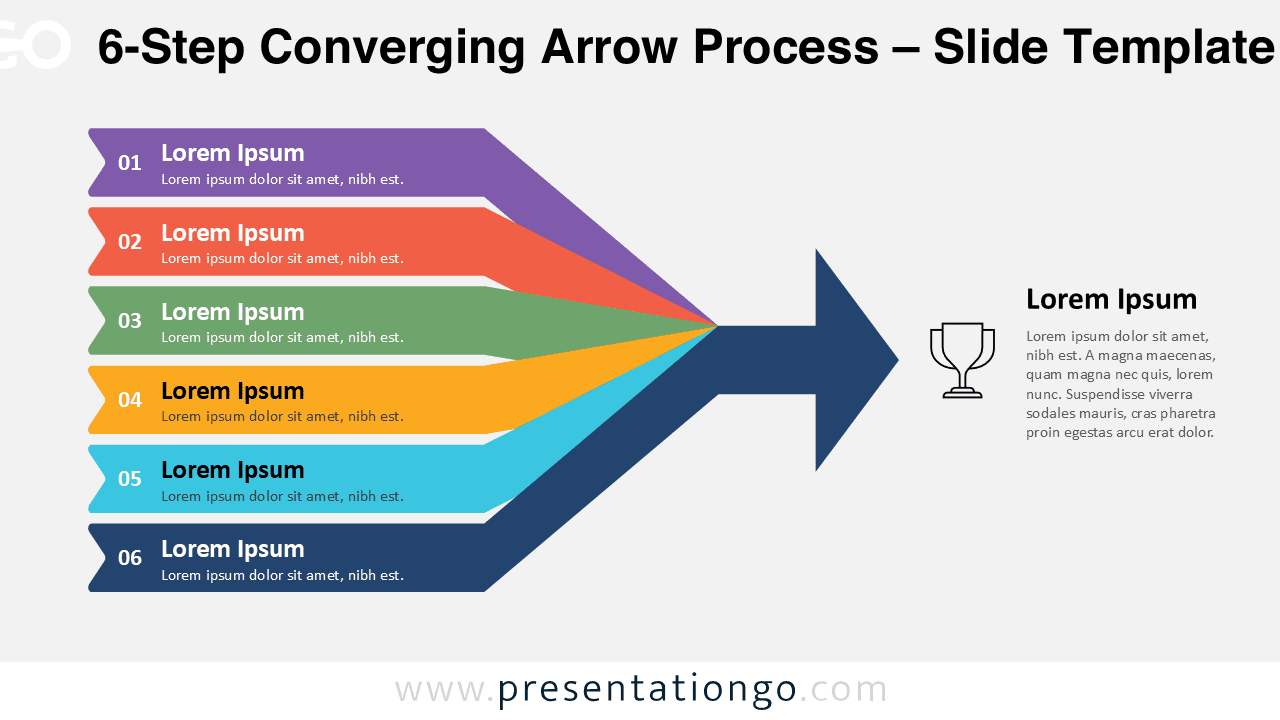
Present six phases converging into a single direction with this modern Converging Arrow Process template for PowerPoint and Google Slides.
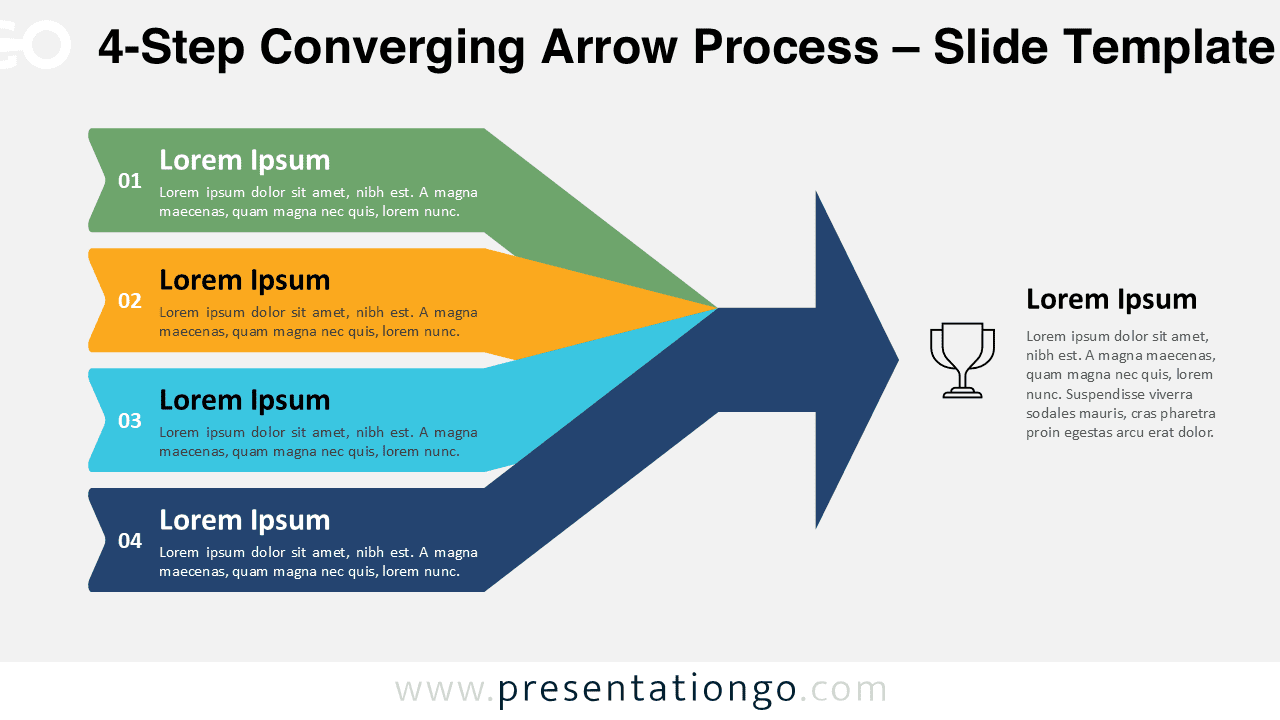
Present a clear direction and unified goal using this 4-Step Converging Arrow Process template for PowerPoint and Google Slides.
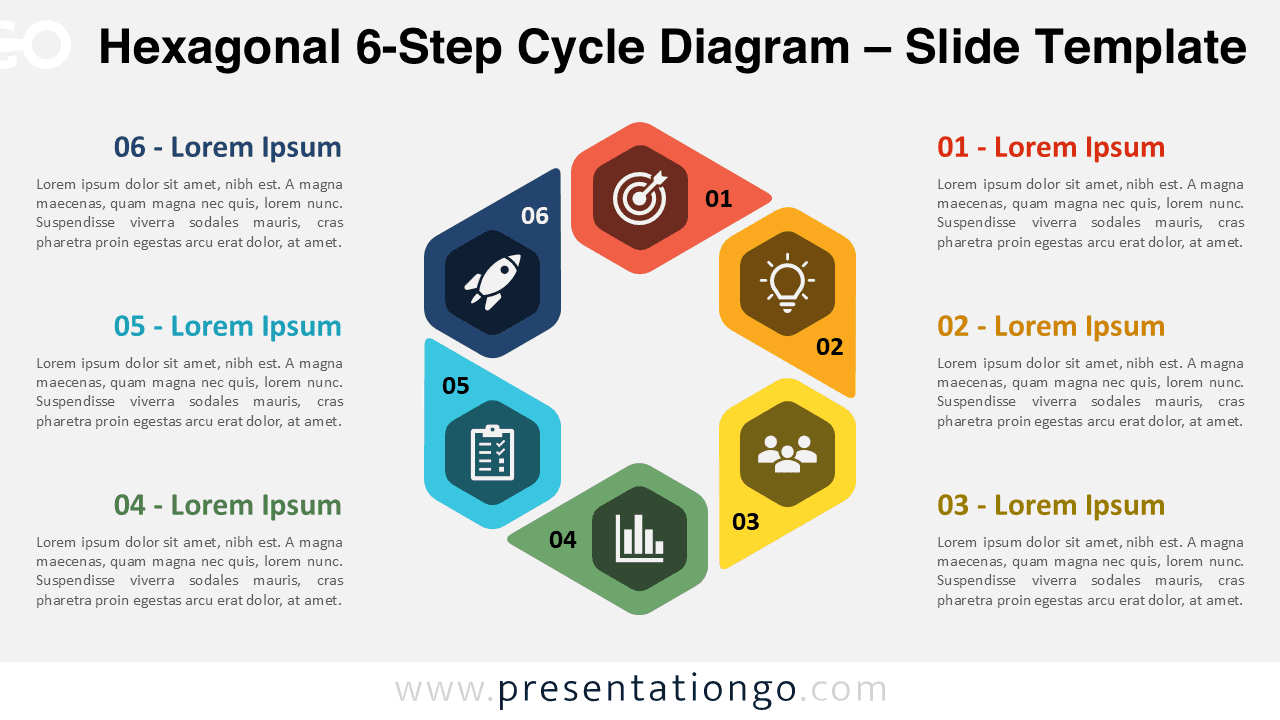
Use this colorful 6-step hexagon infographic to illustrate circular workflows and processes in your PowerPoint and Google Slides presentations.
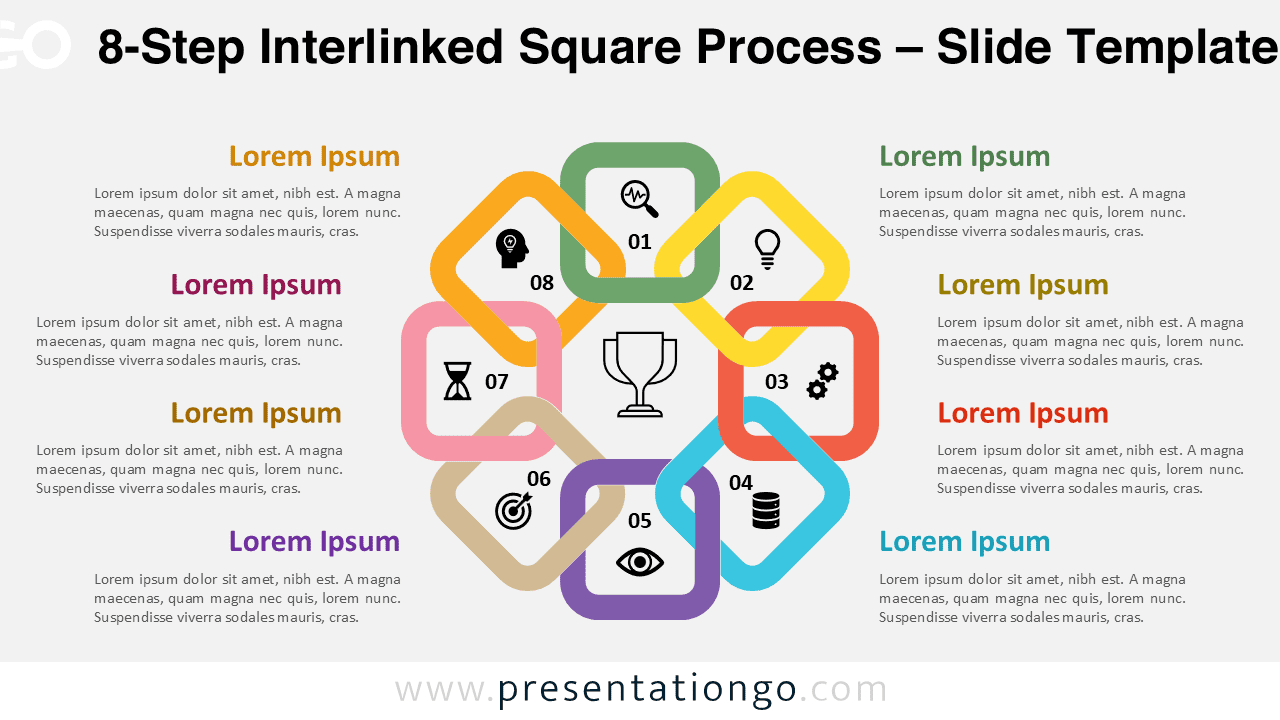
Visualize continuous flow or teamwork using this 8-Step Interlinked Square Process diagram. Fully editable for PowerPoint and Google Slides.
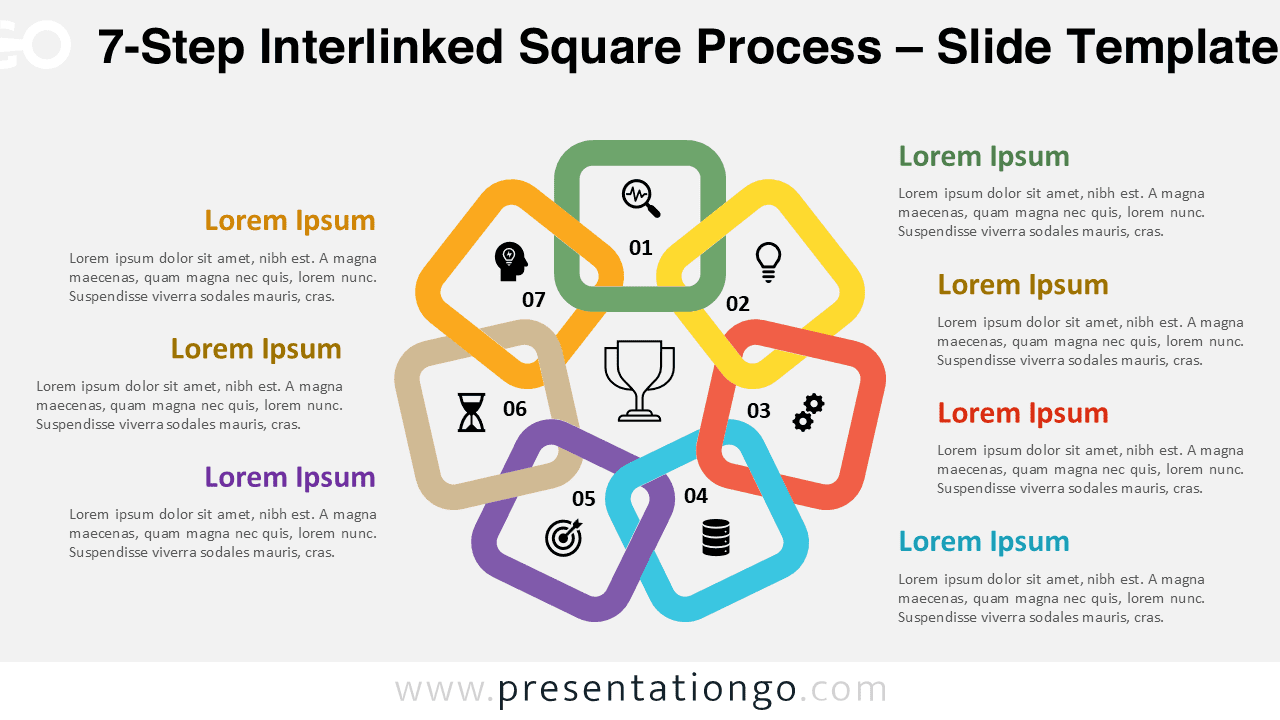
Visualize seven connected stages using this Interlinked Square Process diagram. Easy to edit and customize for PowerPoint and Google Slides.
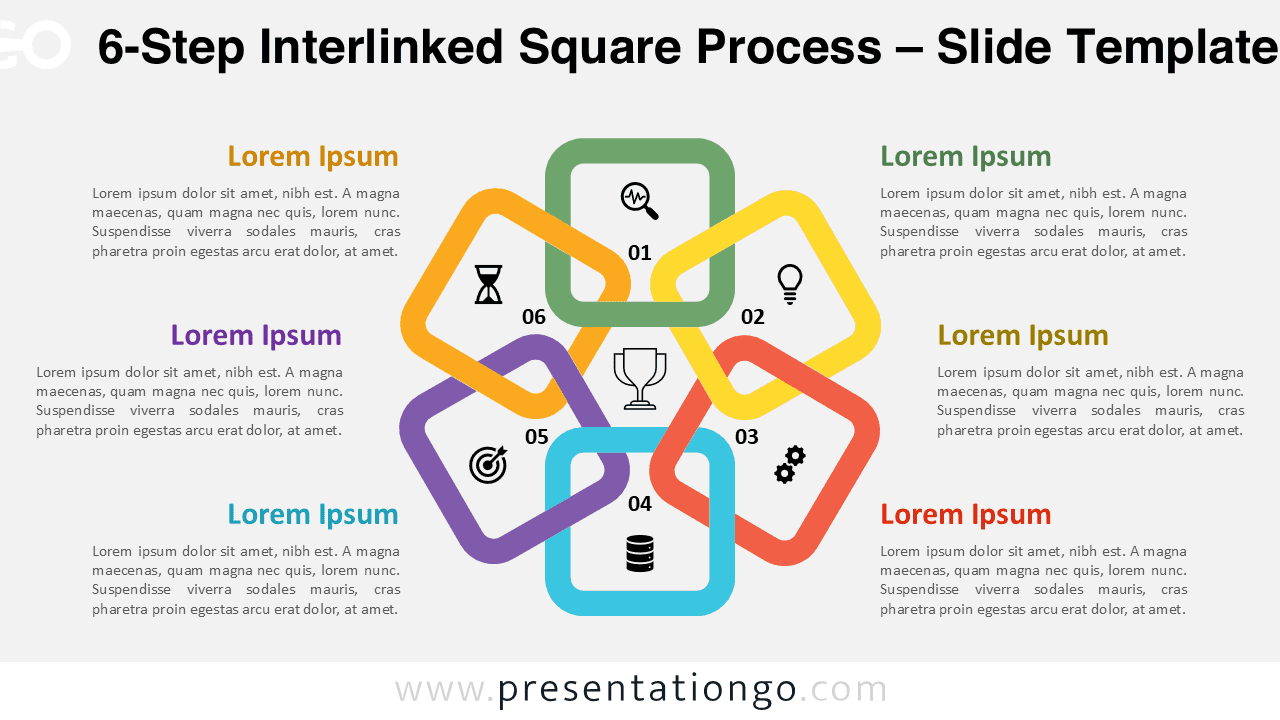
Show six connected stages or ideas using this 6-Step Interlinked Square Process diagram. Fully editable for PowerPoint and Google Slides.
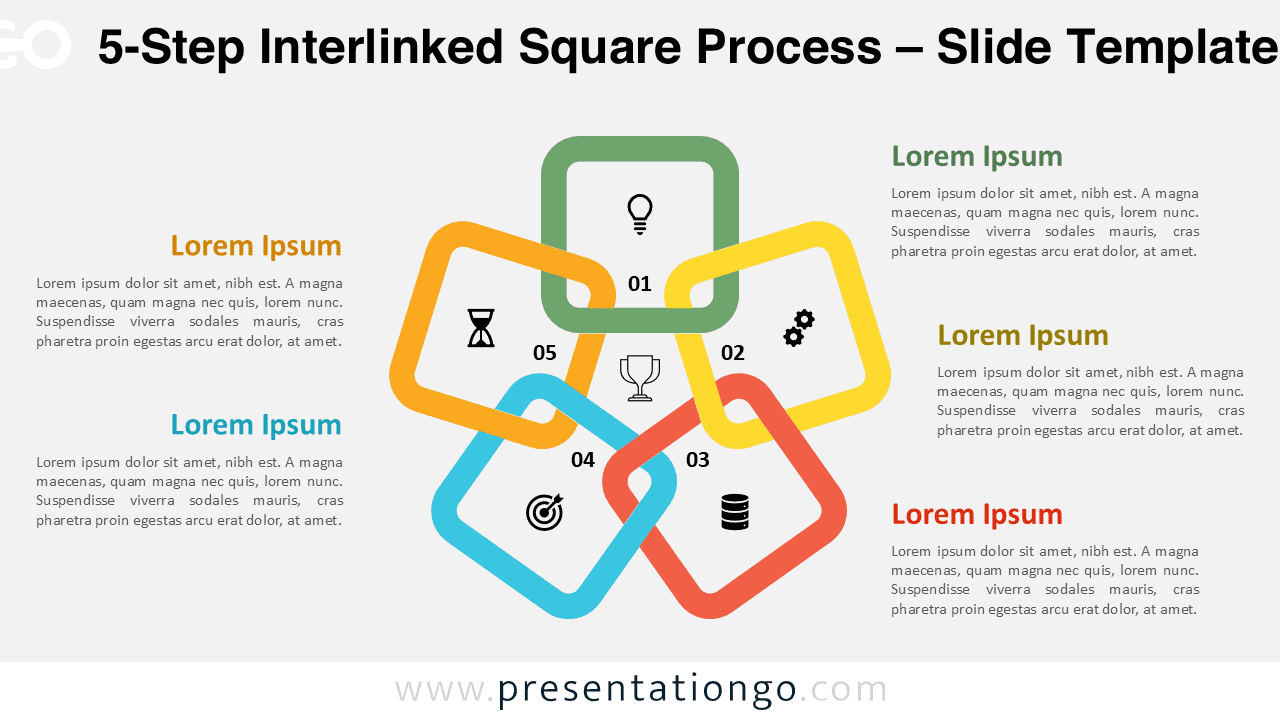
Download this 5-Step Interlinked Square Process diagram to illustrate cycles, steps, or connections in PowerPoint and Google Slides.
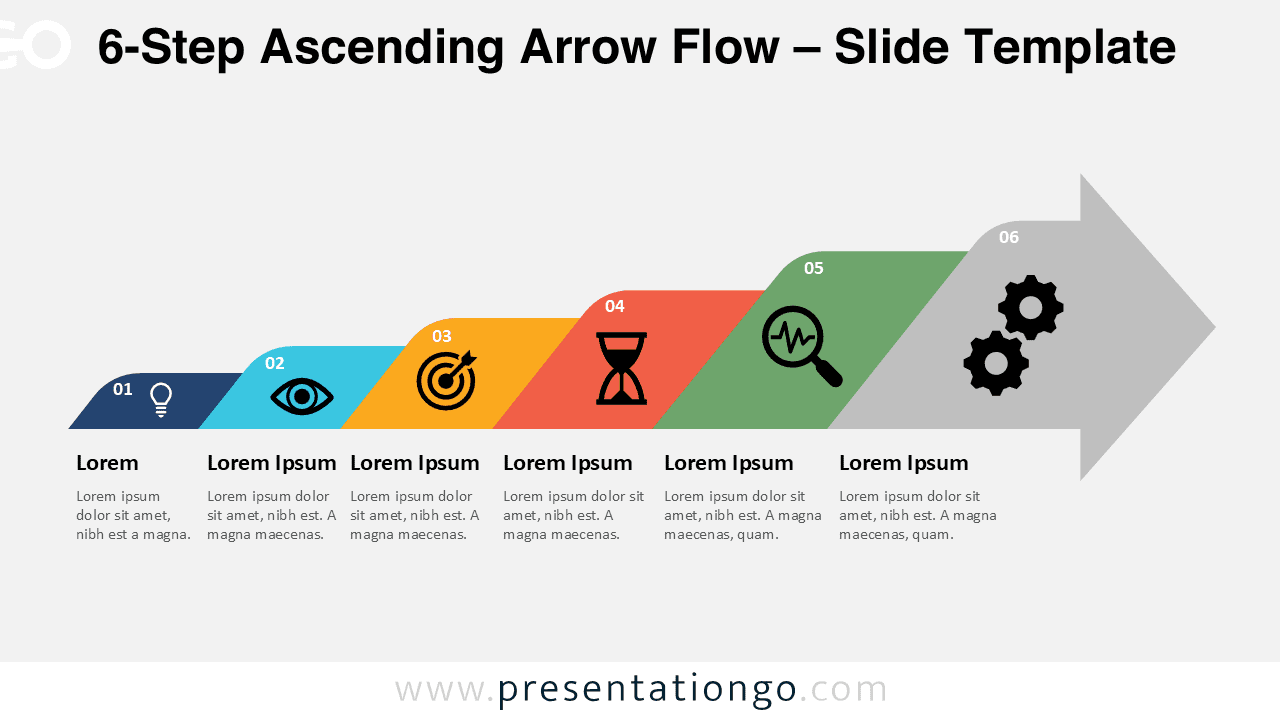
Download the 6-Step Ascending Arrow Flow template to present your process or growth stages in PowerPoint and Google Slides.
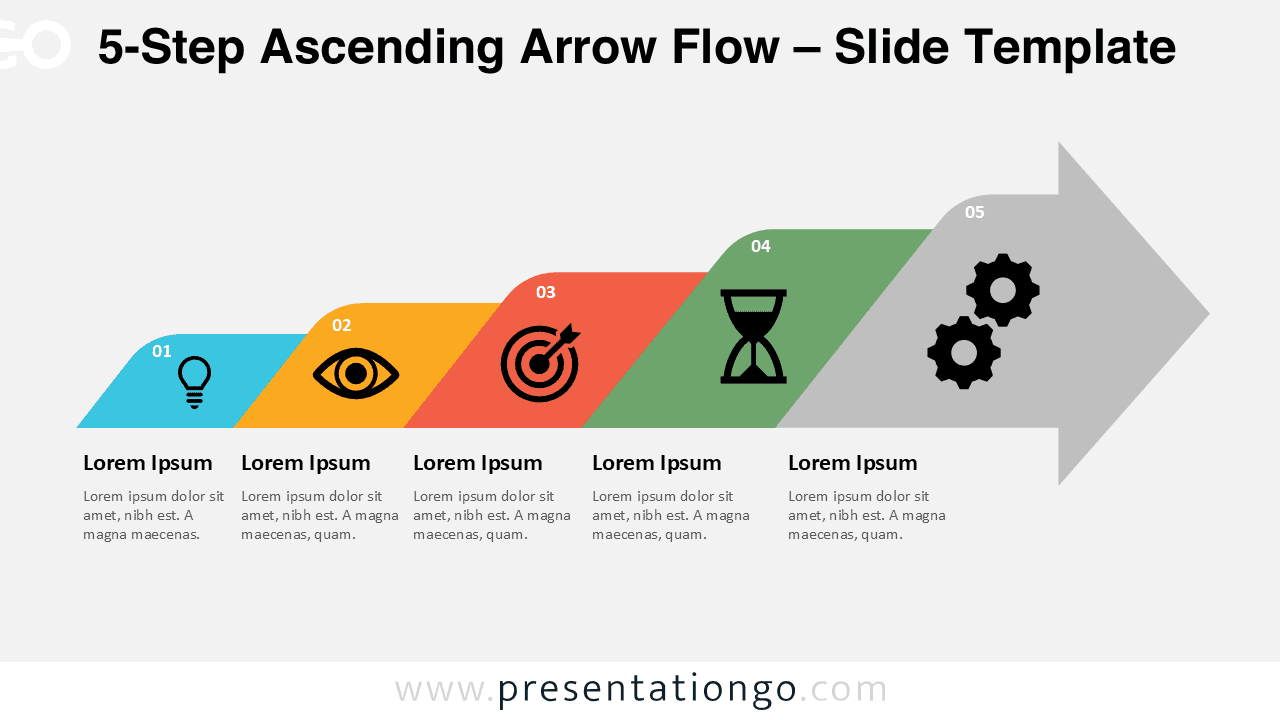
Download this 5-step arrow diagram template for PowerPoint and Google Slides to present linear progression and key milestones.
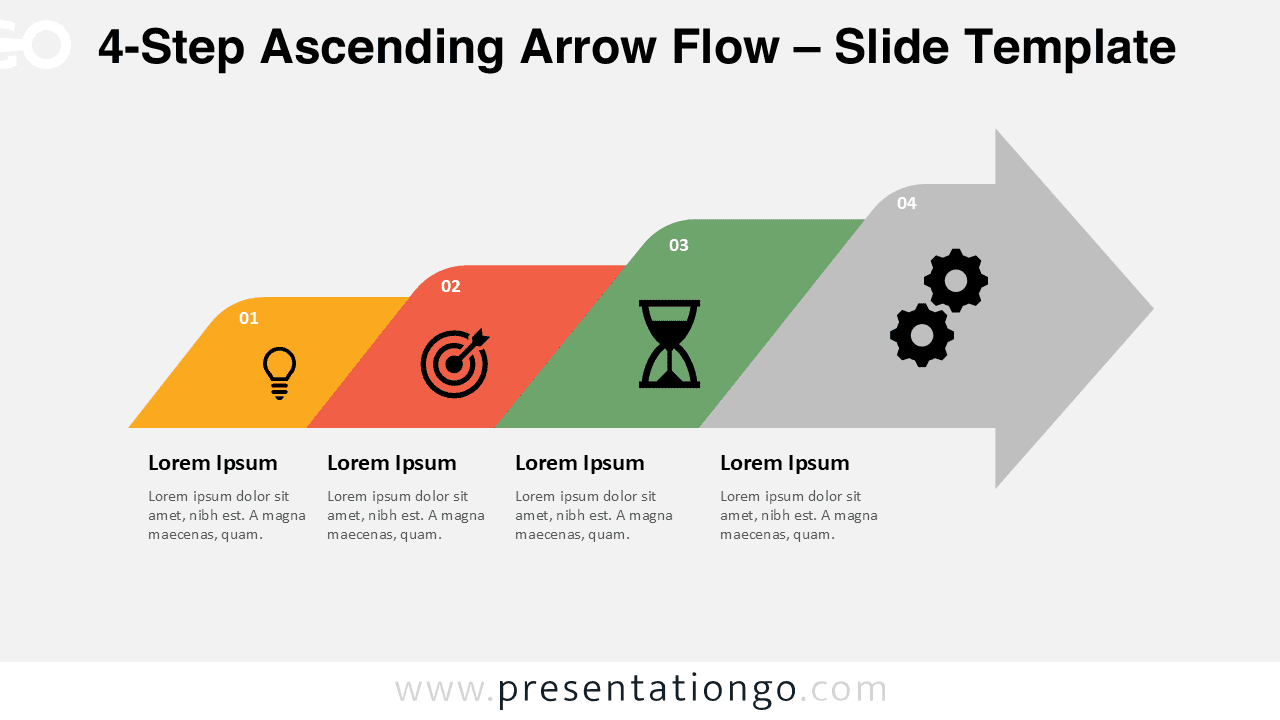
Showcase progress with this 4-Step Ascending Arrow Flow template for PowerPoint and Google Slides. Ideal for growth and planning.
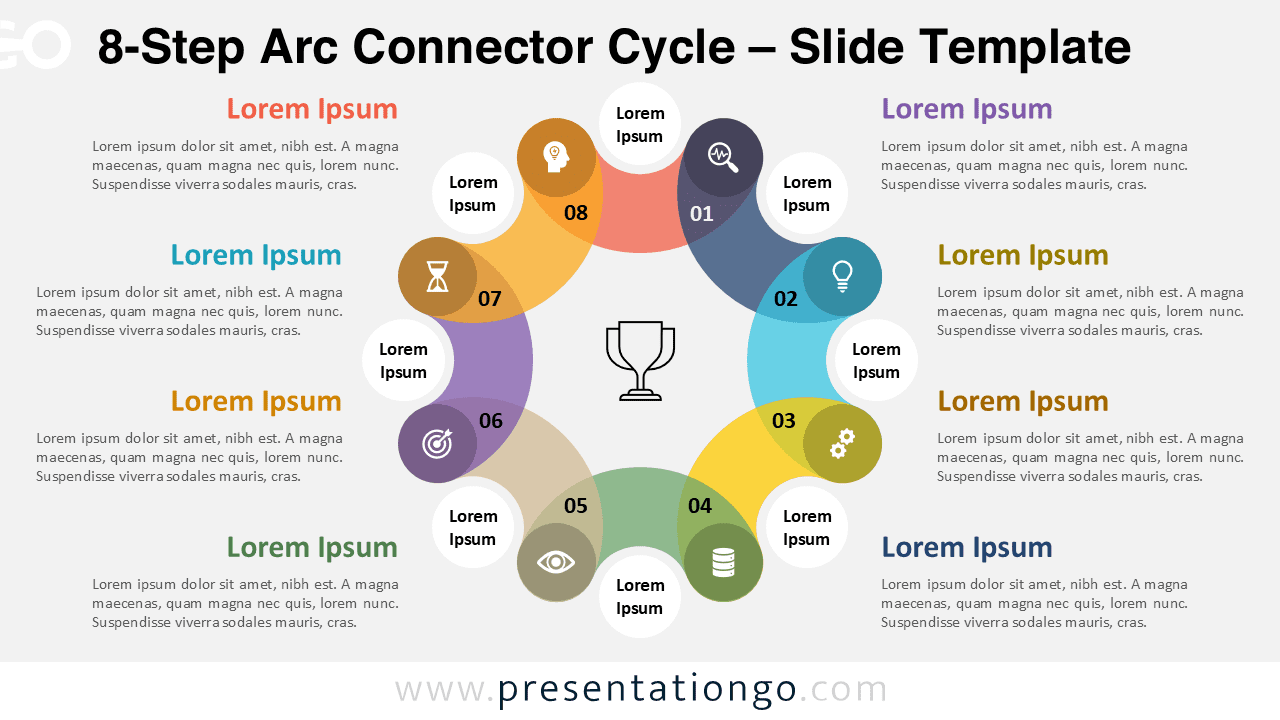
Free PowerPoint and Google Slides 8-Step Arc Connector Cycle for business, workflow, and process visualization.
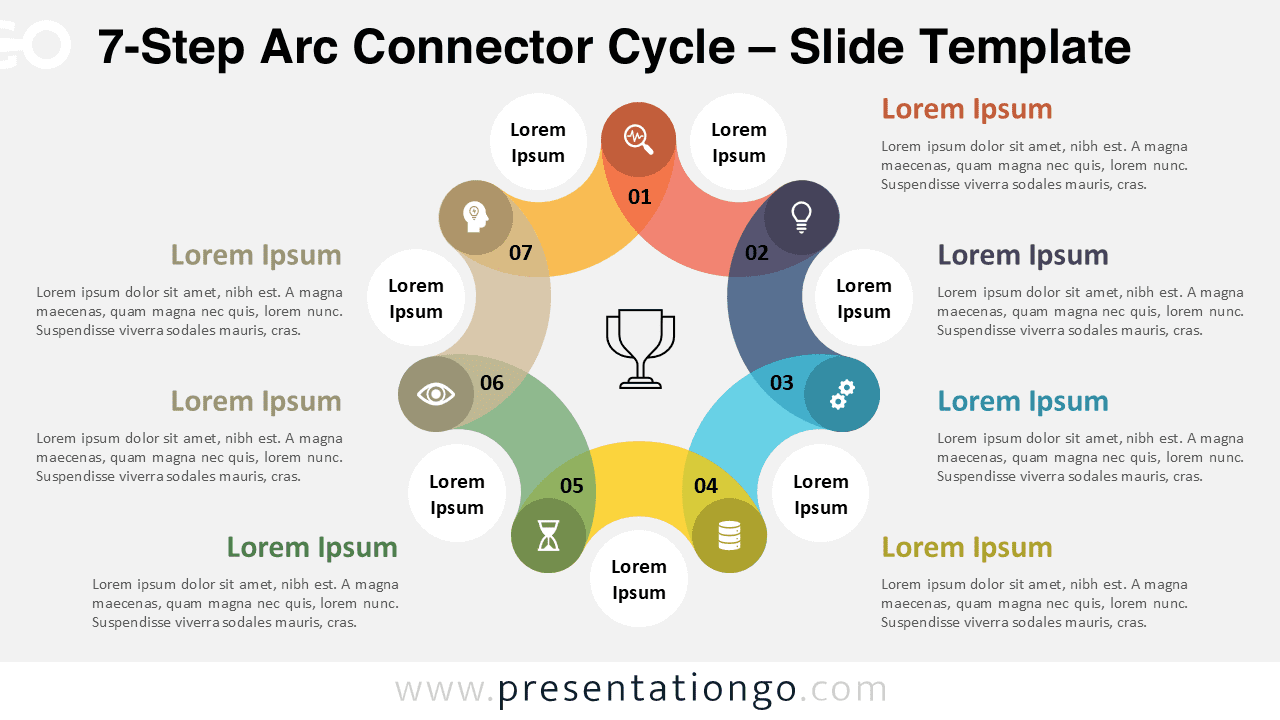
Download this 7-Step Arc Connector Cycle template for PowerPoint and Google Slides to show circular process or workflow stages.