Loading resources…
Total 1760 resources
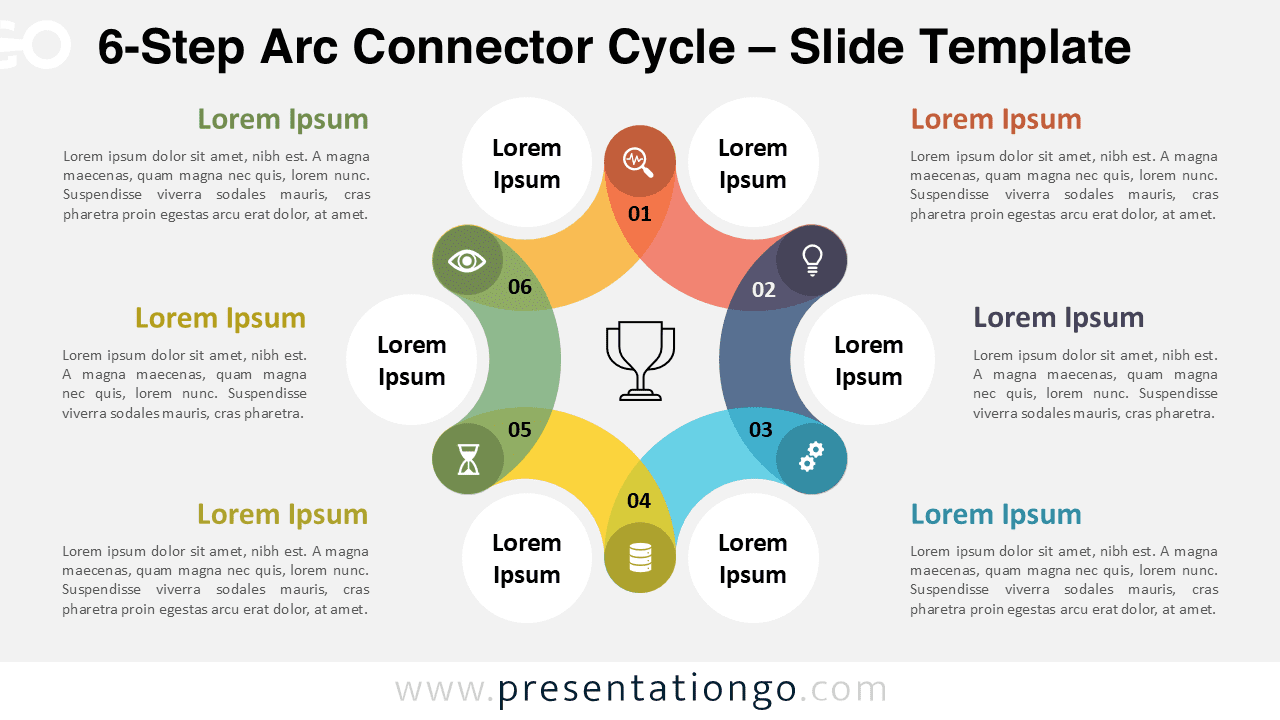
Free 6-Step Arc Connector Cycle PowerPoint and Google Slides template to visualize circular processes with editable arcs and icons.
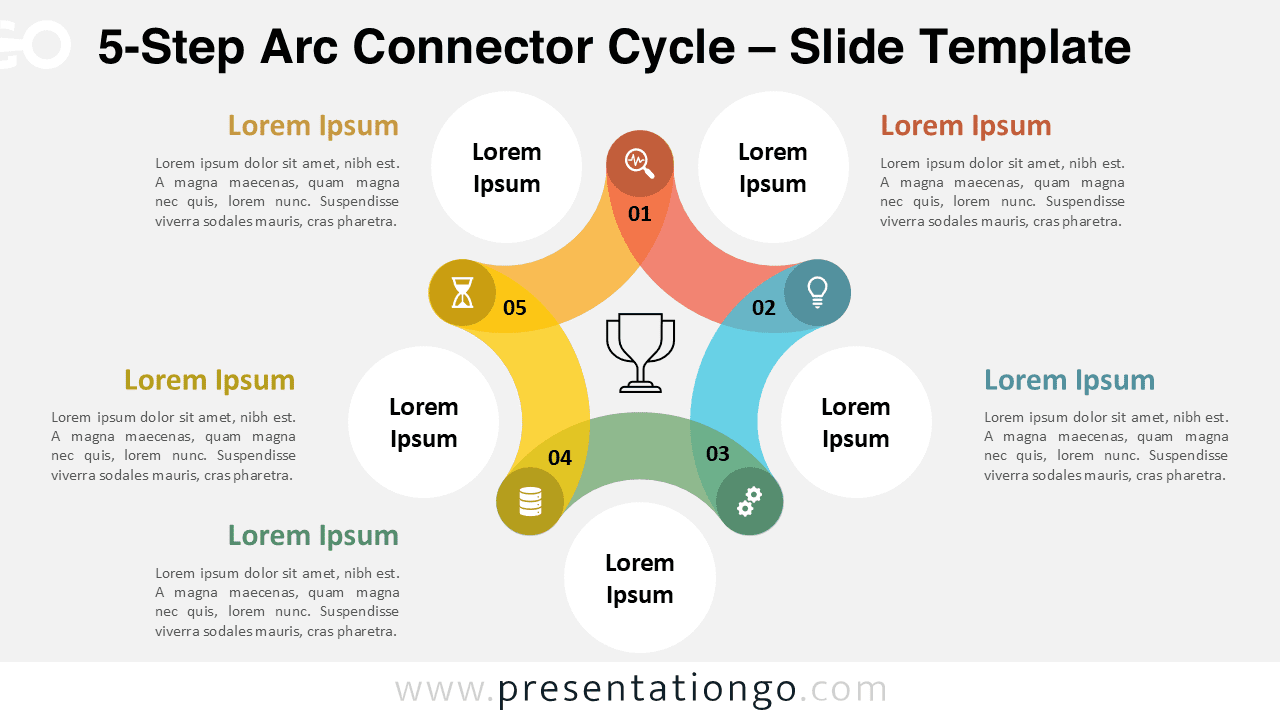
Free 5-Step Arc Connector Cycle PowerPoint template and Google Slides design for visualizing circular workflows, processes, and cycles.
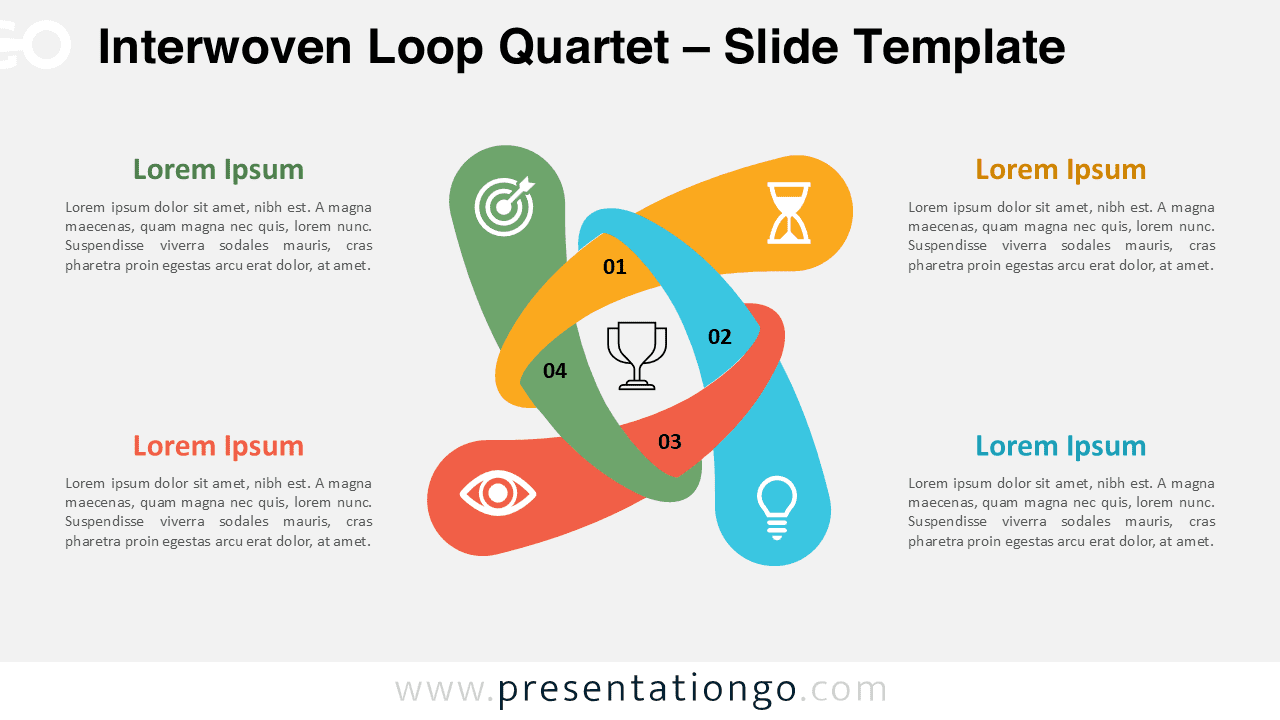
Download the Interwoven Loop Quartet PowerPoint and Google Slides template to present four connected steps in a clear and professional design.
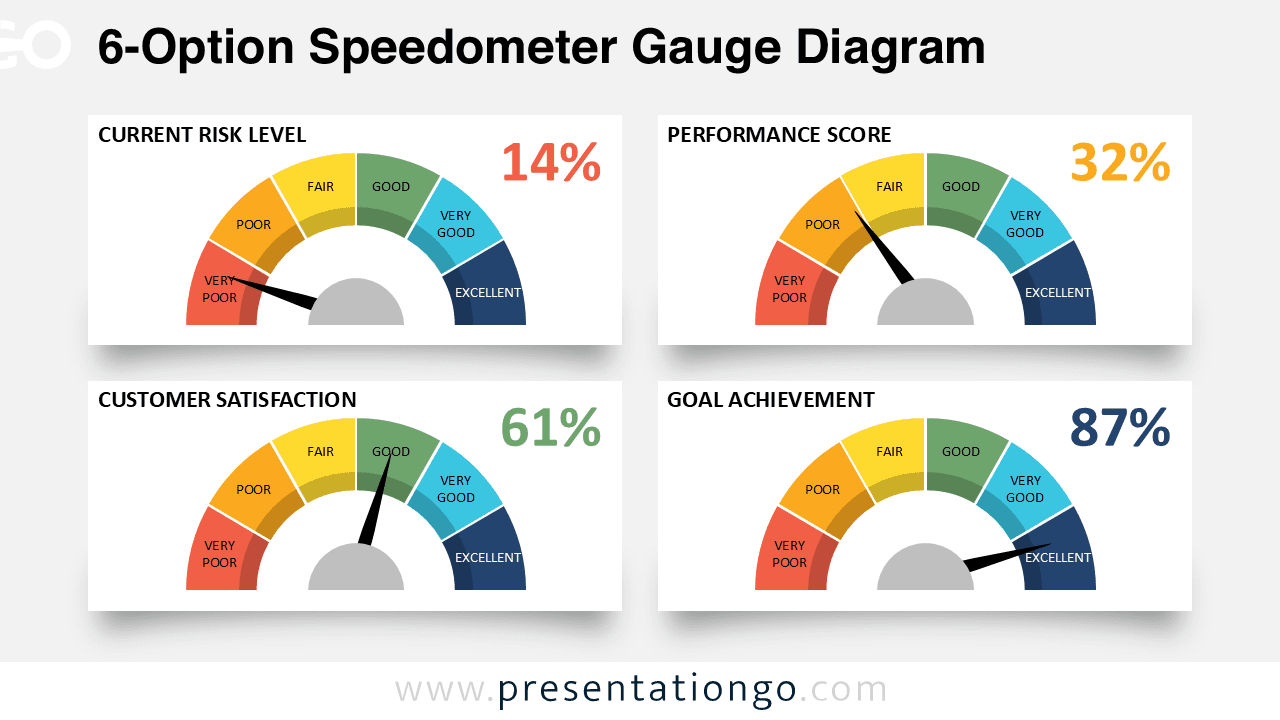
Use the 6-Option Speedometer Gauge Diagram for PowerPoint and Google Slides to track KPIs, goals, and performance across six levels.
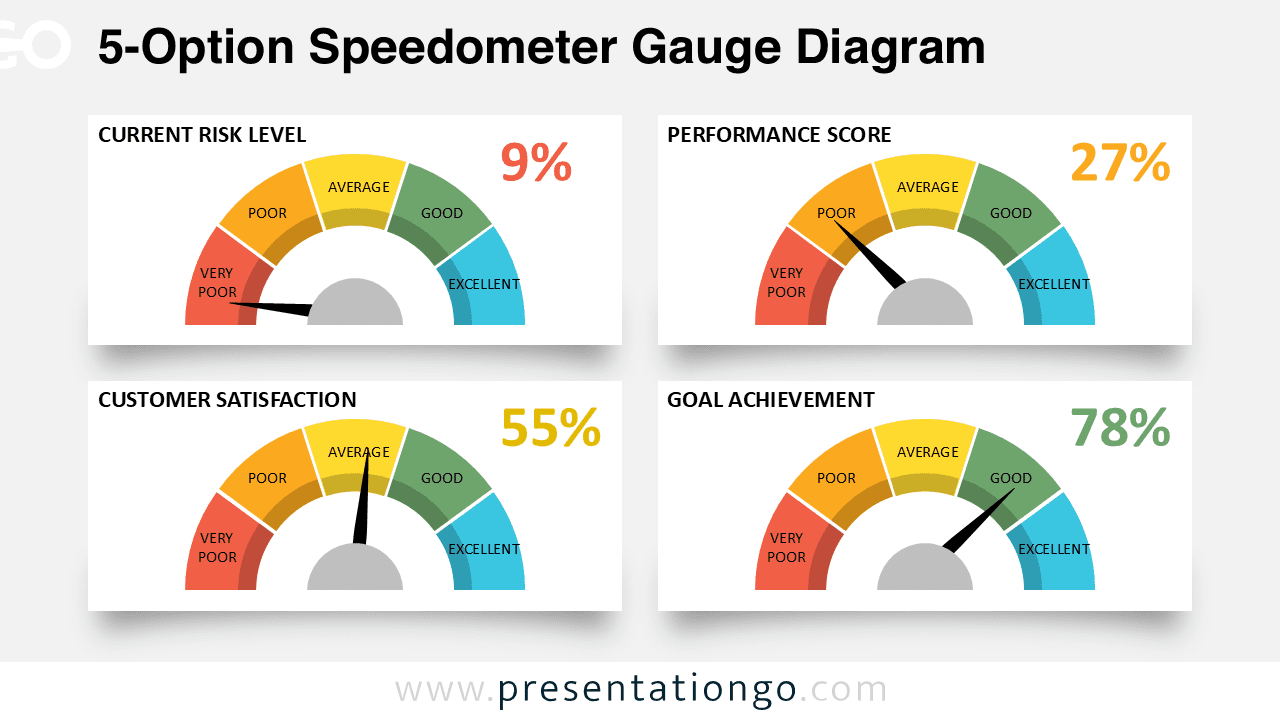
Free 5-Option Speedometer Gauge Diagram for PowerPoint and Google Slides. Compare KPIs with this clear and customizable five-level template.
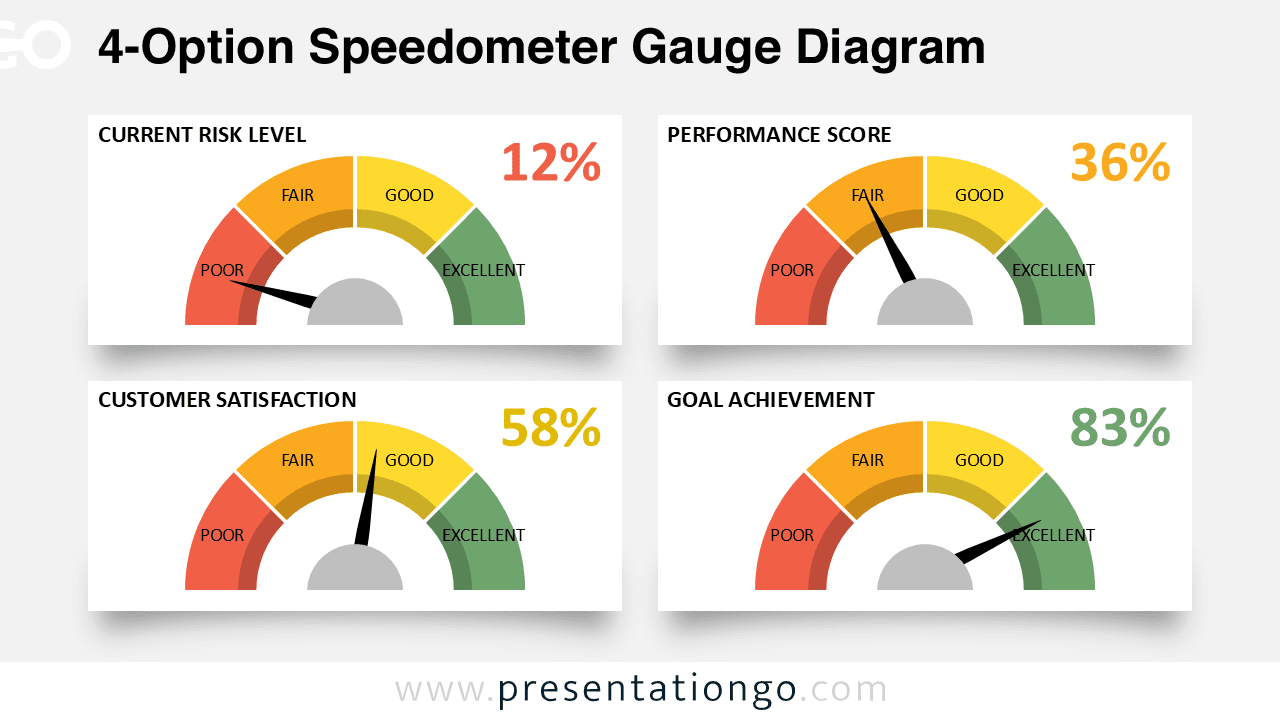
Download the 4-Option Speedometer Gauge Diagram for PowerPoint and Google Slides. Compare multiple performance metrics in one dashboard.
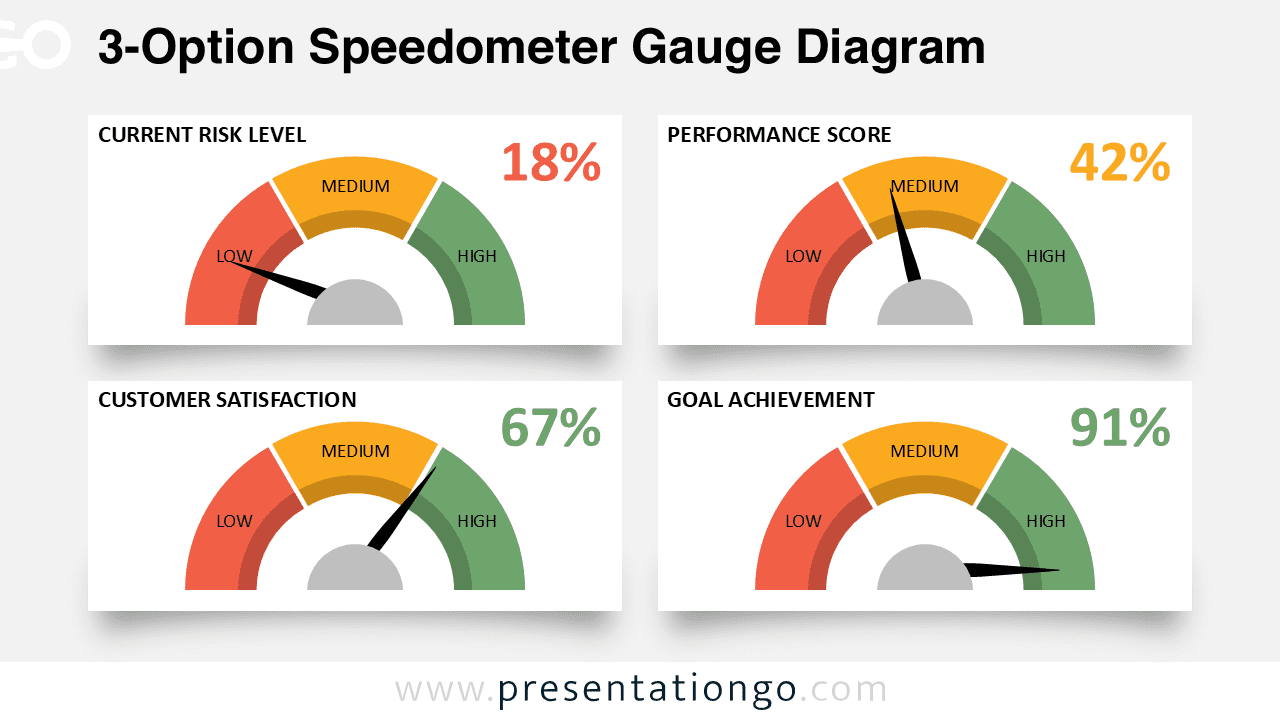
Download the 3-Option Speedometer Gauge Diagram PowerPoint & Google Slides template for quick KPI tracking and performance comparison.
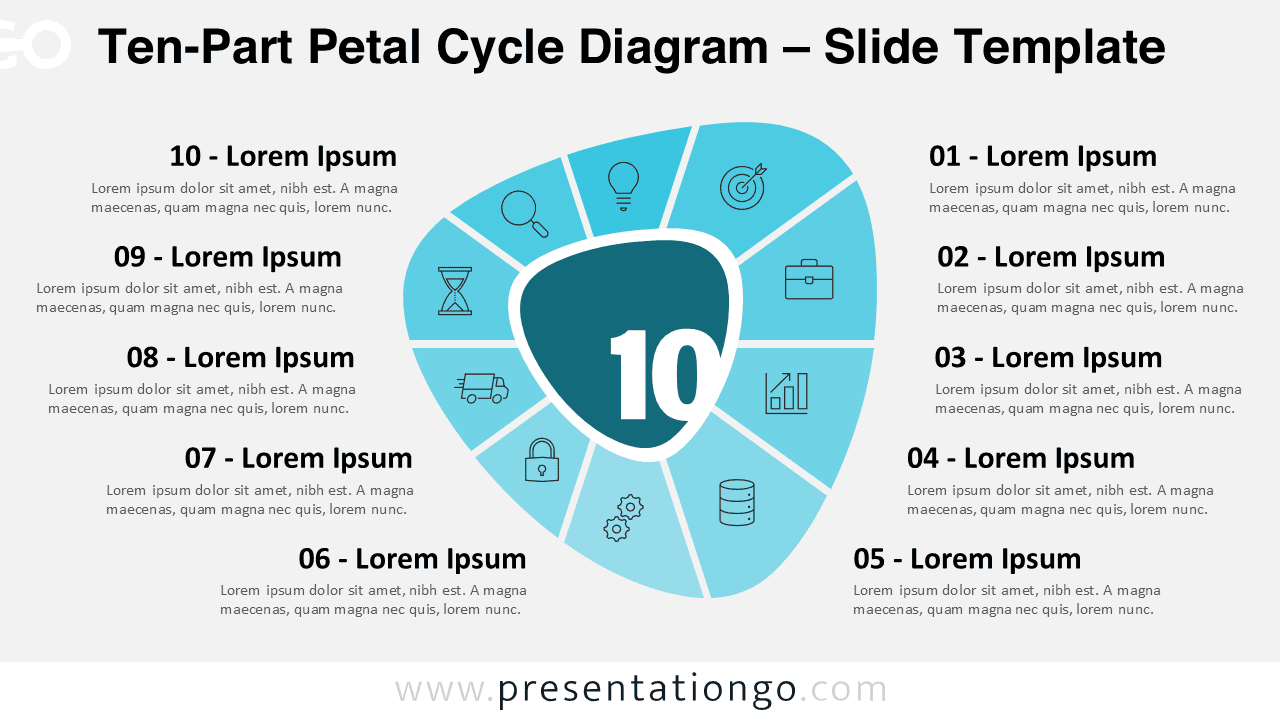
Download the Ten-Part Petal Cycle Diagram for PowerPoint and Google Slides. Show ten steps, phases, or principles in one circular flow.
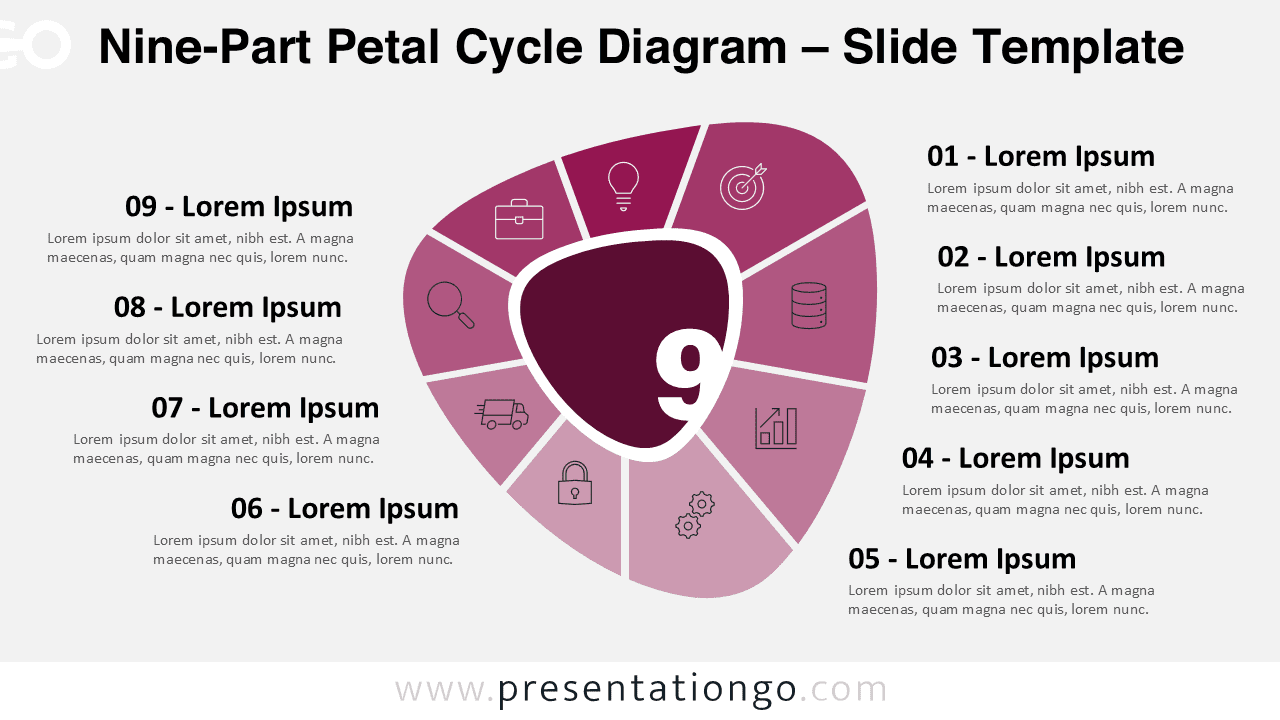
Free Nine-Part Petal Cycle Diagram for PowerPoint and Google Slides. Present nine related steps, features, or phases in a circular diagram.
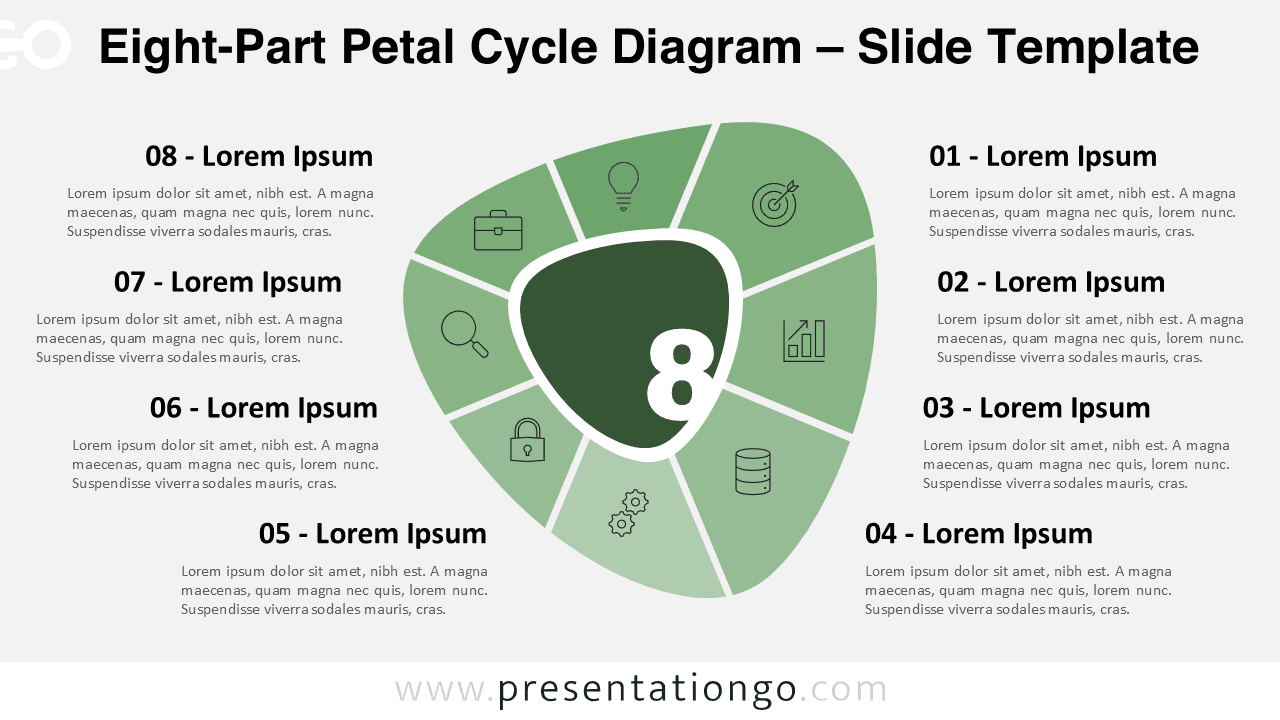
Download the Eight-Part Petal Cycle Diagram PowerPoint and Google Slides template featuring eight petals, icons, and editable shapes.
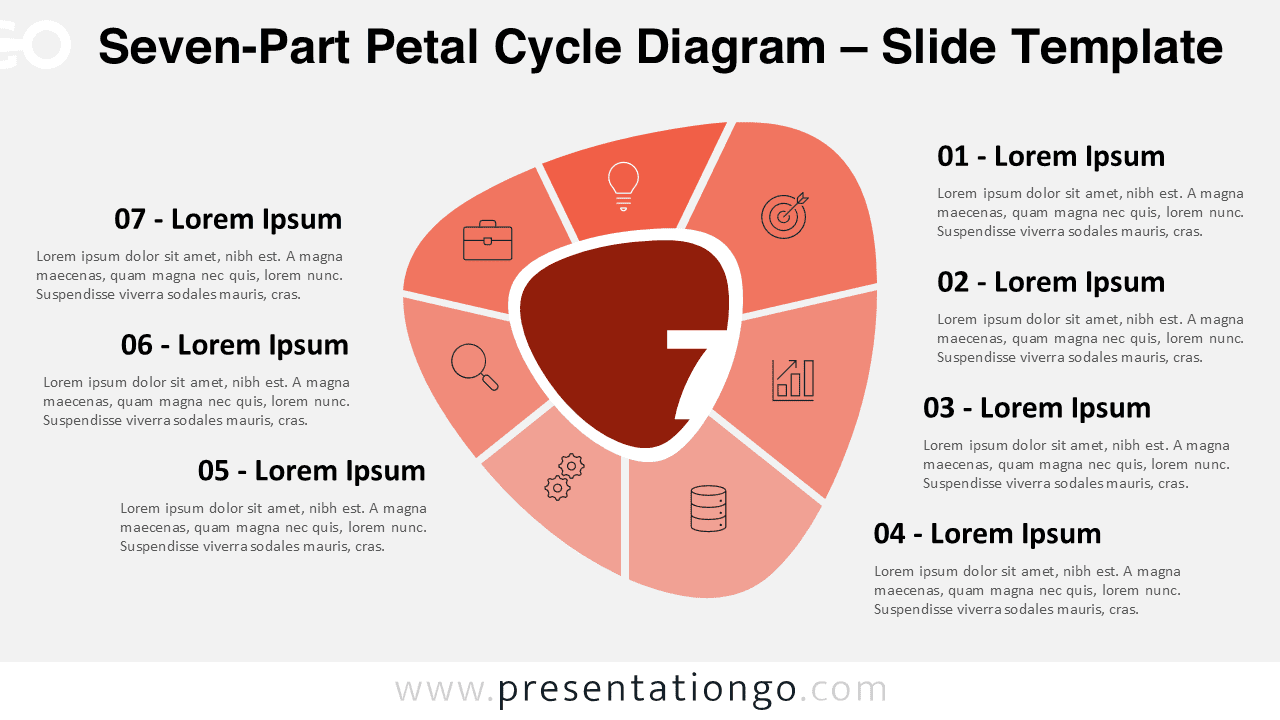
Create engaging visuals with the Seven-Part Petal Cycle Diagram PowerPoint & Google Slides template, including seven editable connected petals.
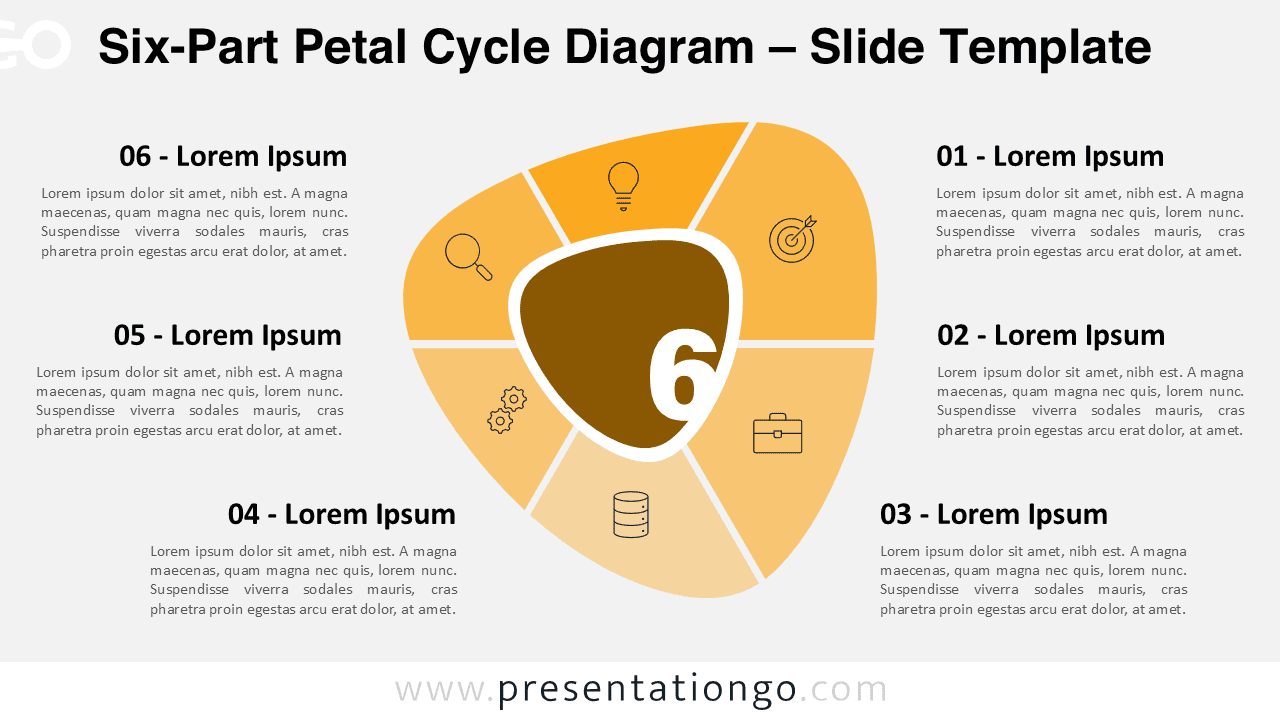
Download the Six-Part Petal Cycle Diagram for PowerPoint and Google Slides. Show six stages or concepts in a circular, petal design.
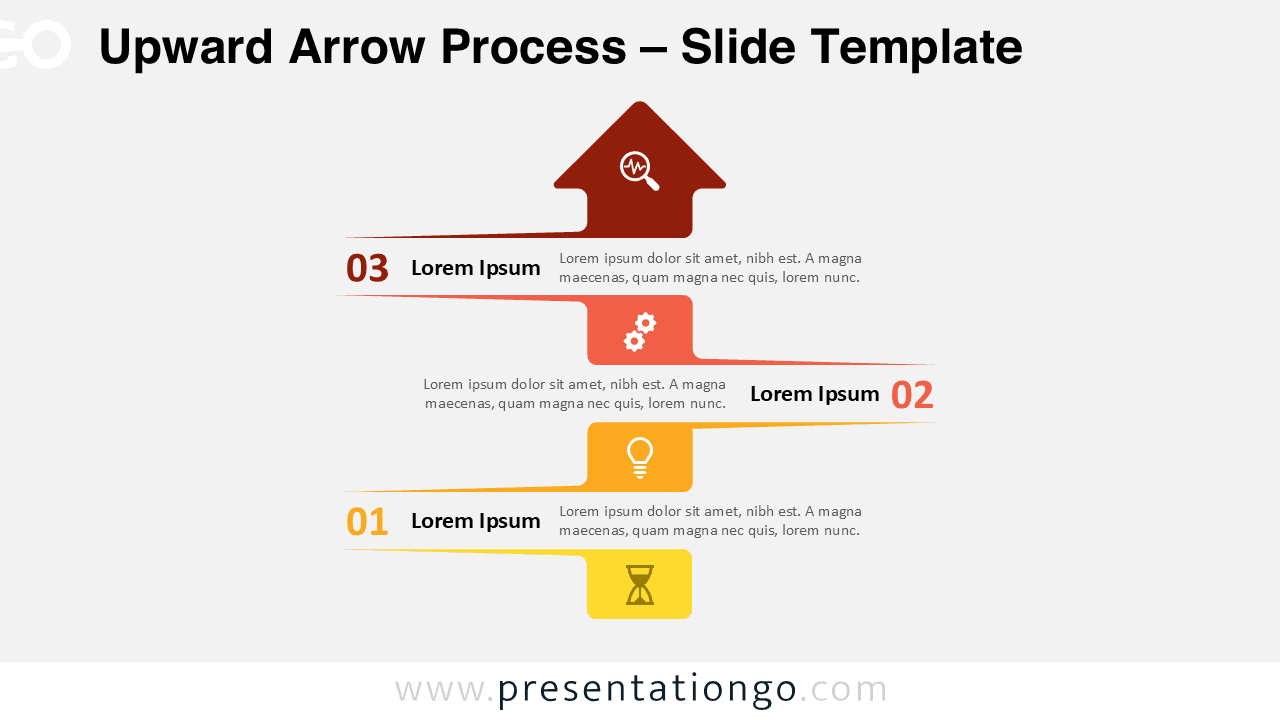
The Upward Arrow Process template for PowerPoint and Google Slides includes three steps and an arrow to show progression or growth.
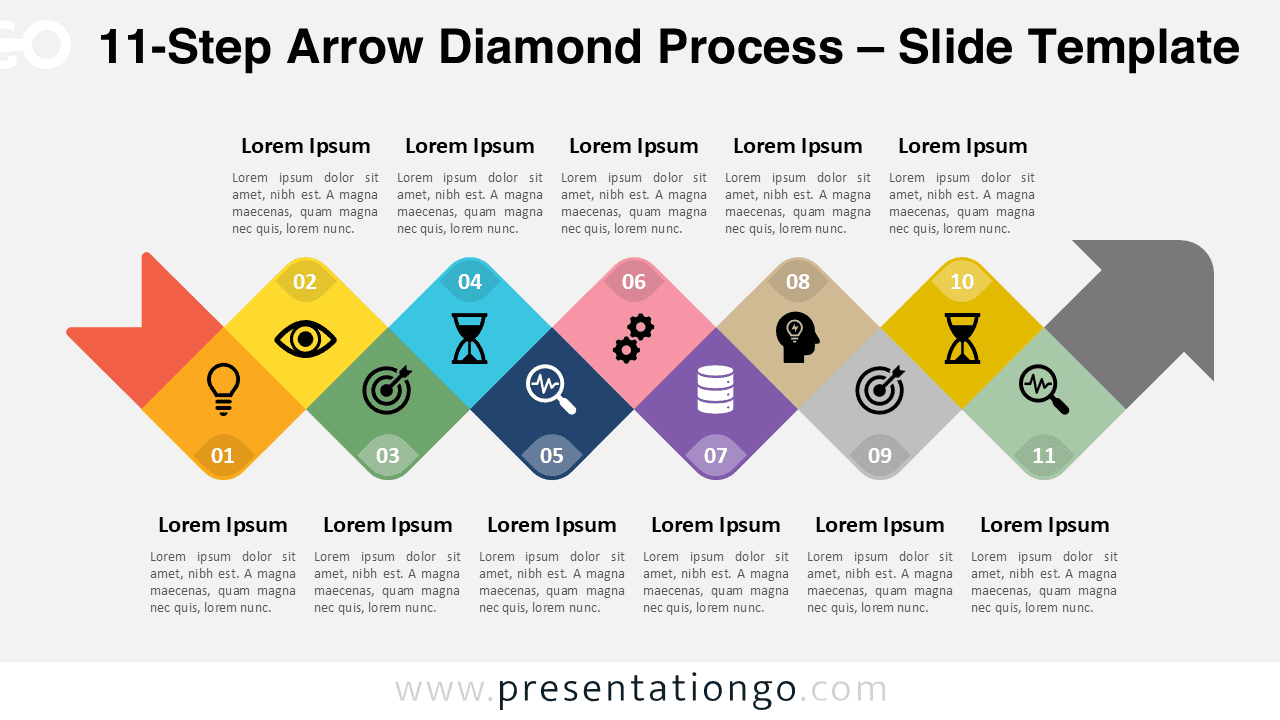
Download the 11-Step Arrow Diamond Process PowerPoint and Google Slides template, ideal for mapping workflows with customizable steps.
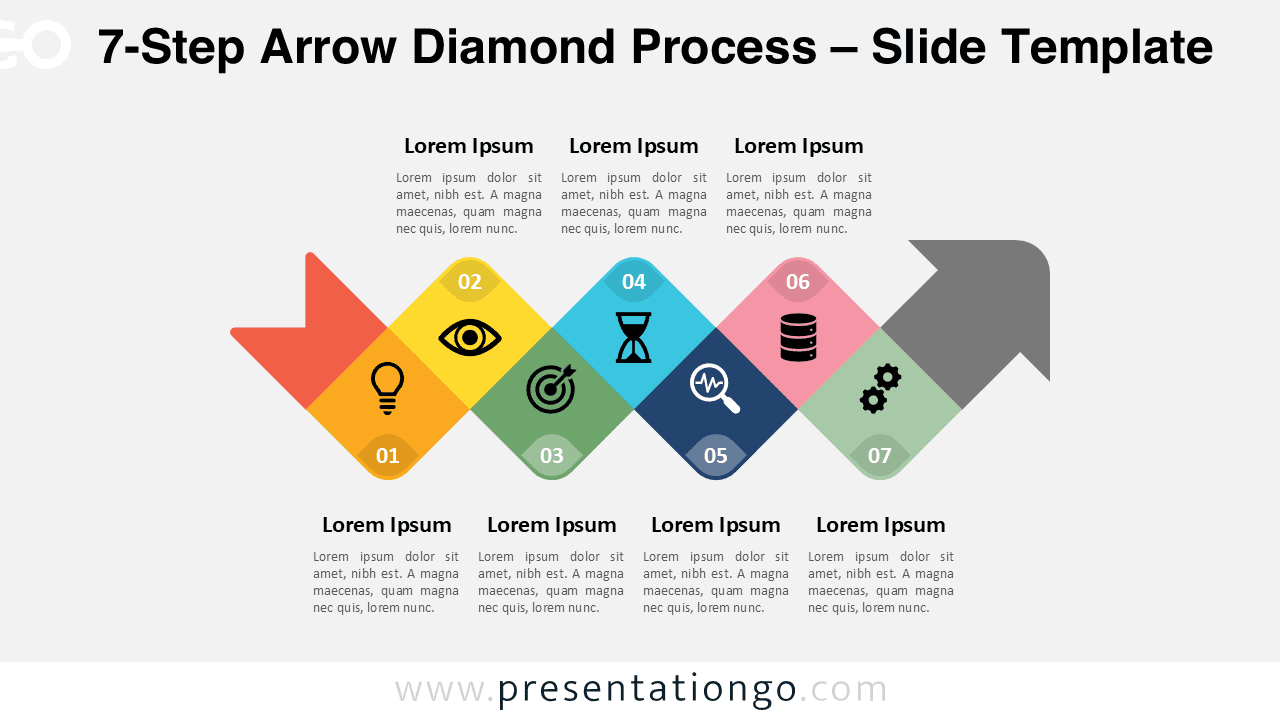
Download the 7-Step Arrow Diamond Process PowerPoint and Google Slides template with seven stages, editable colors, and serpentine layout.
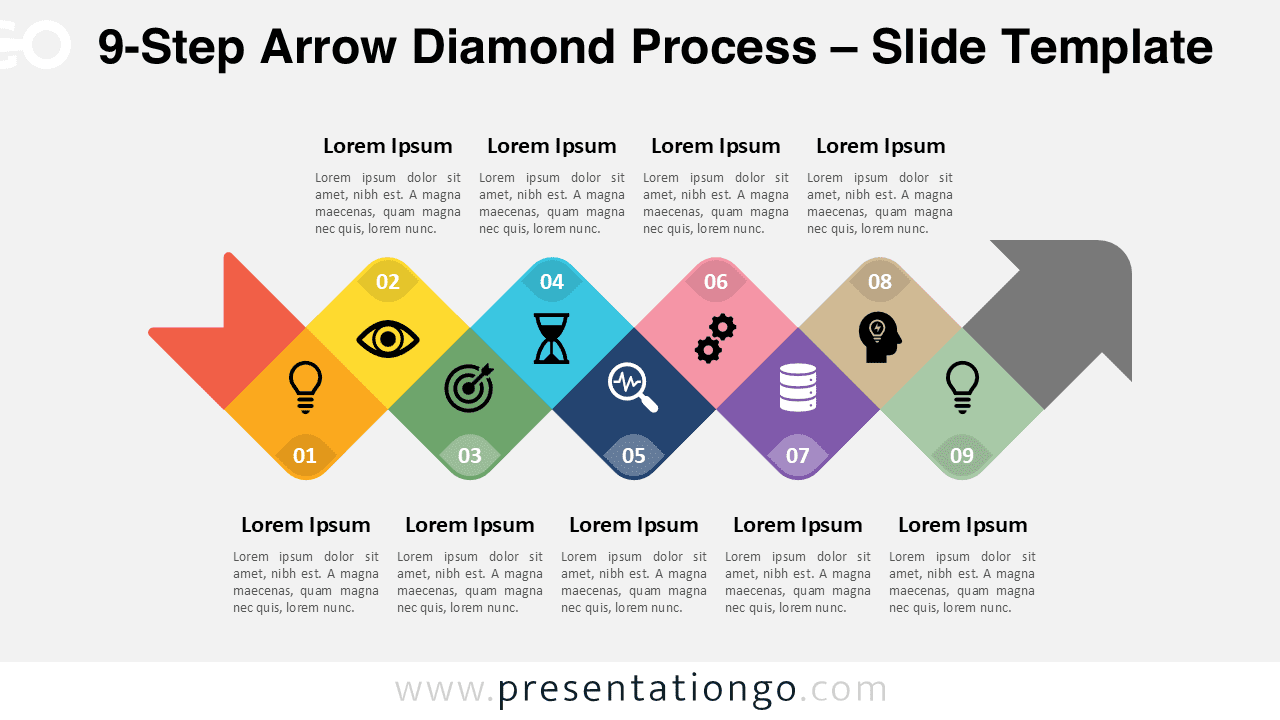
The 9-Step Arrow Diamond Process PowerPoint and Google Slides template highlights complex sequences with a serpentine diamond flow.
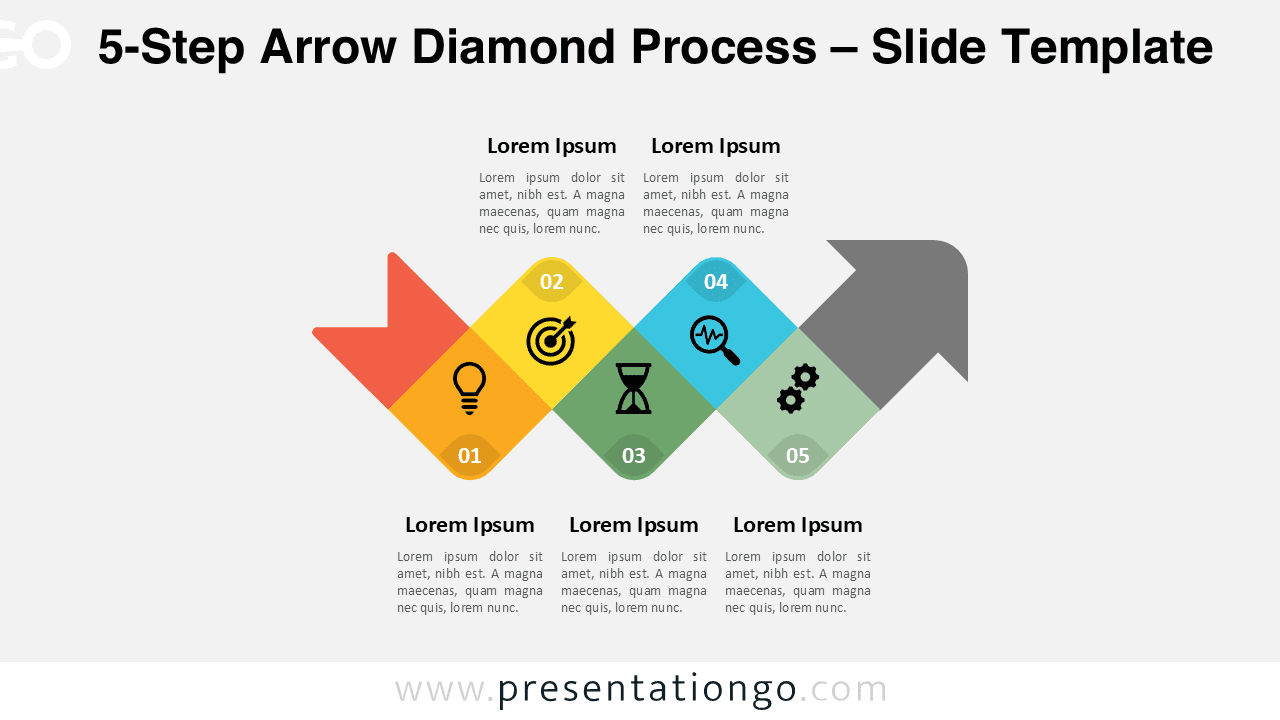
The 5-Step Arrow Diamond Process template for PowerPoint and Google Slides features a zigzag sequence ideal for short process flows.
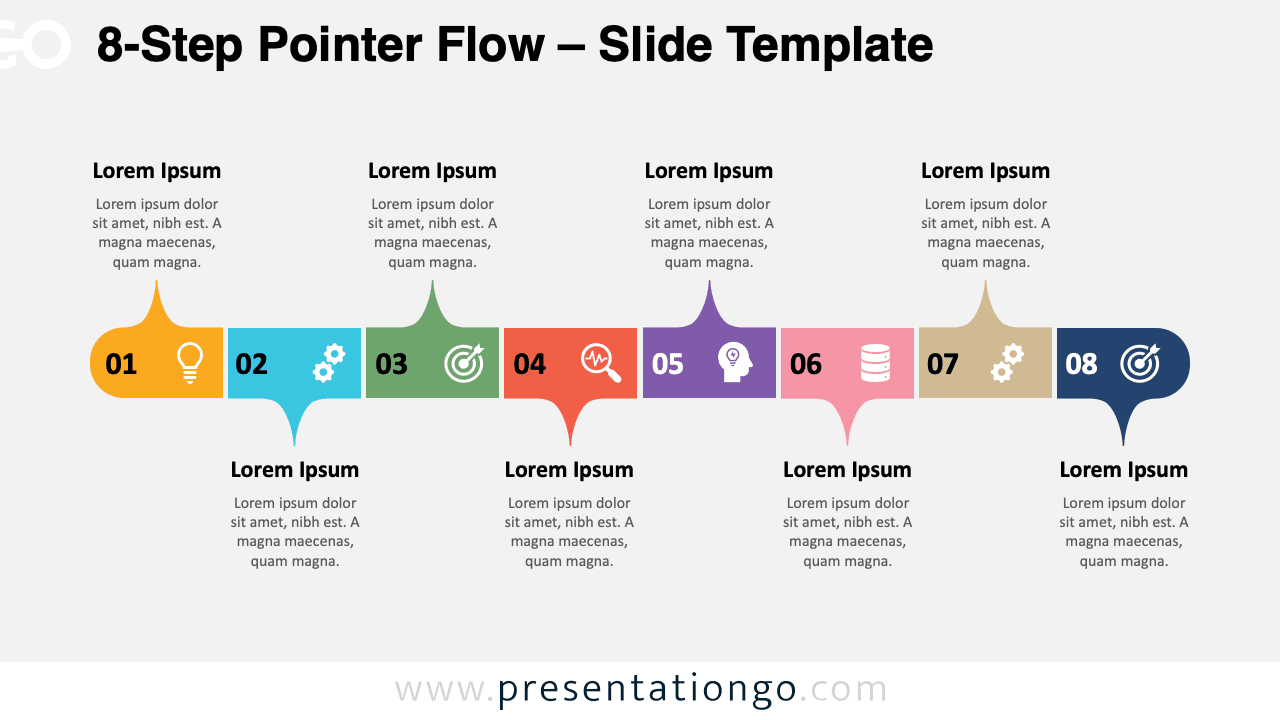
Download the 8-Step Pointer Flow for PowerPoint and Google Slides, a customizable diagram for sequential steps and timeline presentations.
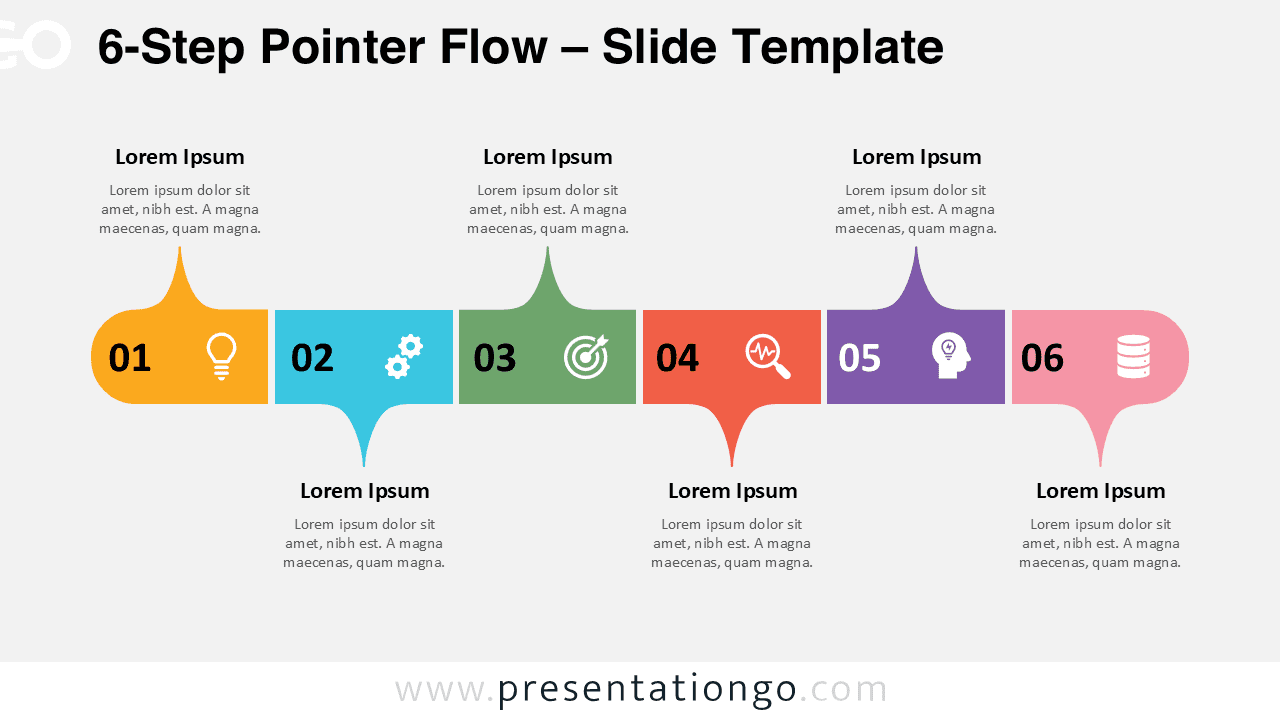
Showcase six clear phases with the 6-Step Pointer Flow PowerPoint and Google Slides template for timelines and workflows.
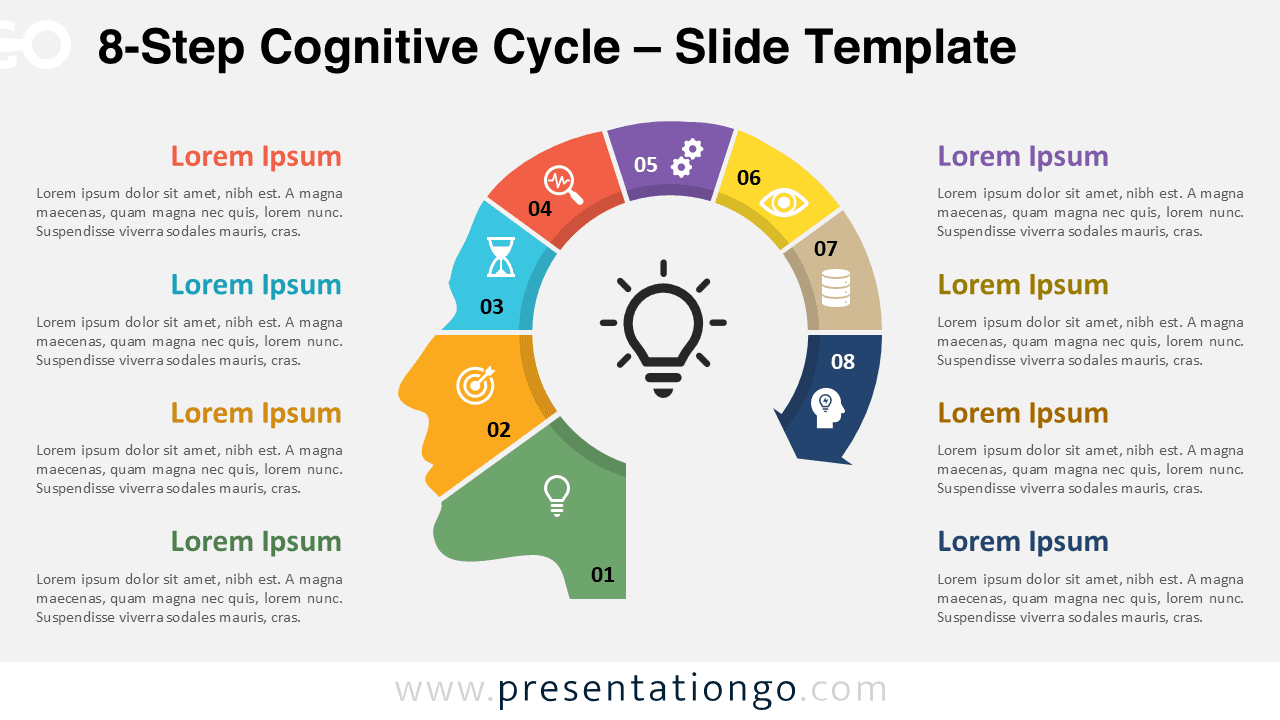
The 8-Step Cognitive Cycle PowerPoint and Google Slides template shows eight circular segments surrounding a lightbulb in a head shape.
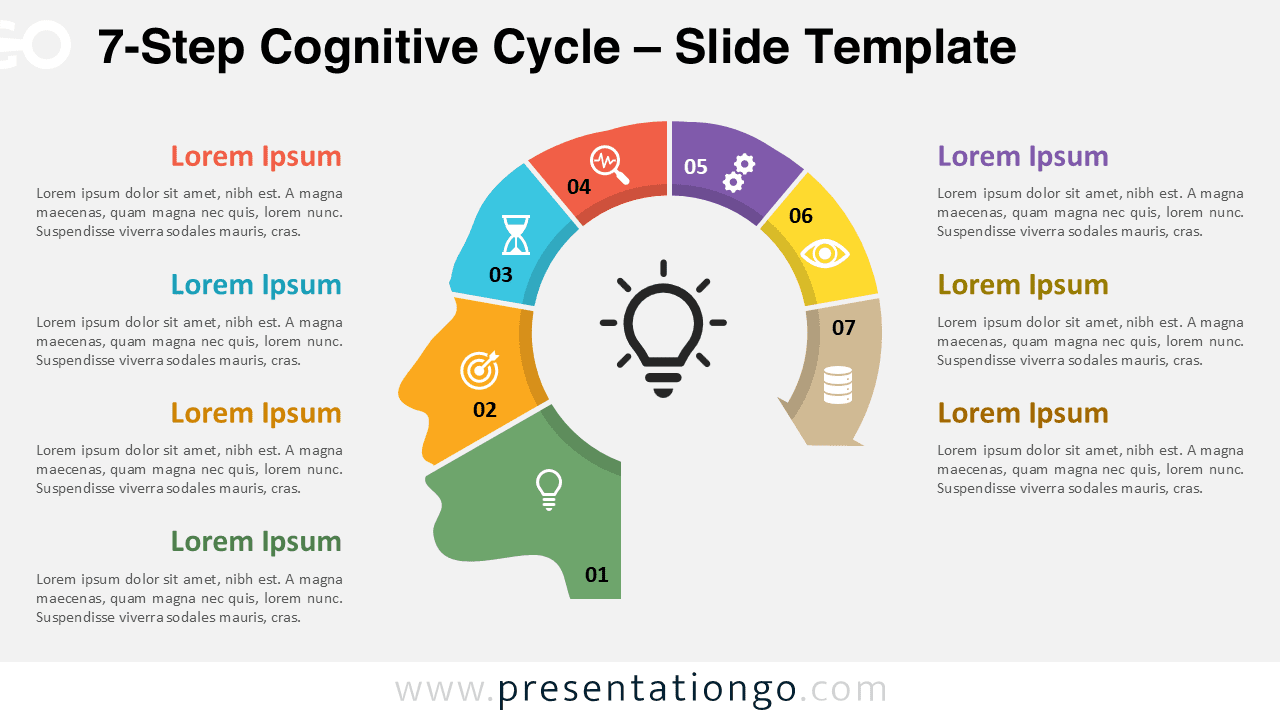
Download the 7-Step Cognitive Cycle for PowerPoint and Google Slides to show seven phases of thought progression in a circular layout.
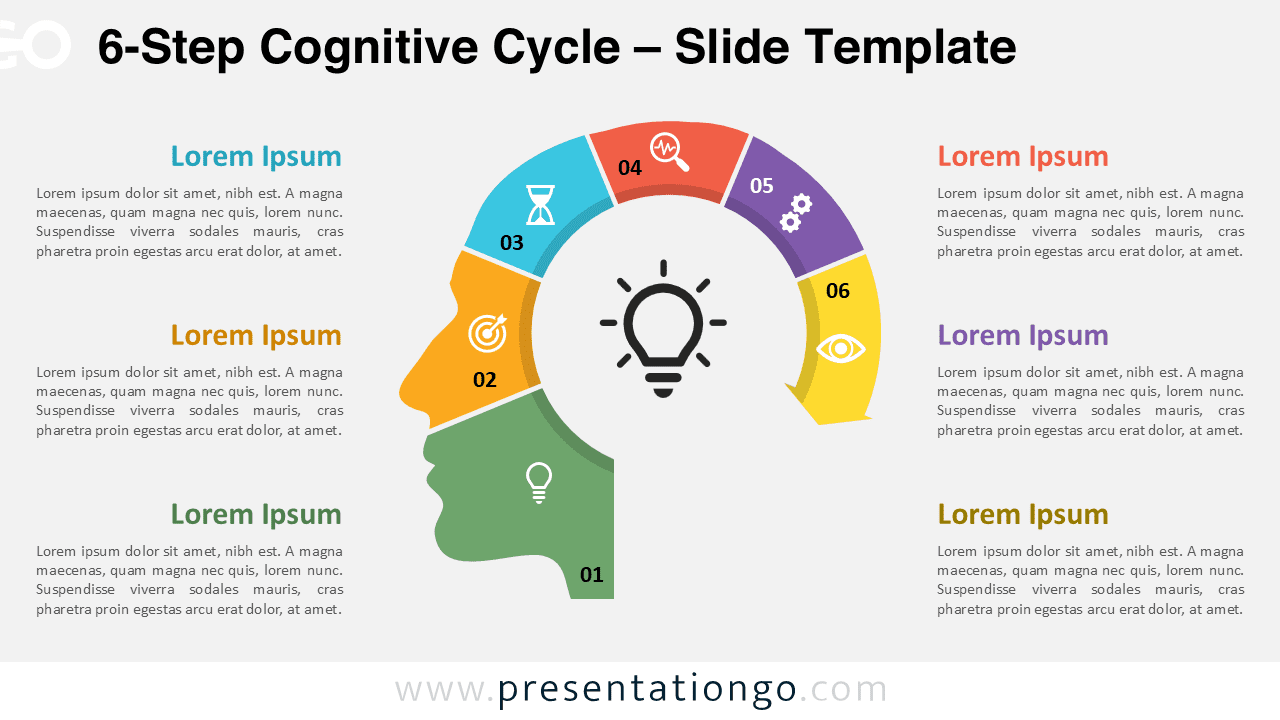
Download the 6-Step Cognitive Cycle for PowerPoint and Google Slides featuring six colorful segments around a head silhouette.
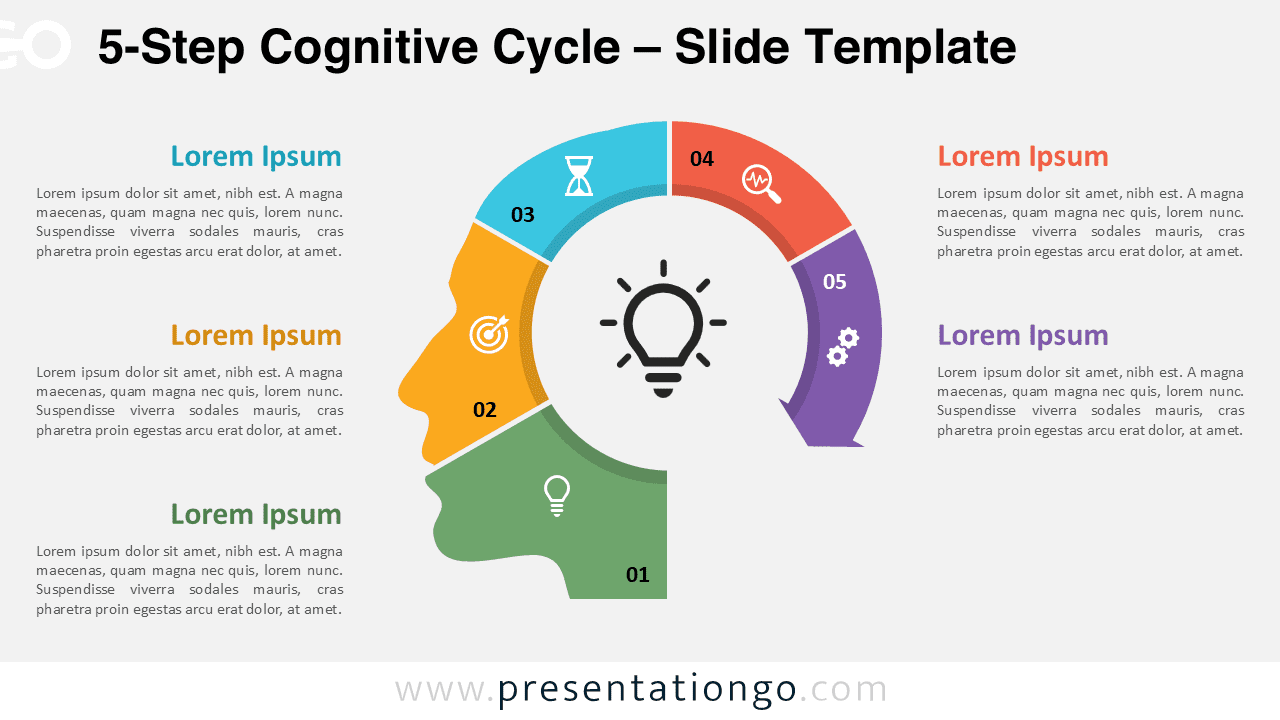
Download the 5-Step Cognitive Cycle for PowerPoint and Google Slides—featuring a head silhouette and five-part arc diagram for workflows.
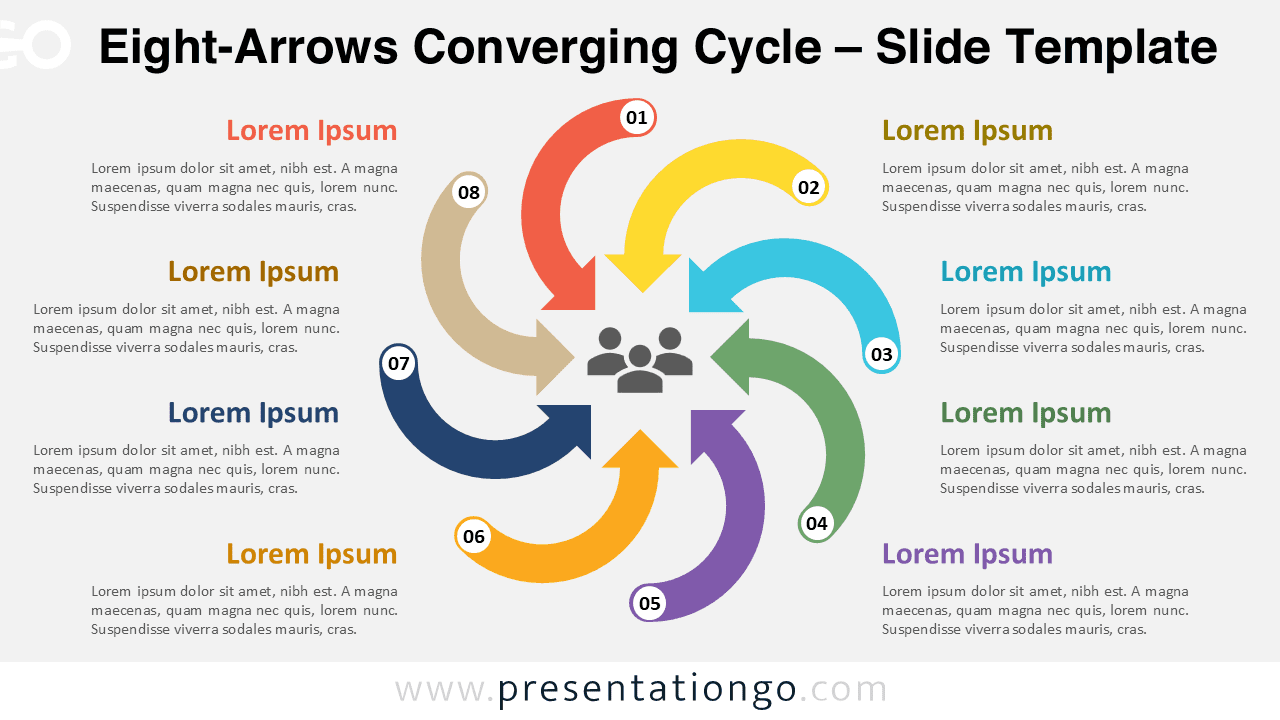
Download the Eight-Arrows Converging Cycle for PowerPoint and Google Slides to present eight ideas that converge into a core objective.