Loading resources…
Total 1760 resources
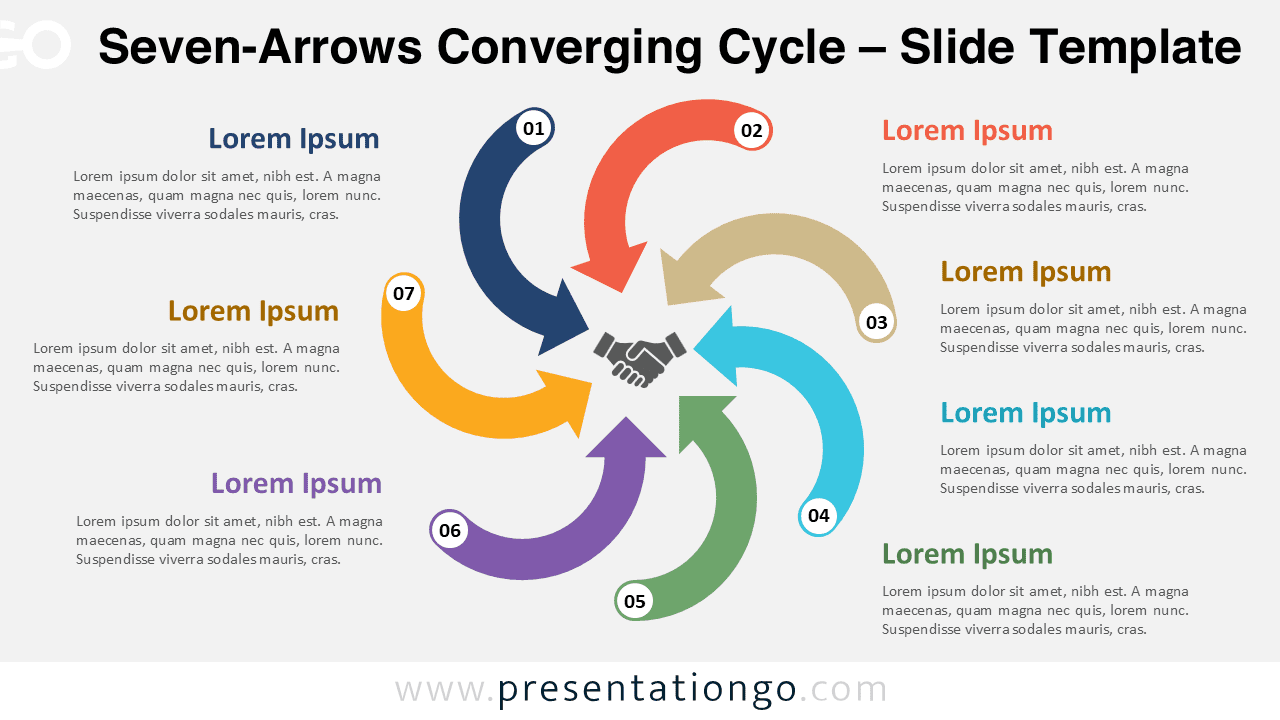
Download the Seven-Arrows Converging Cycle for PowerPoint and Google Slides to present seven ideas that converge into a core objective.
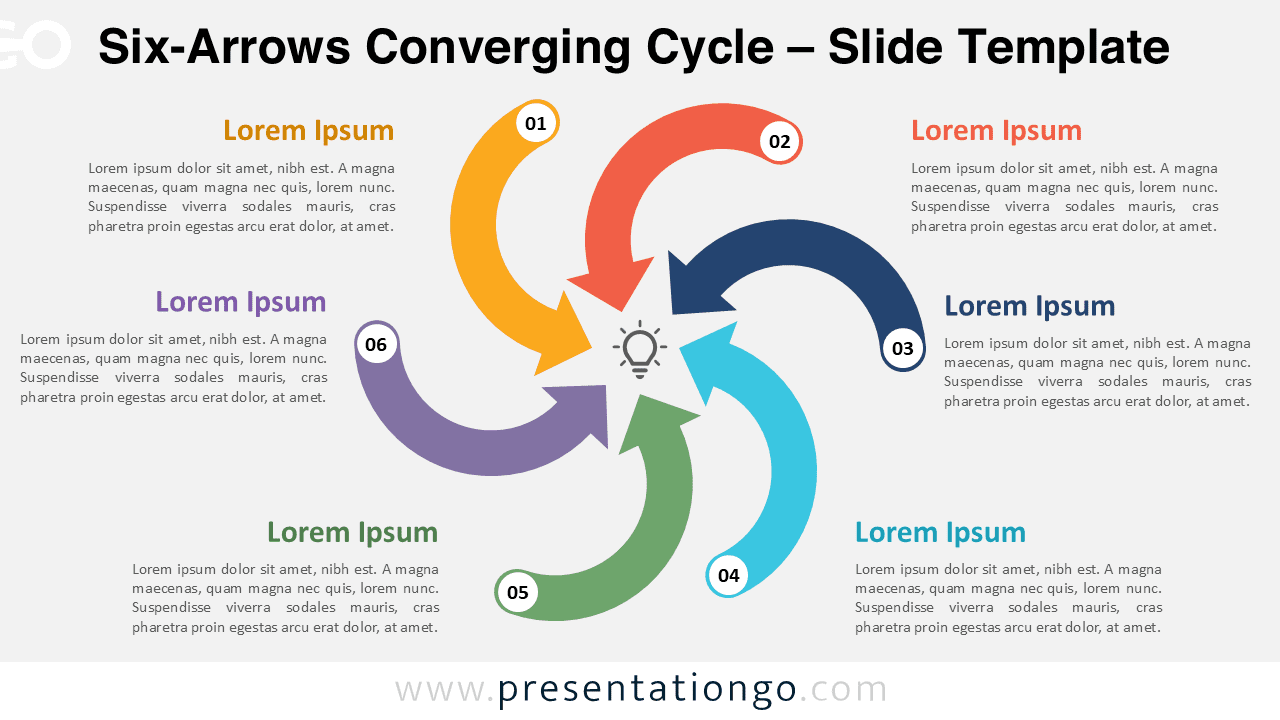
Download the Six-Arrows Converging Cycle for PowerPoint and Google Slides to present six elements that combine toward a unified result.
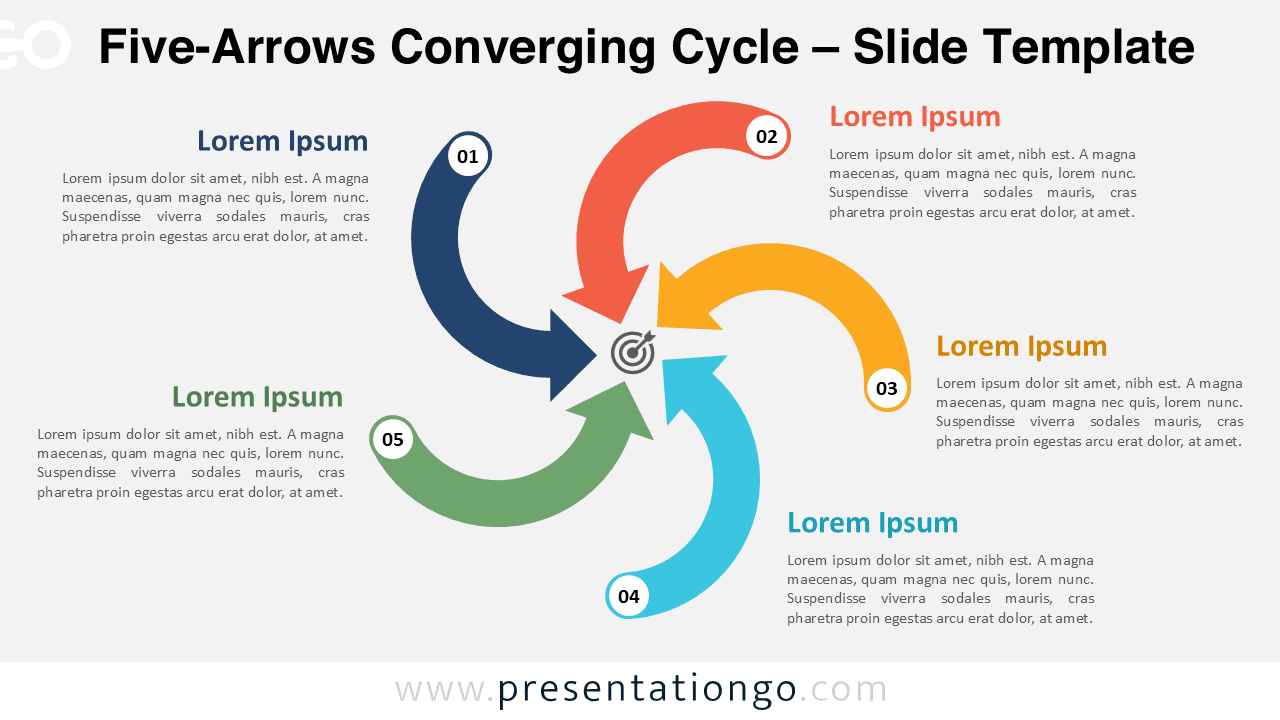
Download the Five-Arrows Converging Cycle for PowerPoint and Google Slides to present five ideas that converge into a core objective.
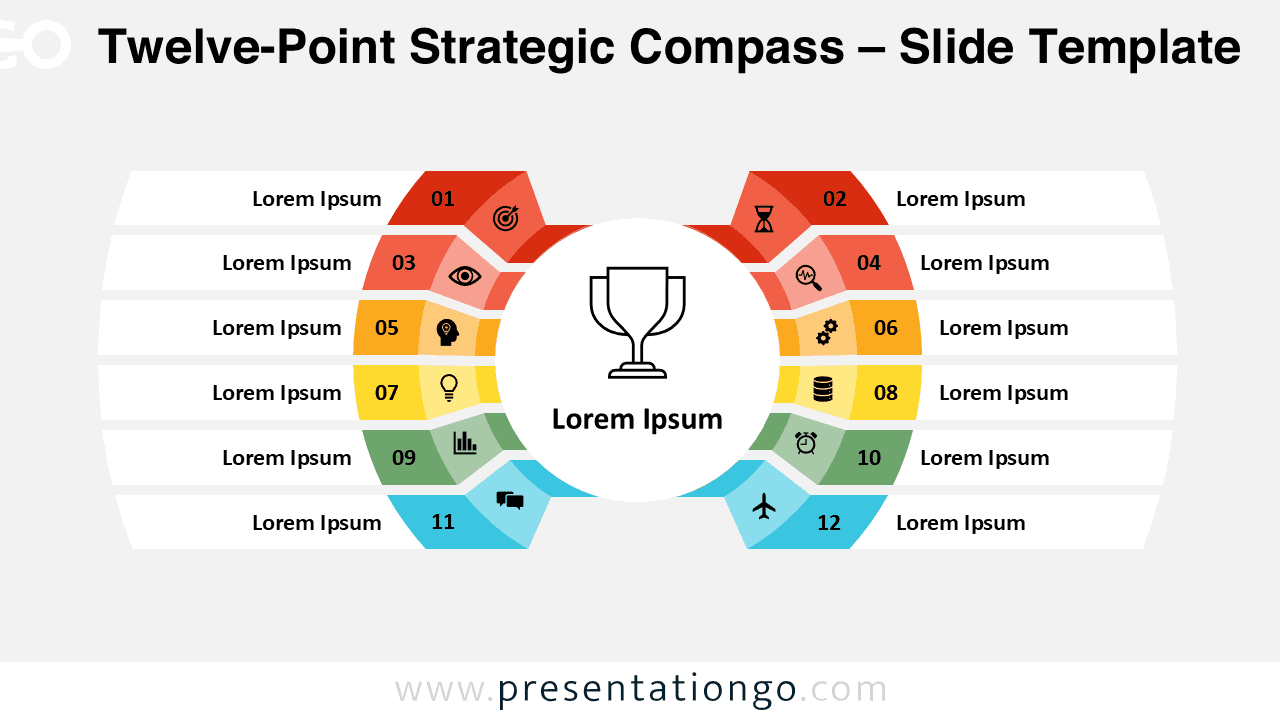
The Twelve-Point Strategic Compass diagram for PowerPoint and Google Slides presents twelve ideas in a radial format with full customization.
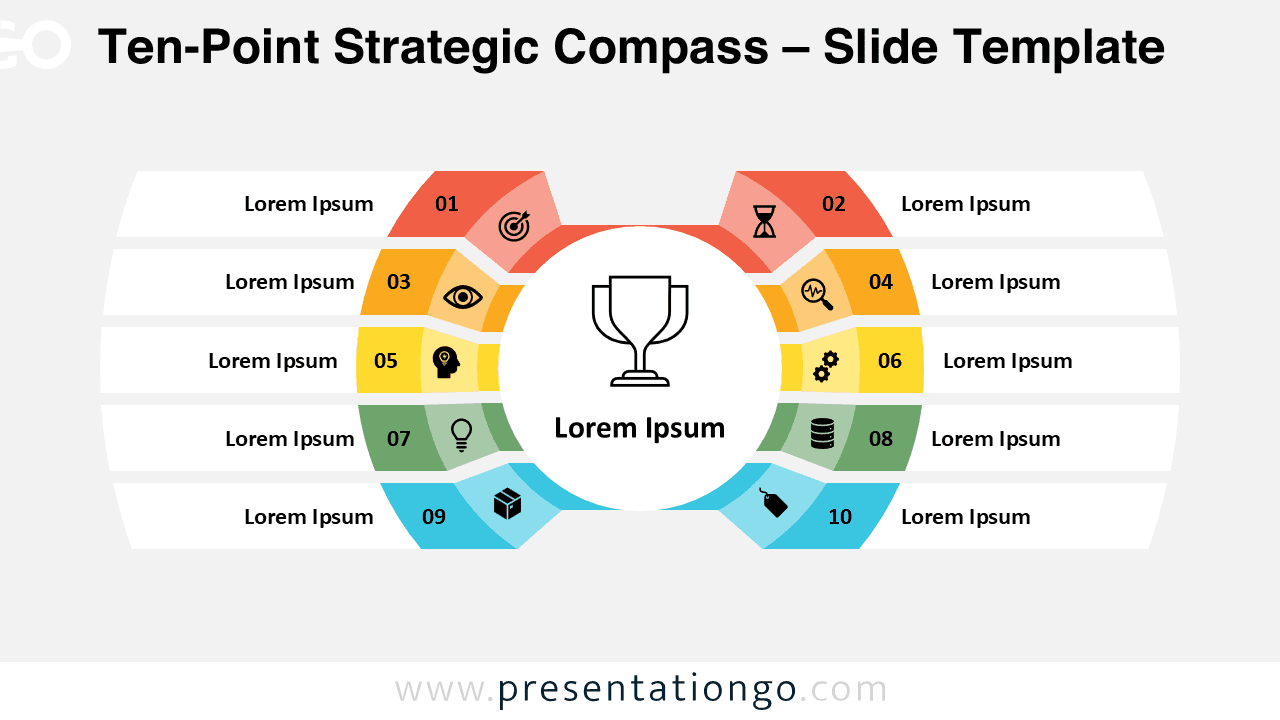
Free Ten-Point Strategic Compass for PowerPoint & Google Slides, designed with a radial flow to highlight ten key steps or principles.
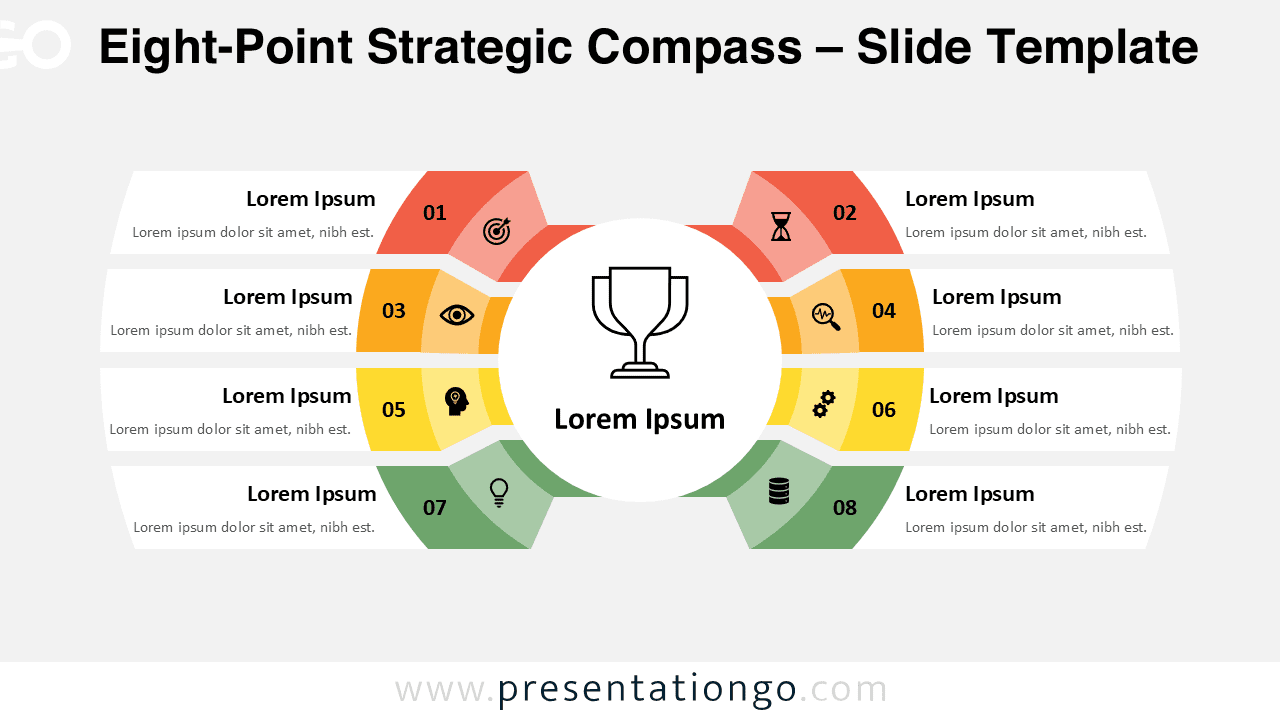
Download the Eight-Point Strategic Compass for PowerPoint and Google Slides to outline 8 strategy steps using a clean radial diagram.
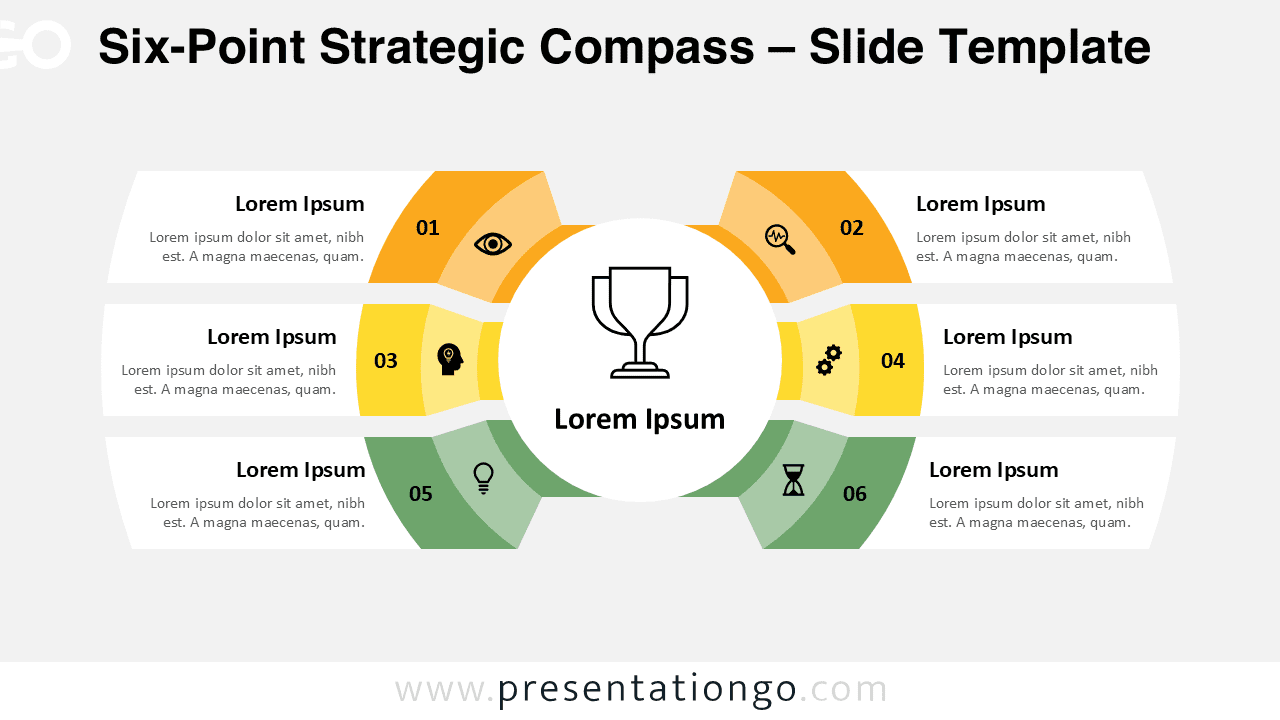
Download this Six-Point Strategic Compass for PowerPoint and Google Slides to highlight six key steps or phases in a visual process chart.
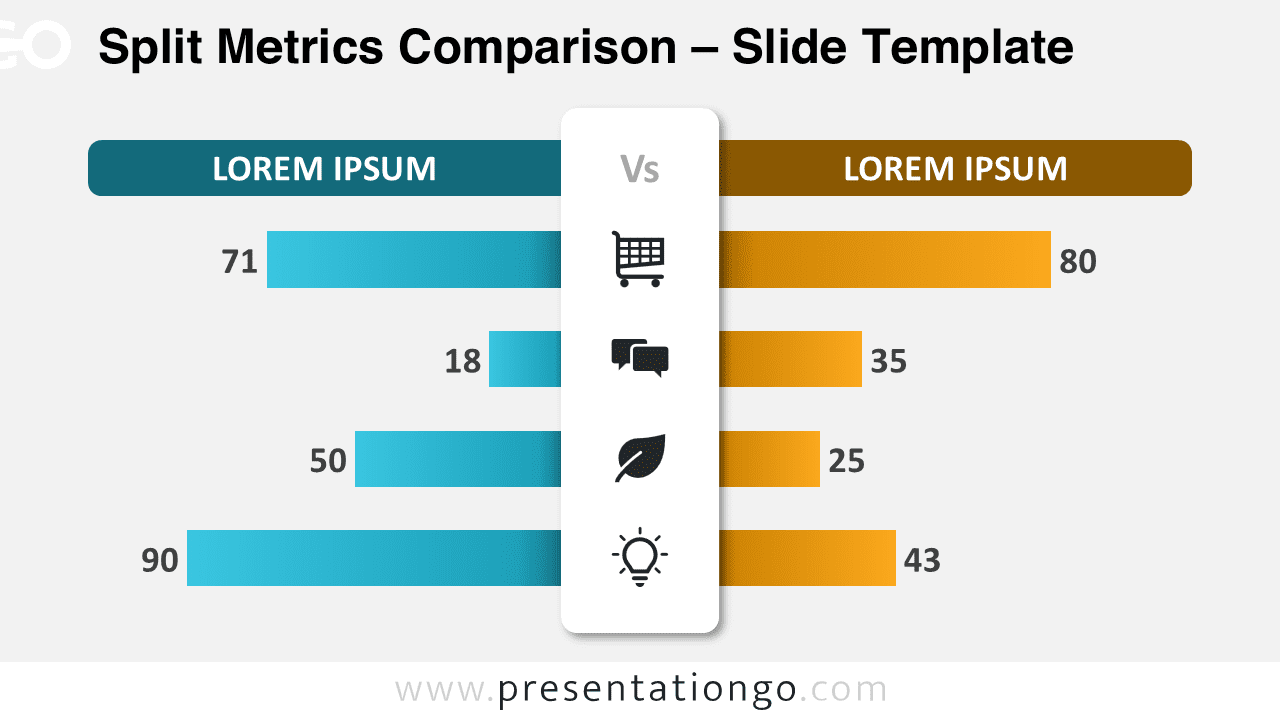
Download this Split Metrics Comparison for PowerPoint and Google Slides to create impactful 4-part KPI comparisons using editable visuals.
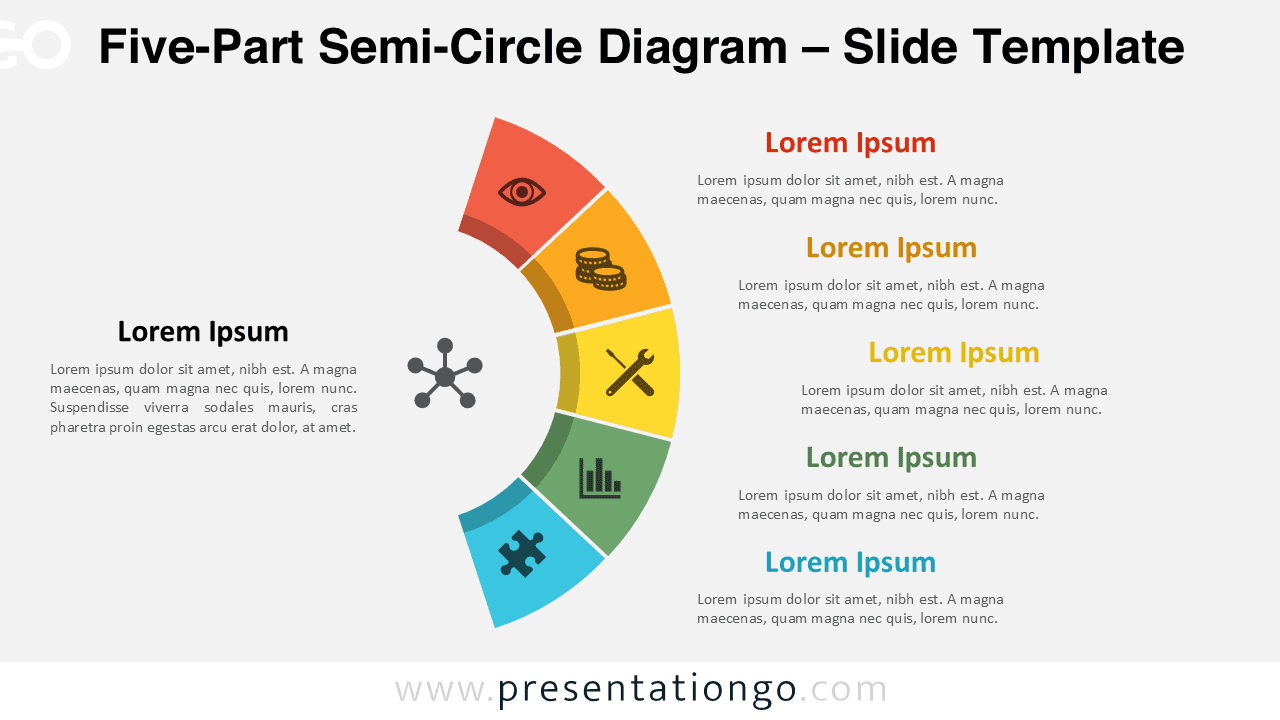
Download the Five-Part Semi-Circle Diagram for PowerPoint and Google Slides. Use this free template to present five clear, sequential stages.
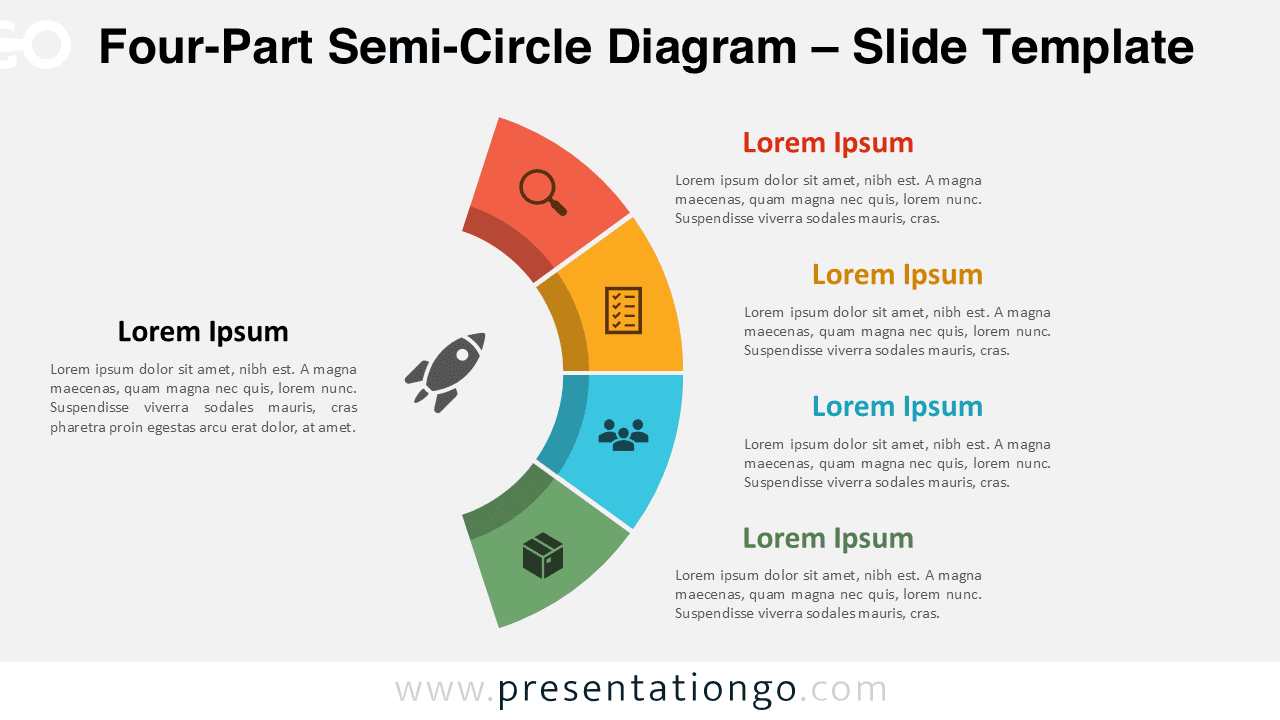
Download the Four-Part Semi-Circle Diagram for PowerPoint and Google Slides to represent four ideas in a balanced, curved layout.
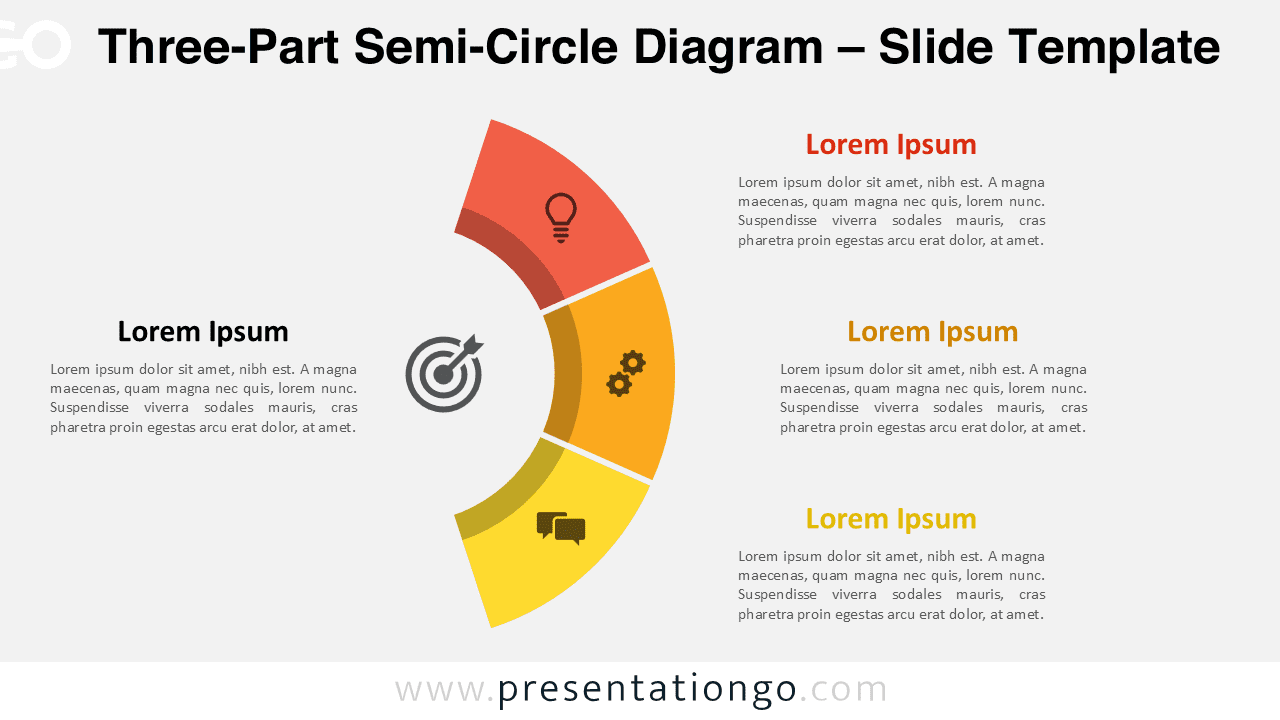
Download this free Three-Part Semi-Circle Diagram for PowerPoint and Google Slides—perfect for showing a process with three stages.
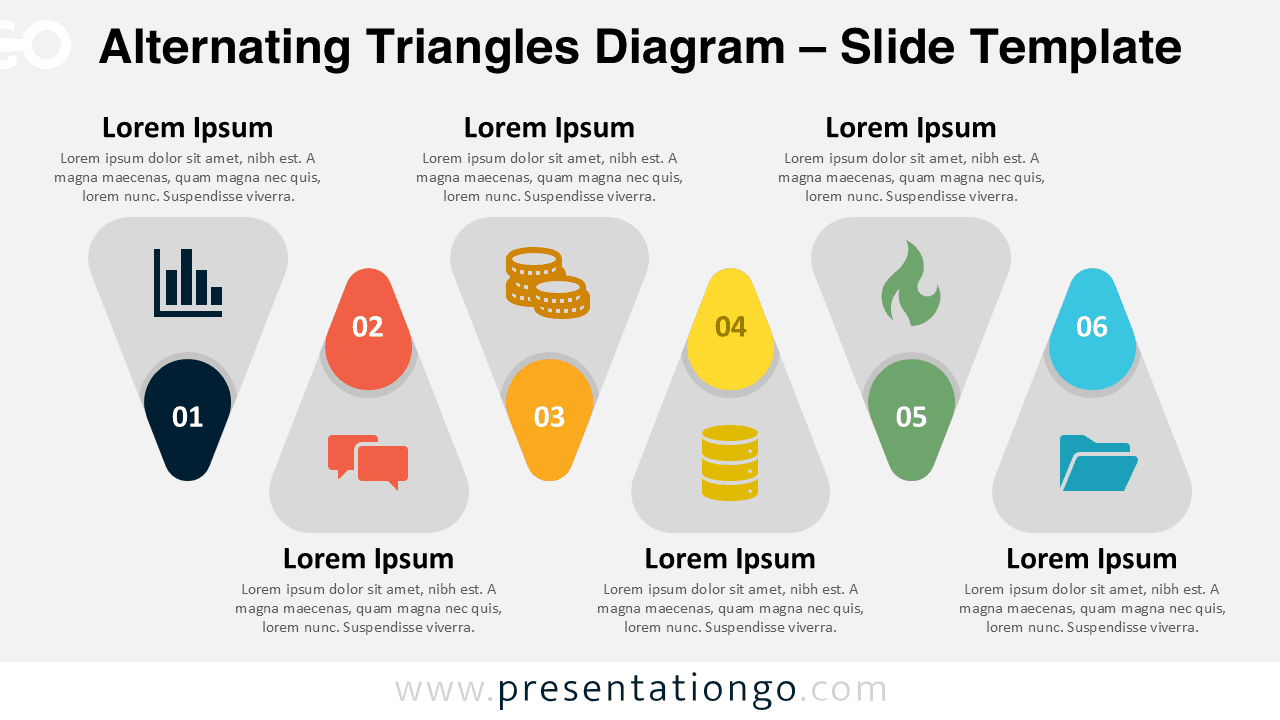
Download Alternating Triangles Diagram for PowerPoint & Google Slides. Six-step horizontal process with unique alternating design.
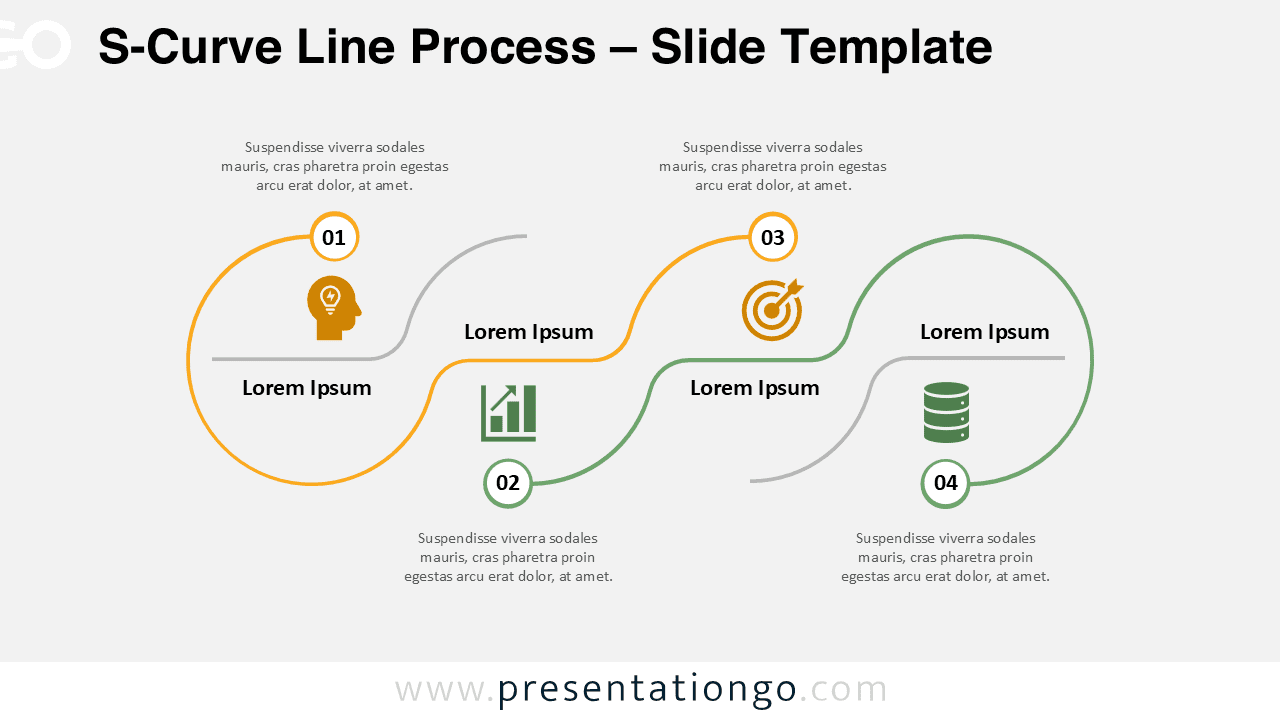
The S-Curve Line Process template for Google Slides and PowerPoint lets you map workflows in 4 steps using curved, icon-filled loops.
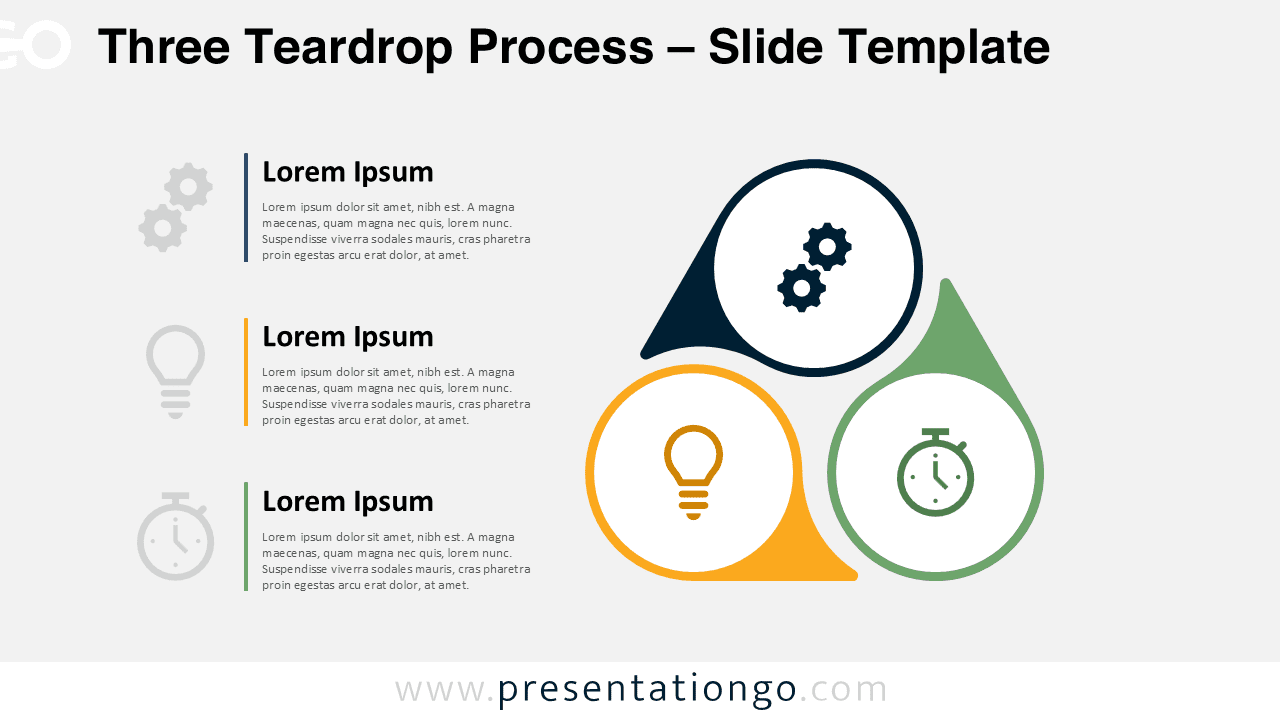
Download this Three Teardrop Process for PowerPoint and Google Slides and present 3 interdependent phases using a clear triangular layout.
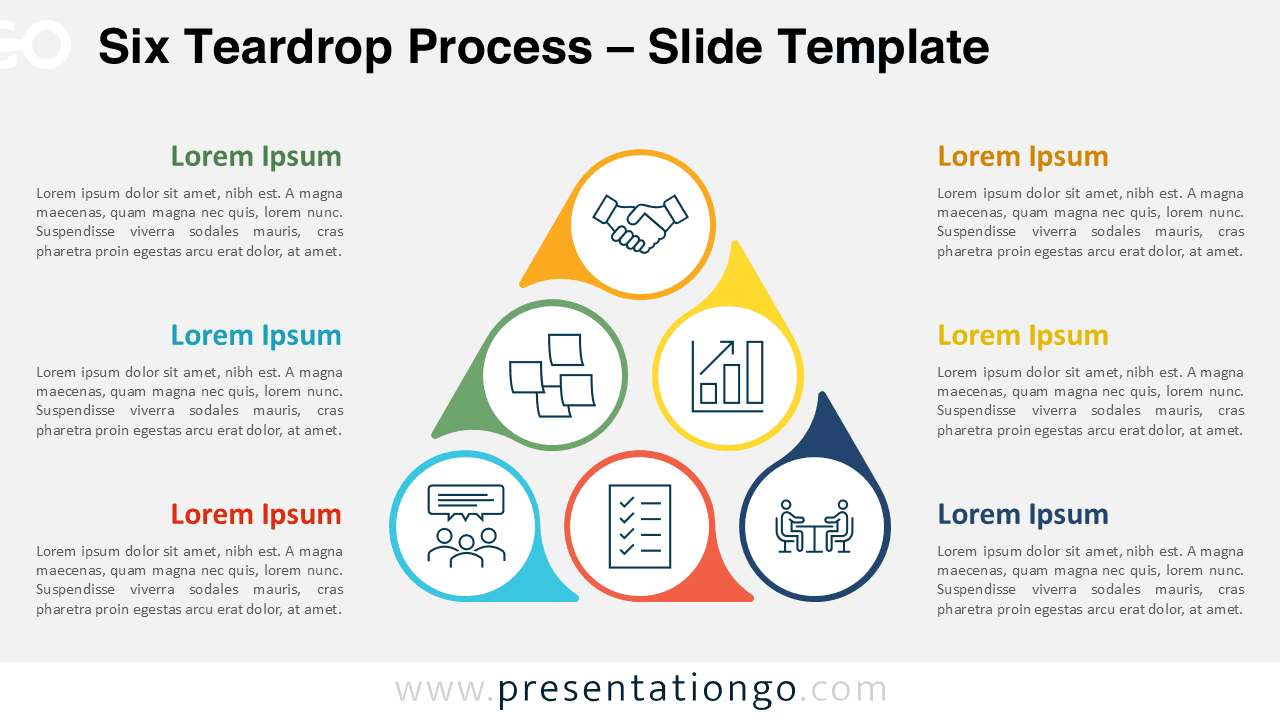
The Six Teardrop Process template for PowerPoint and Google Slides displays six steps in a symmetrical, easy-to-follow visual triangle.
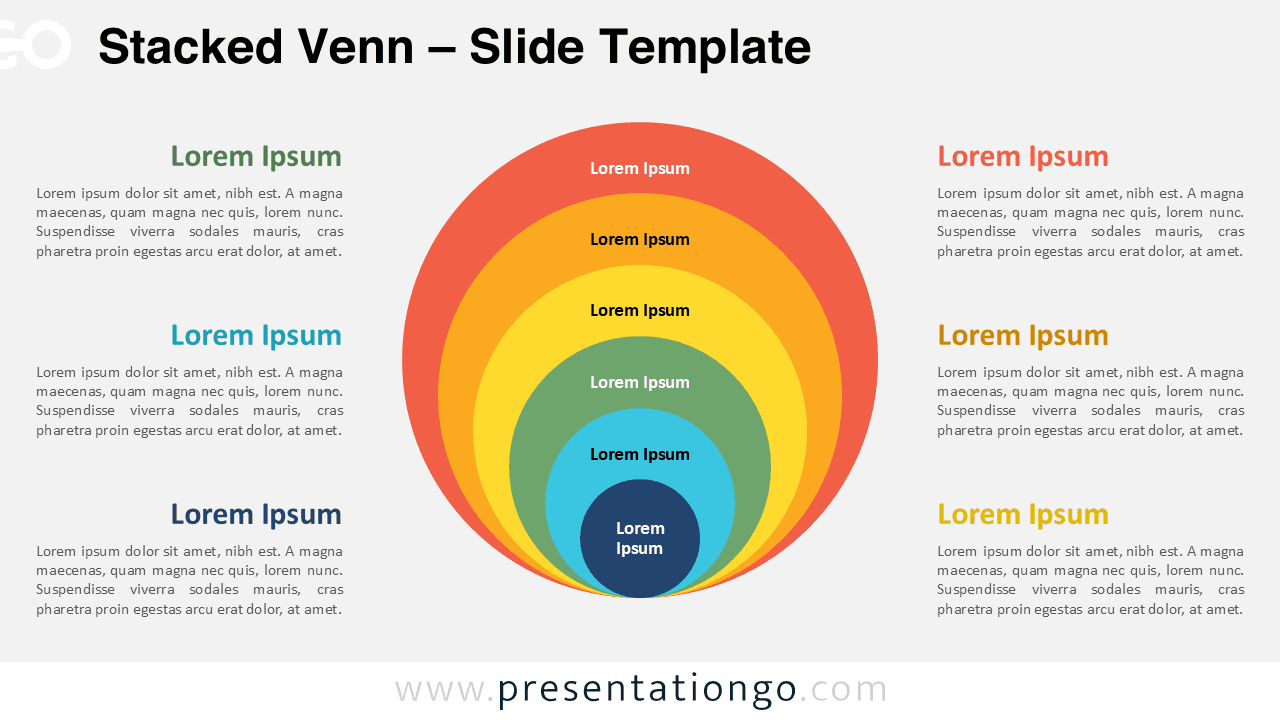
Download this 6-layer Stacked Venn for PowerPoint and Google Slides, fully editable with SmartArt and shape customization options.
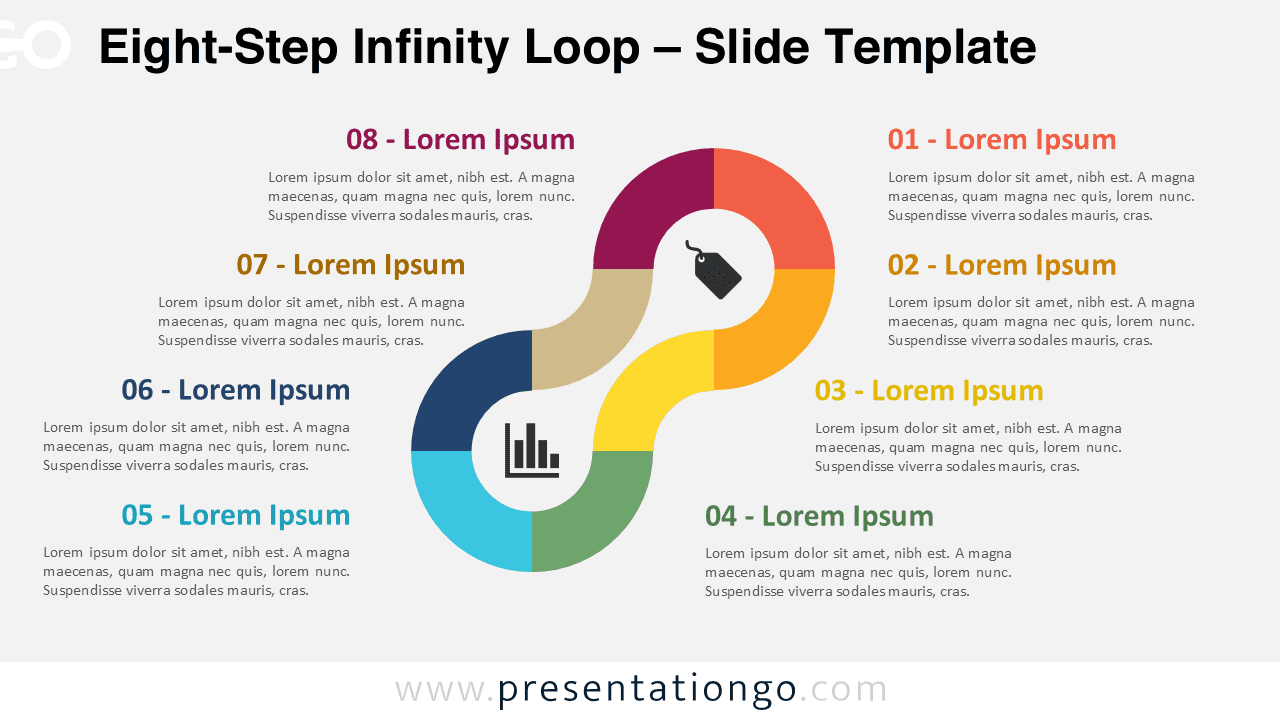
Download a free Eight-Step Infinity Loop for PowerPoint and Google Slides, ideal for visualizing continuous cycles and extended workflows.
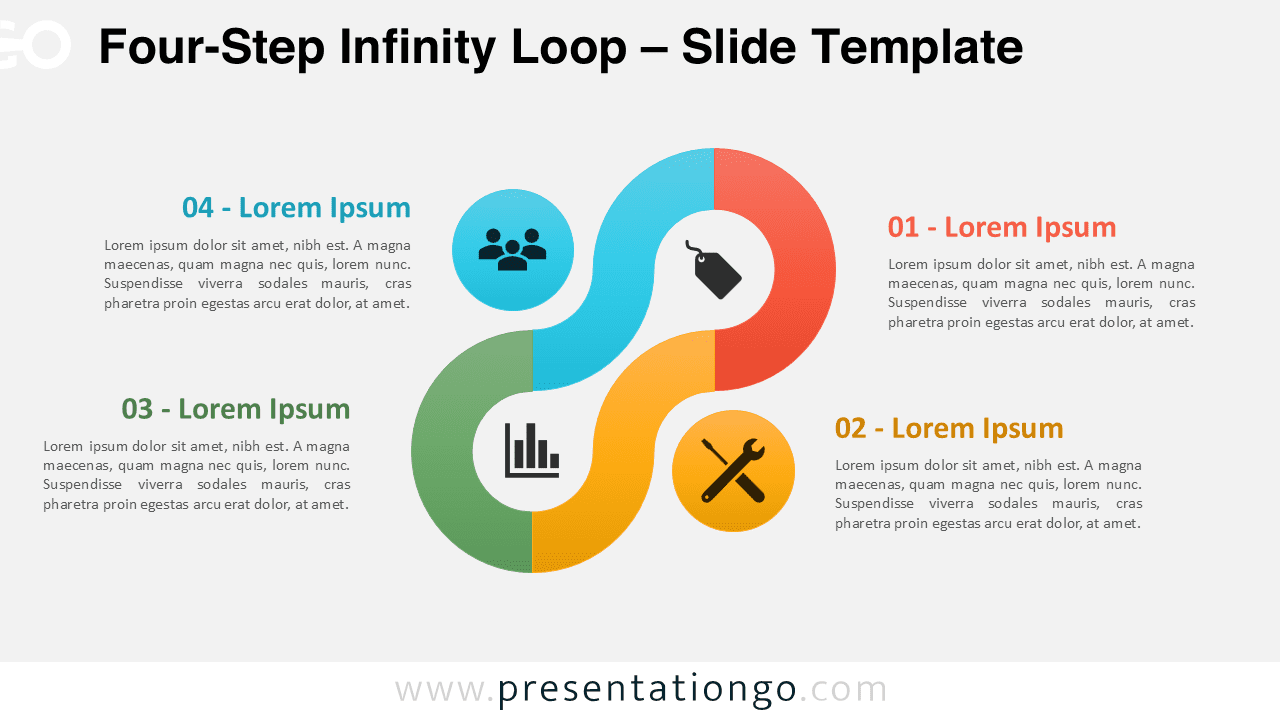
Download this free Four-Step Infinity Loop template for PowerPoint and Google Slides to illustrate ongoing workflows and circular concepts.
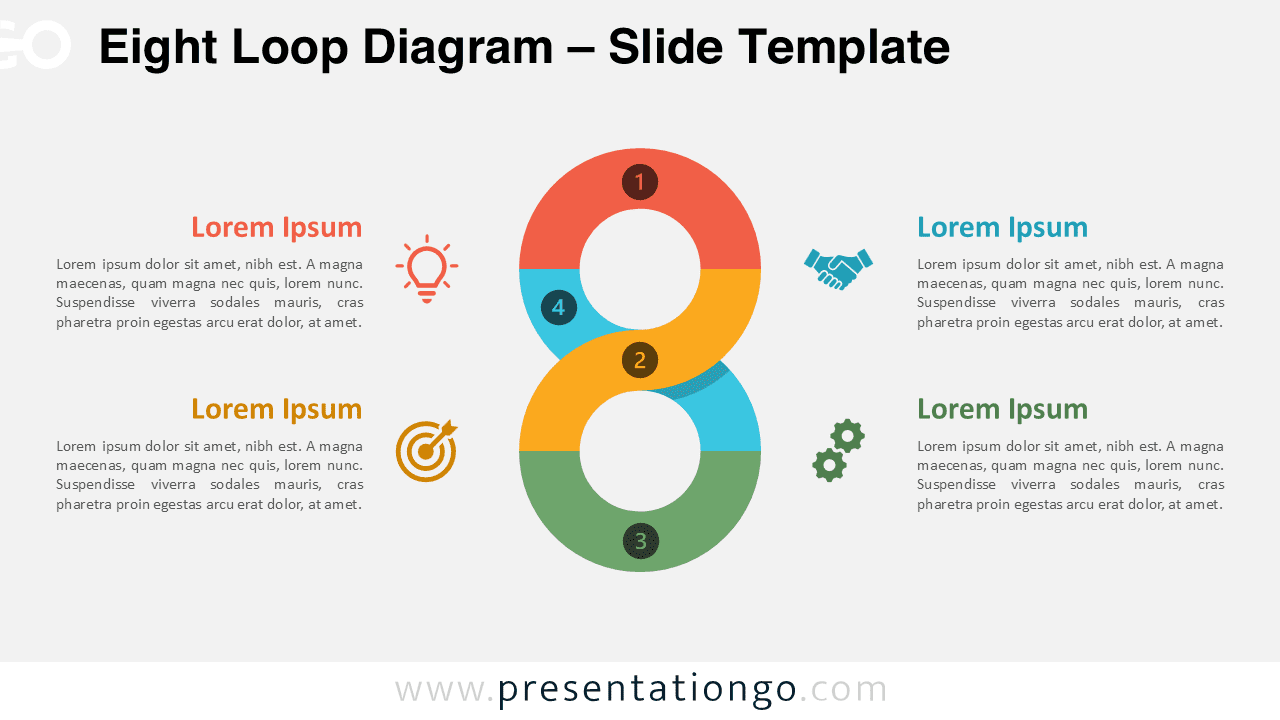
Download the Eight Loop Diagram for PowerPoint and Google Slides. Ideal for visualizing ongoing four-part workflows or strategic plans.
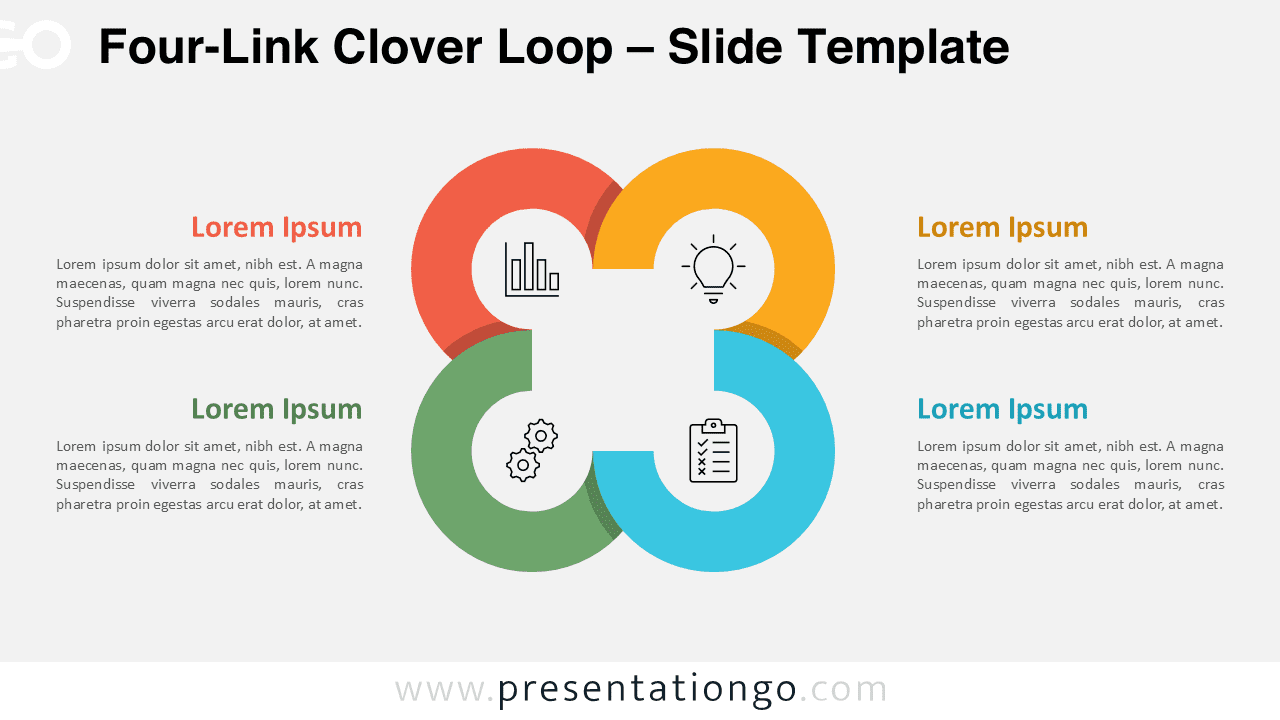
The Four-Link Clover Loop for PowerPoint and Google Slides shows 4 connected steps in a free template. Ideal for workflows or systems.
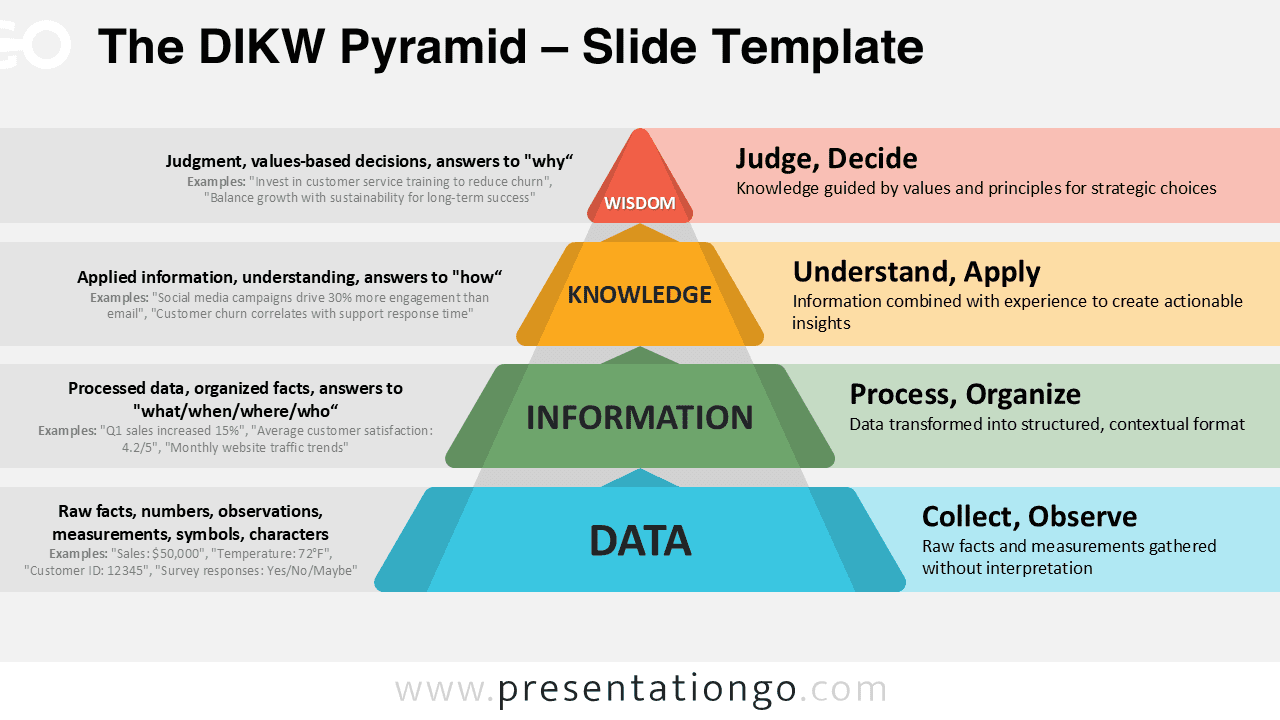
Download the DIKW Pyramid for PowerPoint and Google Slides to present the transformation from raw data to actionable insights in four steps.
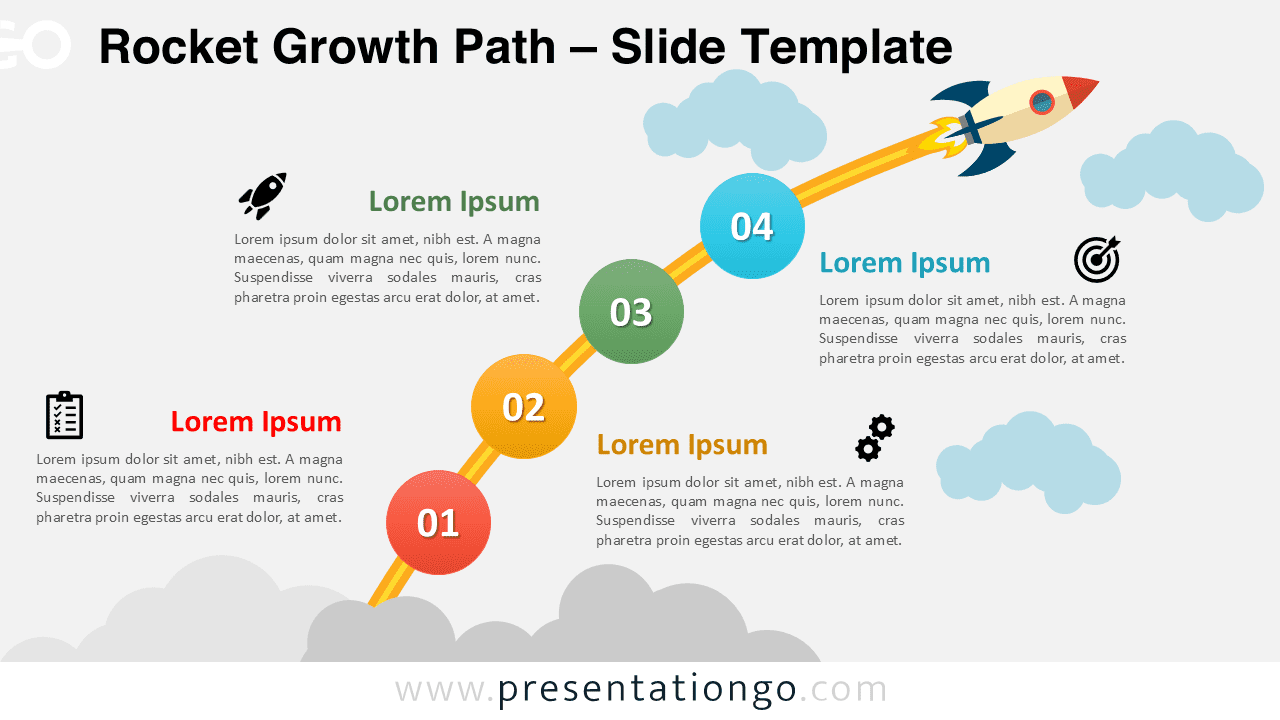
Download Rocket Growth Path for PowerPoint and Google Slides, a free upward diagram to show progress, strategy, or launch stages.
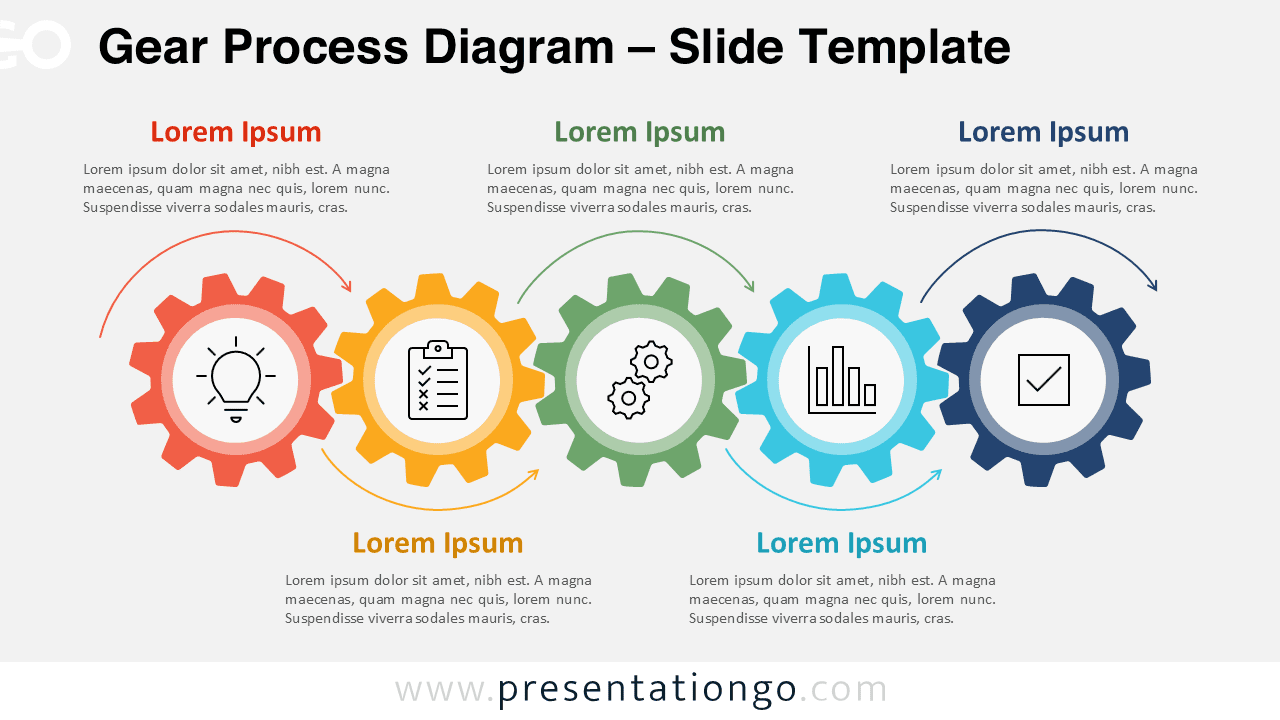
Get this free Gear Process Diagram for PowerPoint and Google Slides. Show five-step systems or cause-effect sequences with editable gears.
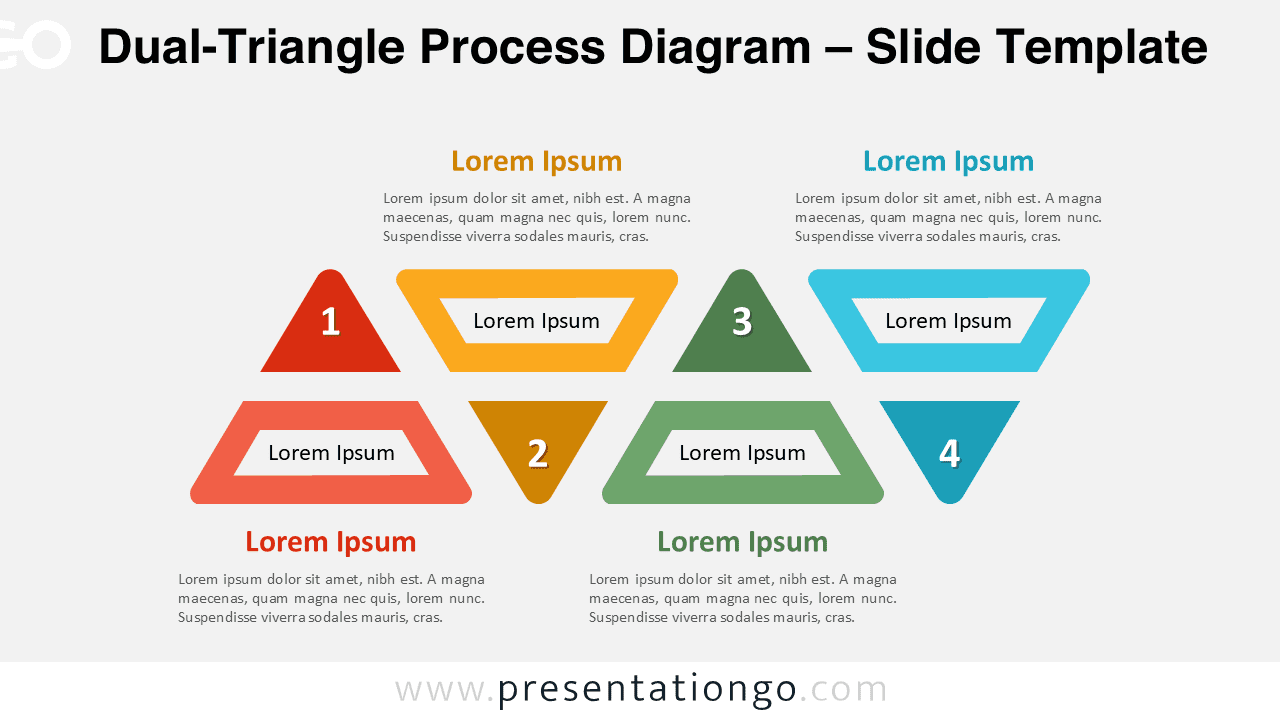
Download this Dual-Triangle Process Diagram for PowerPoint and Google Slides to break down processes, features, or team roles in four steps.