Loading resources…
Total 1760 resources
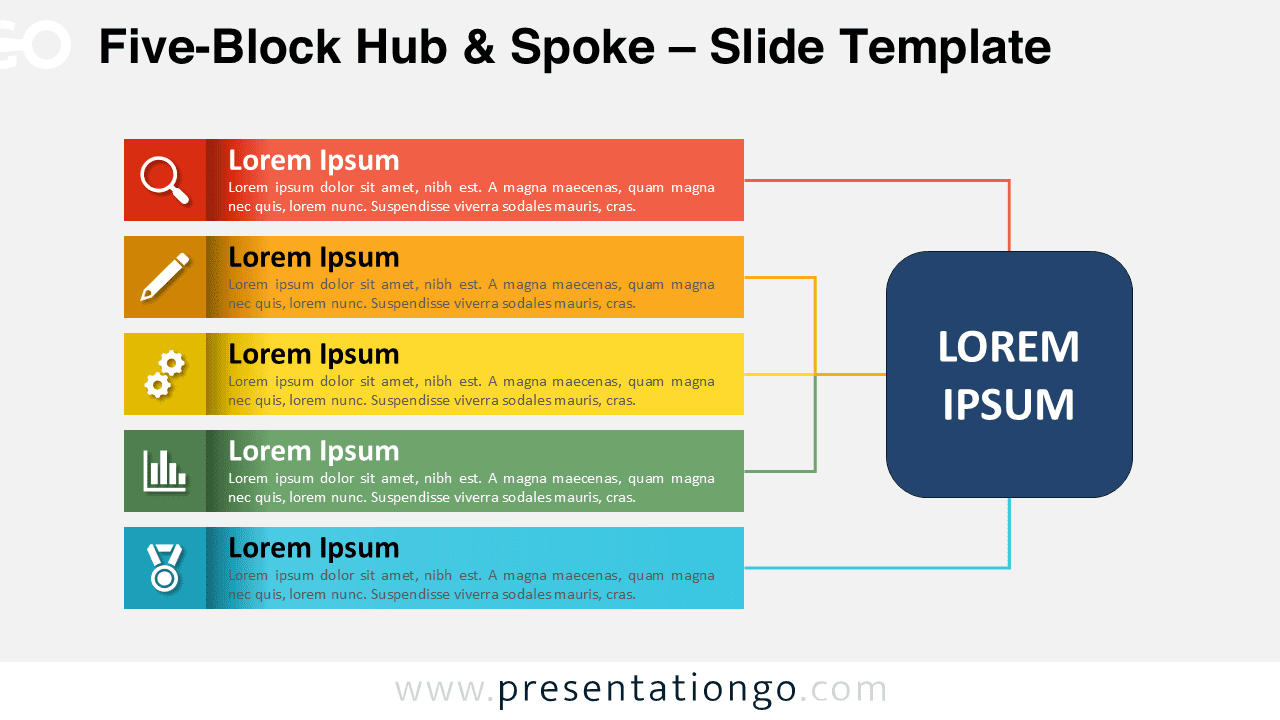
Download the Five-Block Hub & Spoke for PowerPoint and Google Slides to showcase 5 elements that connect to a central idea.
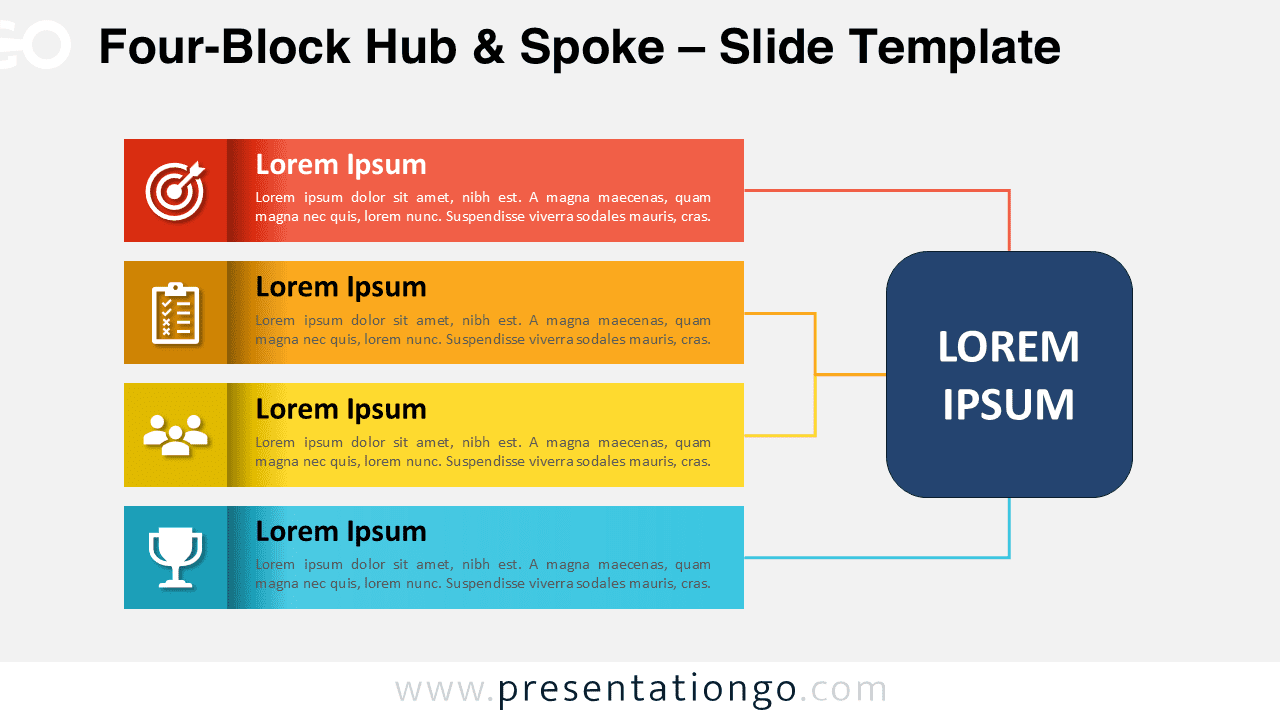
Four-Block Hub & Spoke for PowerPoint and Google Slides. Download this free template to present grouped ideas connected to one core.
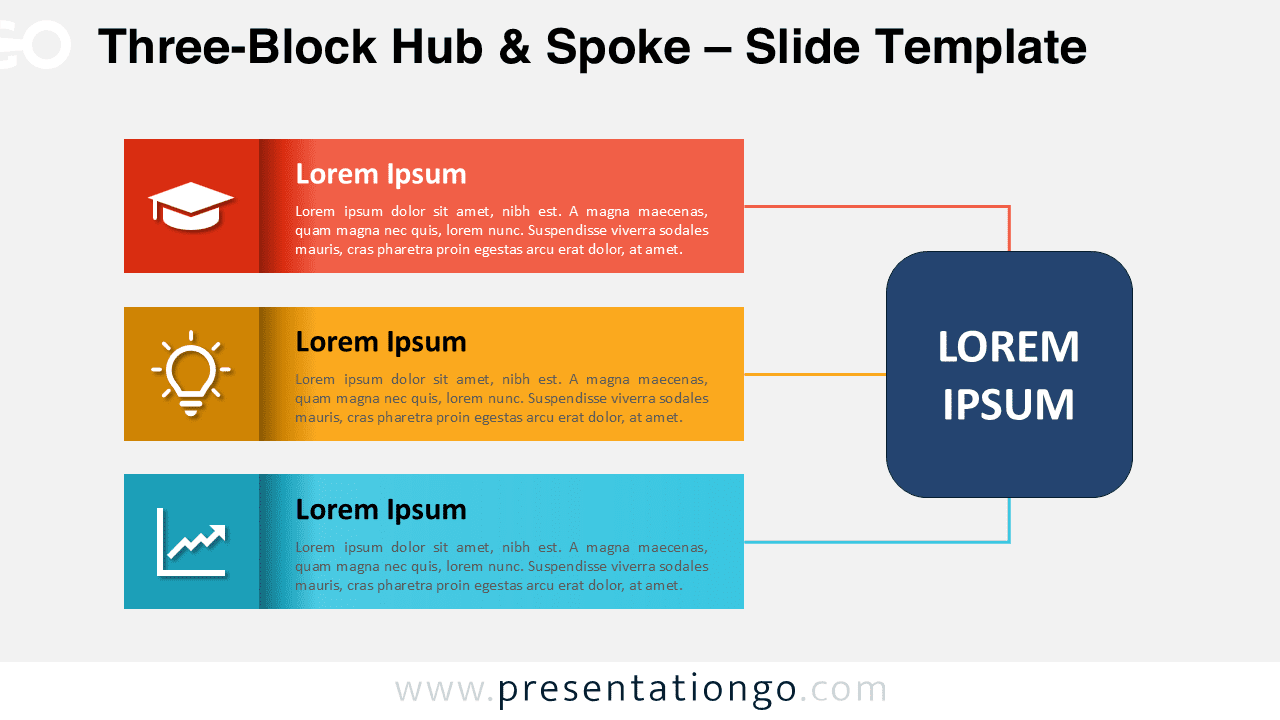
Download this Three-Block Hub & Spoke visual for PowerPoint and Google Slides to present three grouped ideas with clarity.
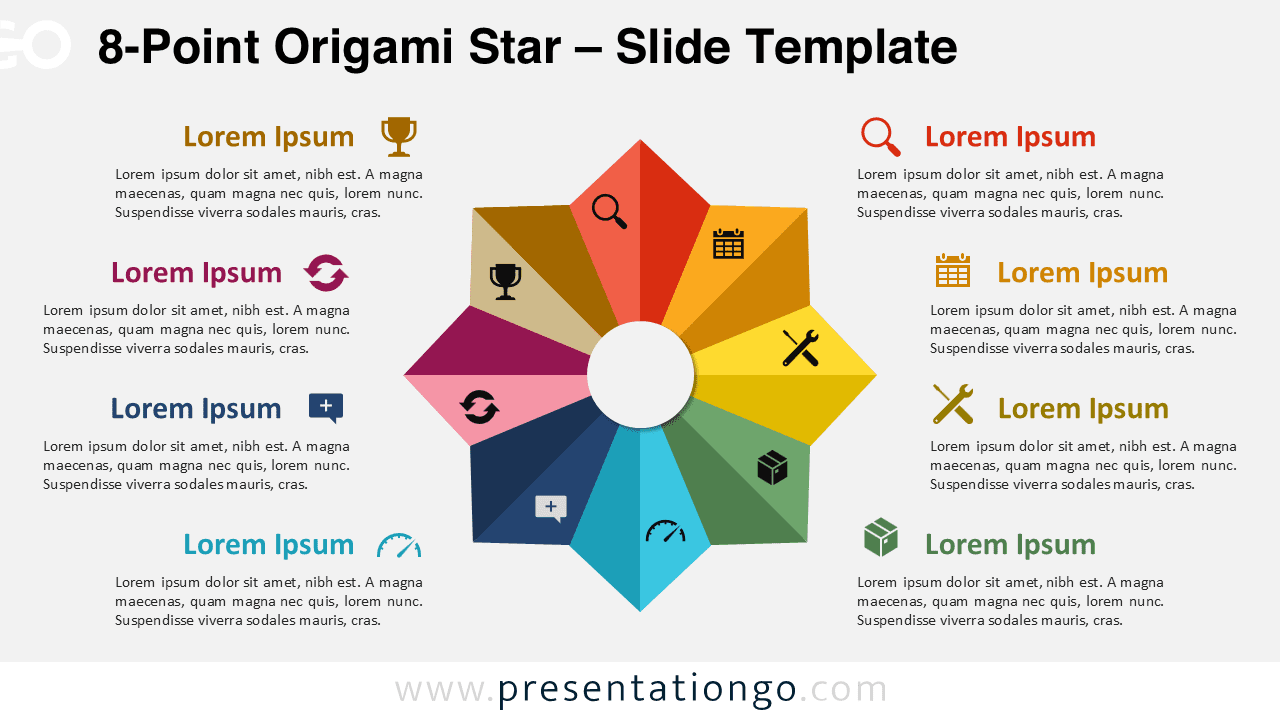
Download the 8-Point Origami Star for PowerPoint and Google Slides—an editable radial layout ideal for 8-step processes and strategy maps.
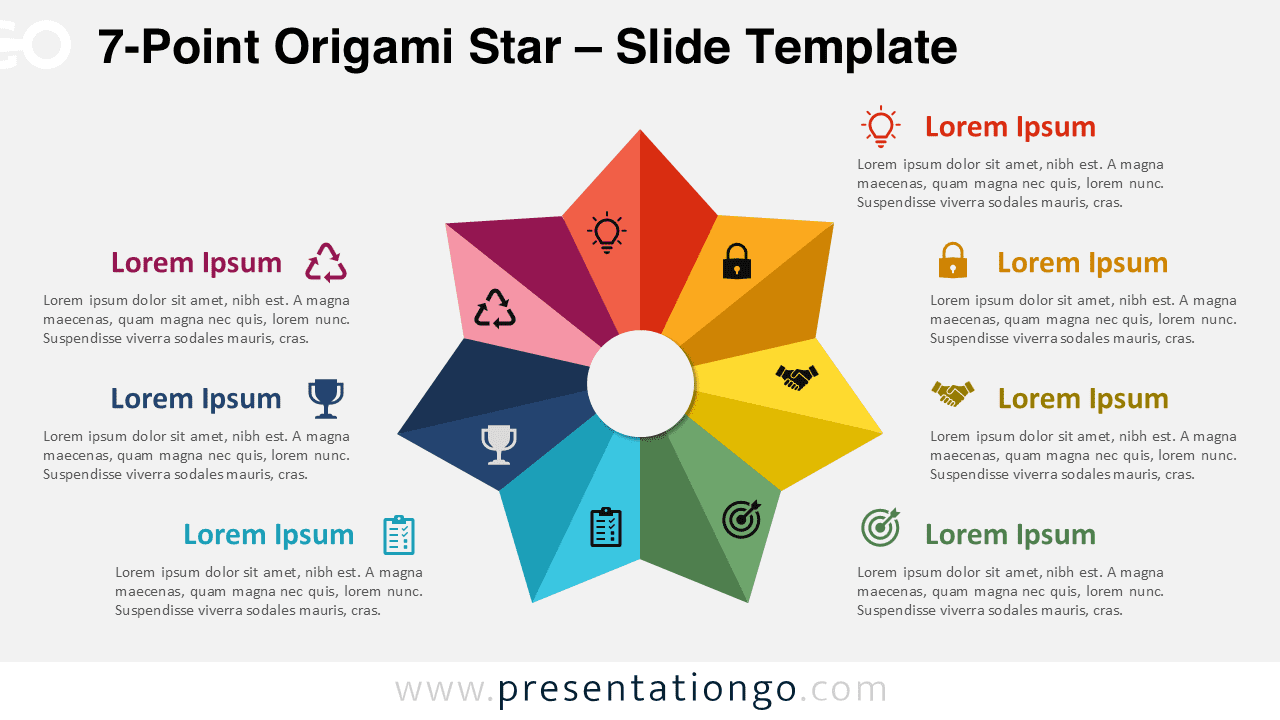
Download the 7-Point Origami Star for PowerPoint and Google Slides, a free editable visual diagram for showing 7 interconnected ideas.
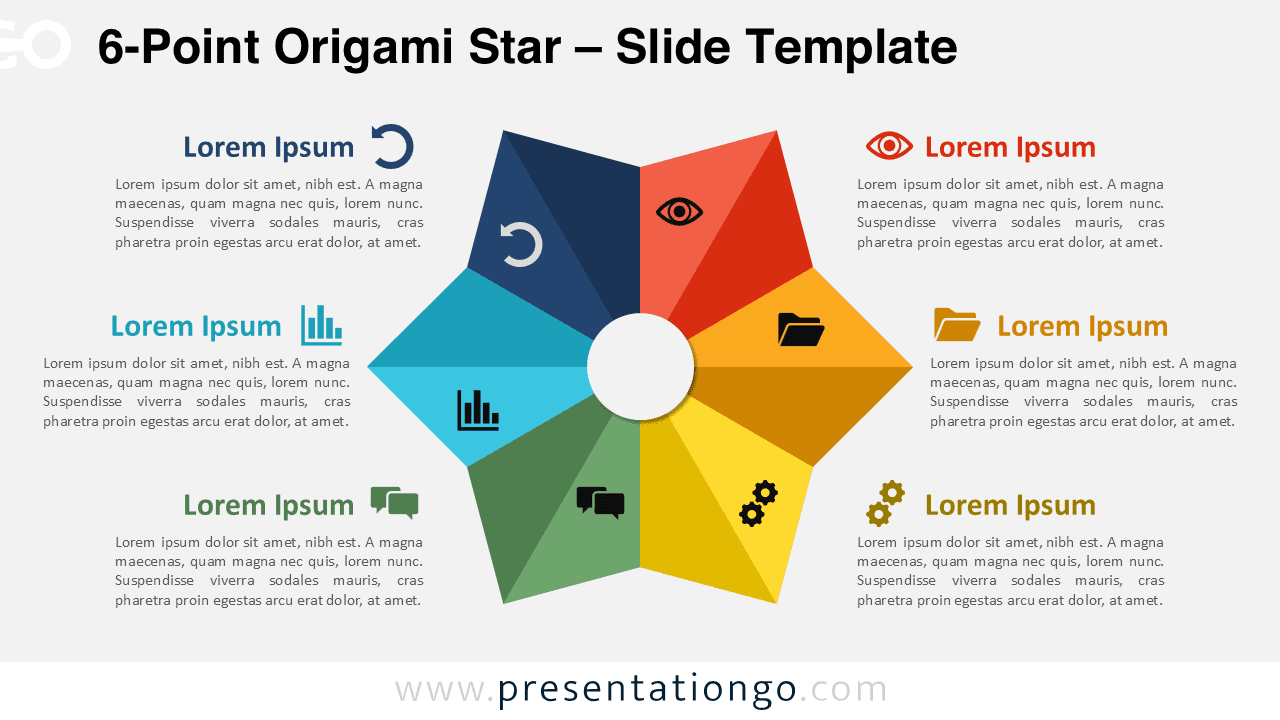
Download this 6-Point Origami Star for PowerPoint and Google Slides to highlight six equal parts of a central idea with clarity and style.
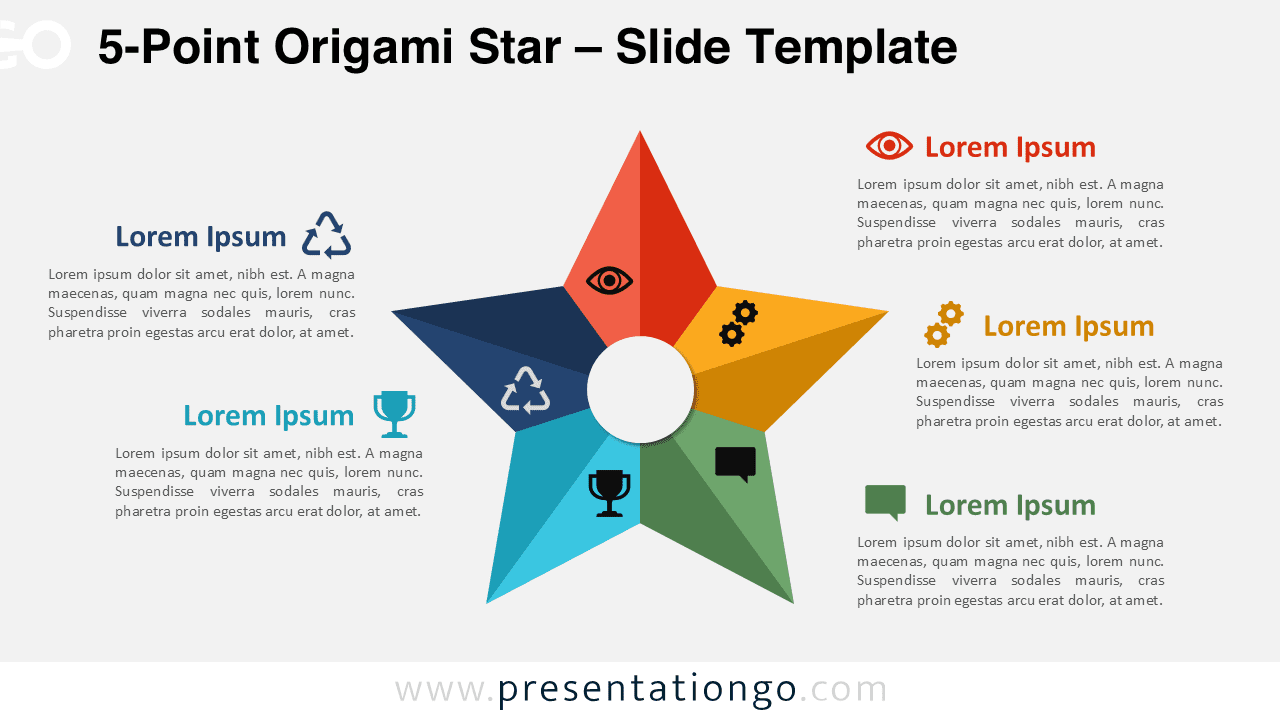
The 5-Point Origami Star for PowerPoint and Google Slides is a free template ideal for 5-part presentations with radial or circular flow.
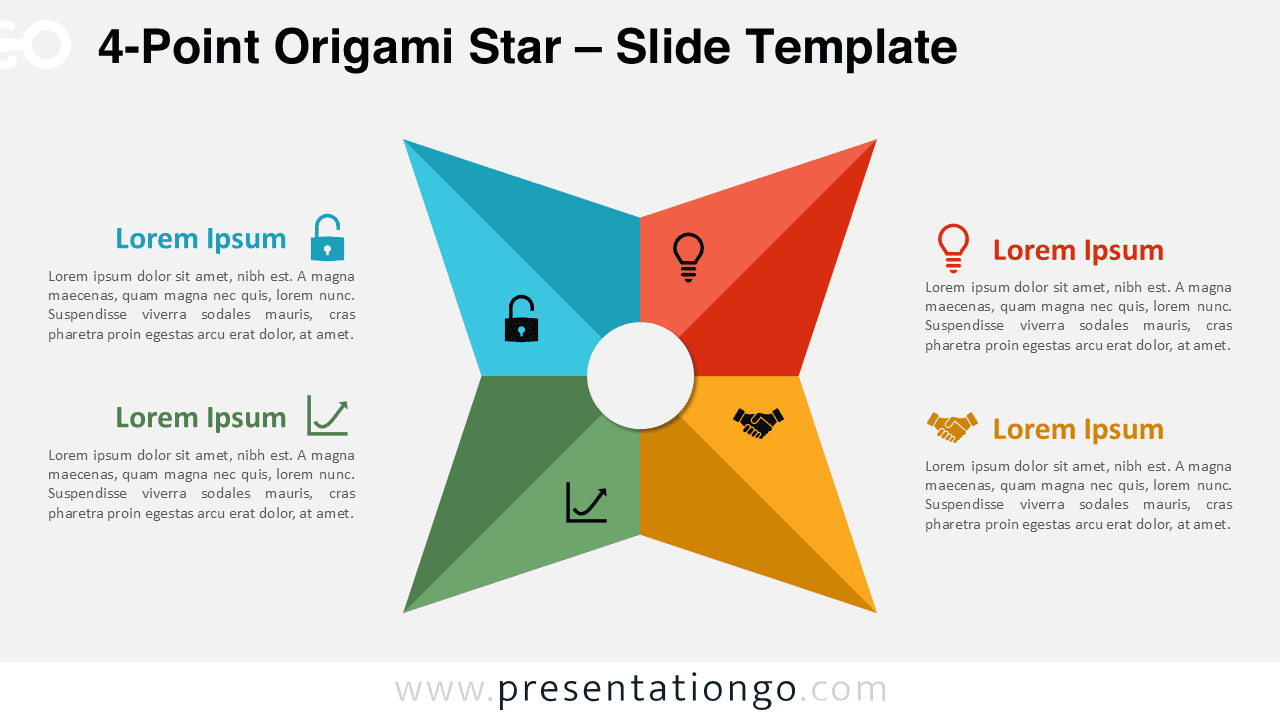
Download the 4-Point Origami Star for PowerPoint and Google Slides to visualize four equal parts in a radial, balanced format.
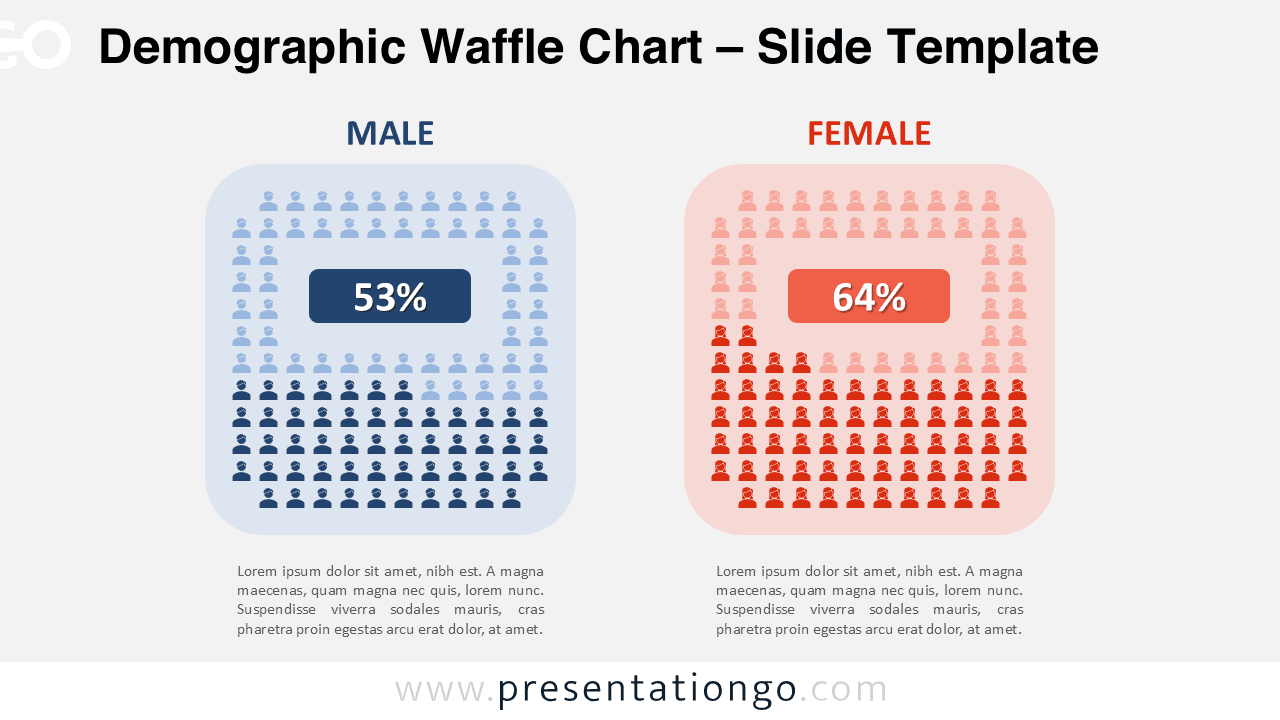
Download the Demographic Waffle Chart for PowerPoint and Google Slides to compare gender-based data with editable icon grids and percentages.
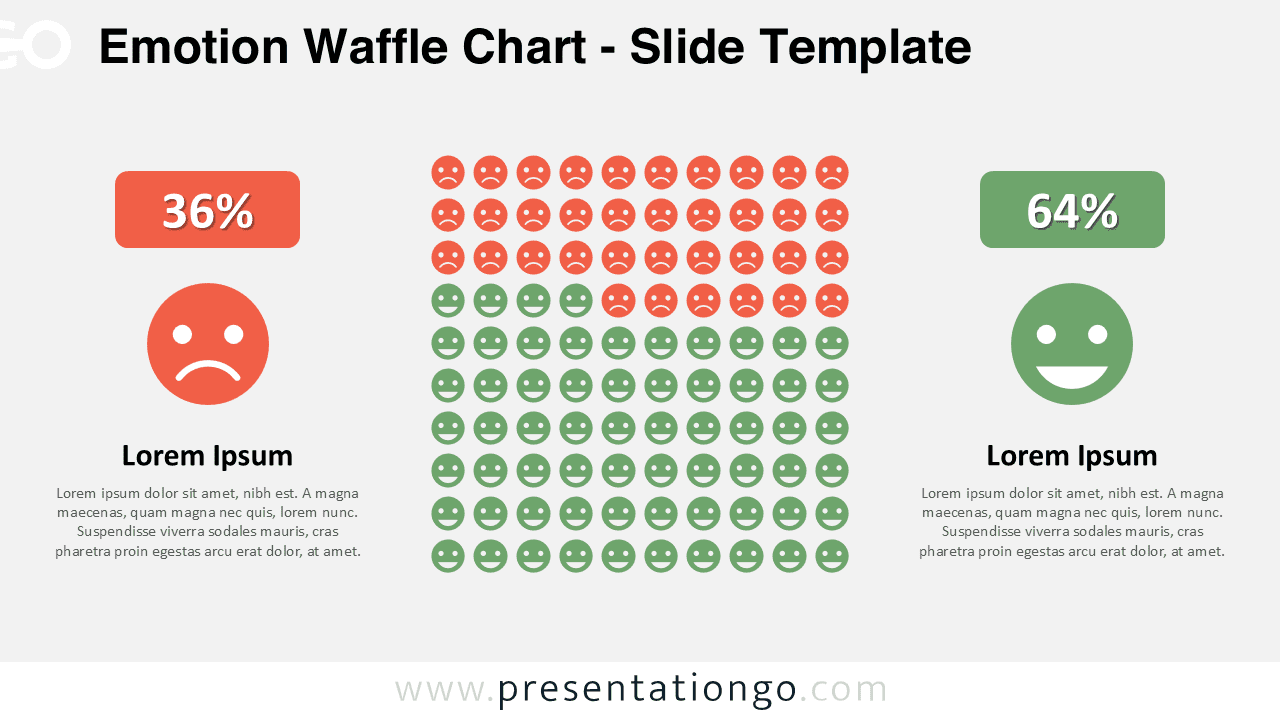
Download free Emotion Waffle Chart for PowerPoint and Google Slides to show positive and negative sentiments using smiley and frowny icons.
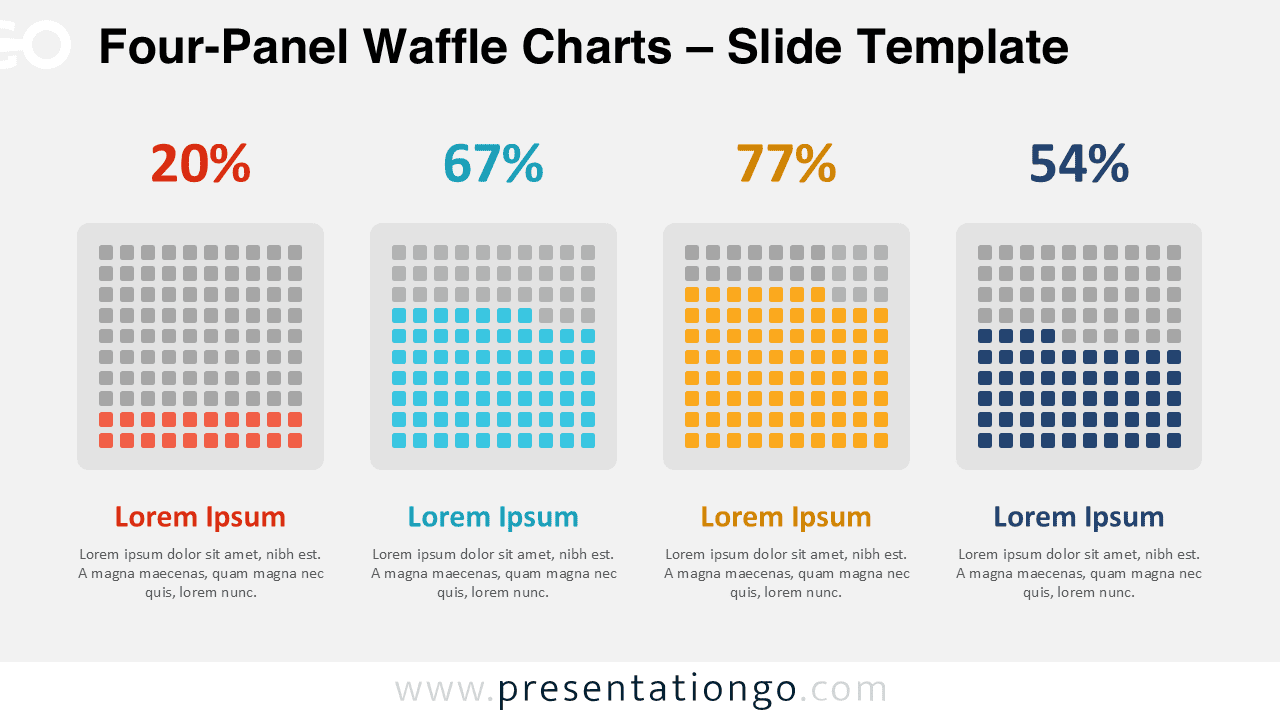
Download the Four-Panel Waffle Charts template for PowerPoint and Google Slides, ideal for comparing metrics across four categories.
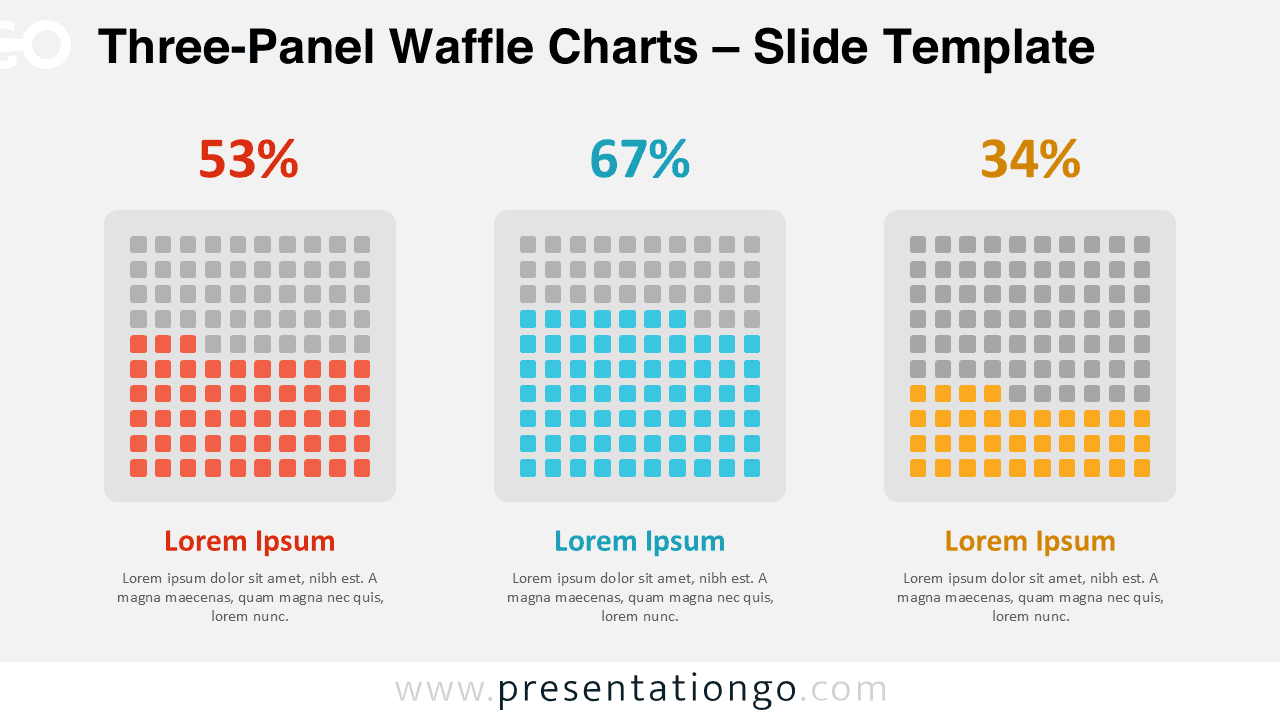
Download this free Three-Panel Waffle Charts template for PowerPoint and Google Slides to display three values using grid-based visuals.
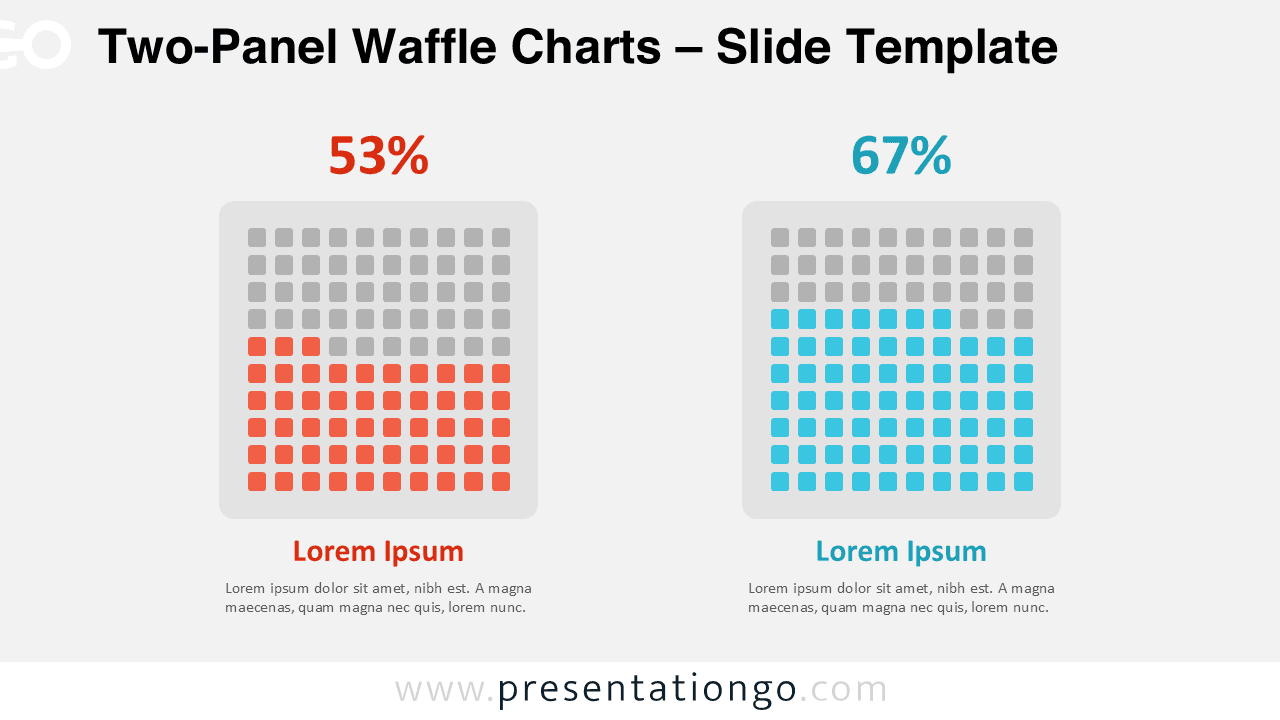
Download this Two-Panel Waffle Charts template for PowerPoint and Google Slides and easily compare two key percentages in one slide.
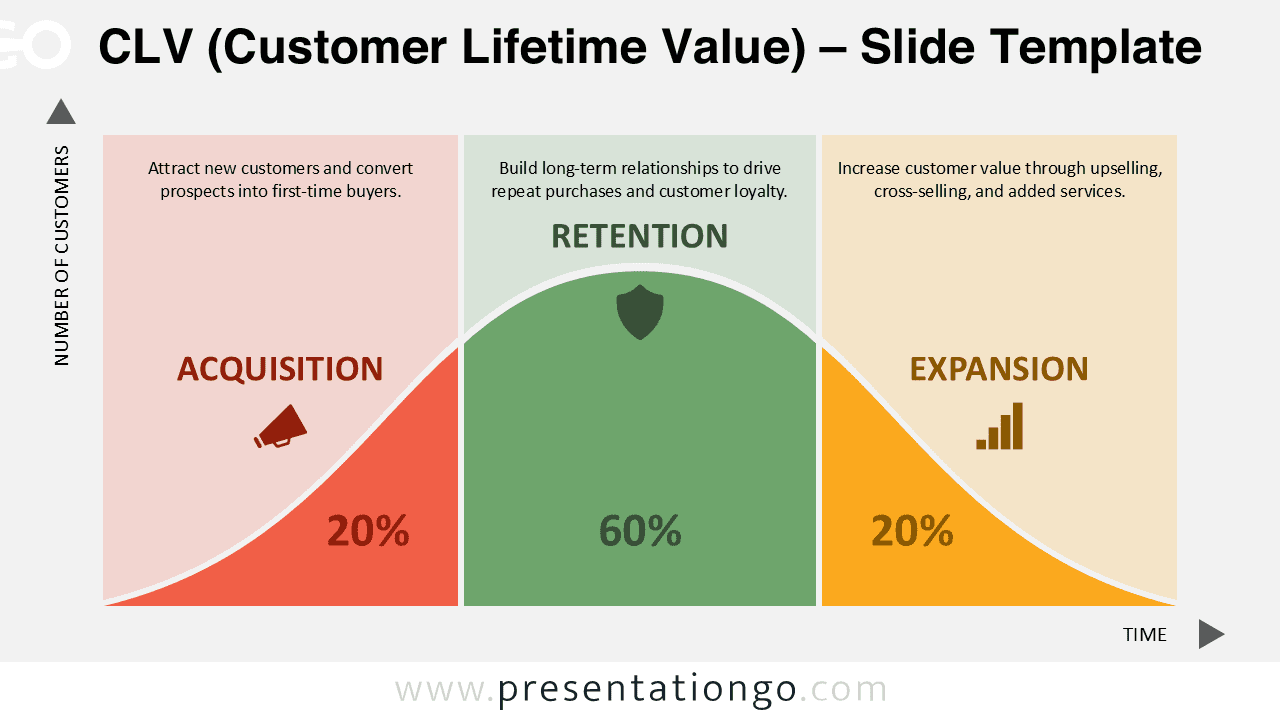
Download this CLV (Customer Lifetime Value) template for PowerPoint & Google Slides with acquisition, retention, and expansion breakdowns.
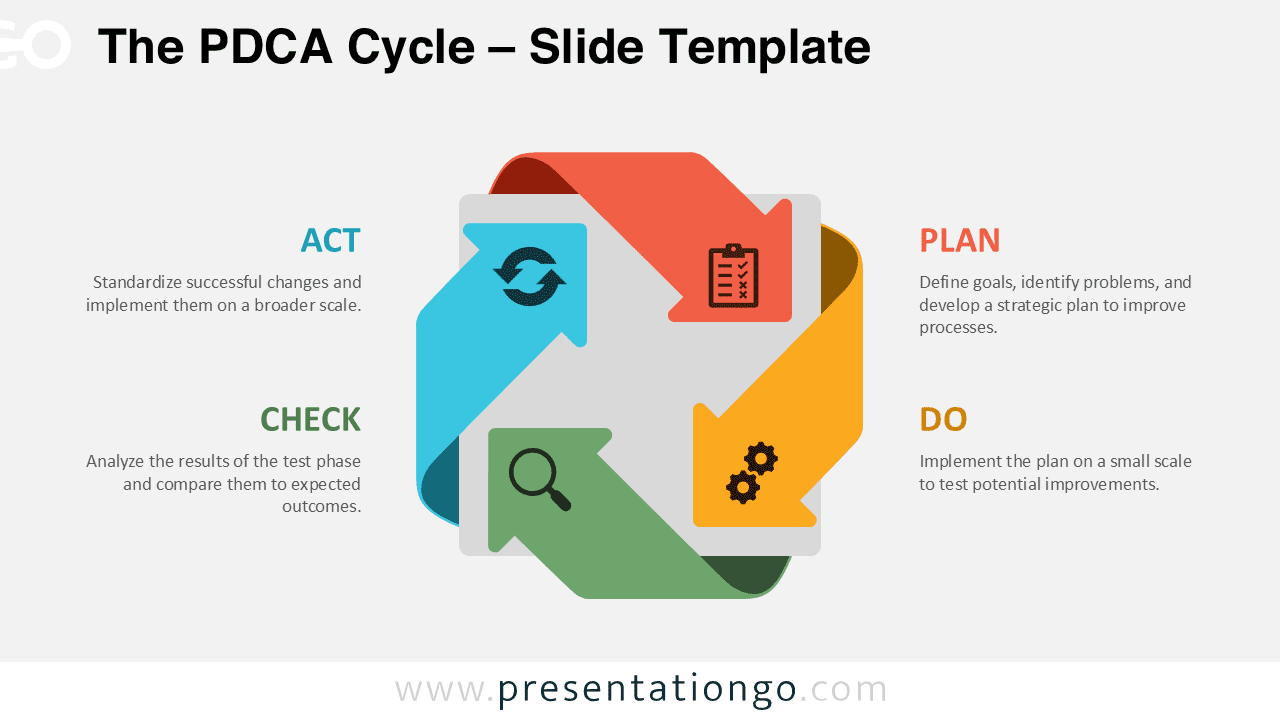
The PDCA Cycle for PowerPoint and Google Slides is a free process diagram for showing iterative strategies and structured problem-solving.
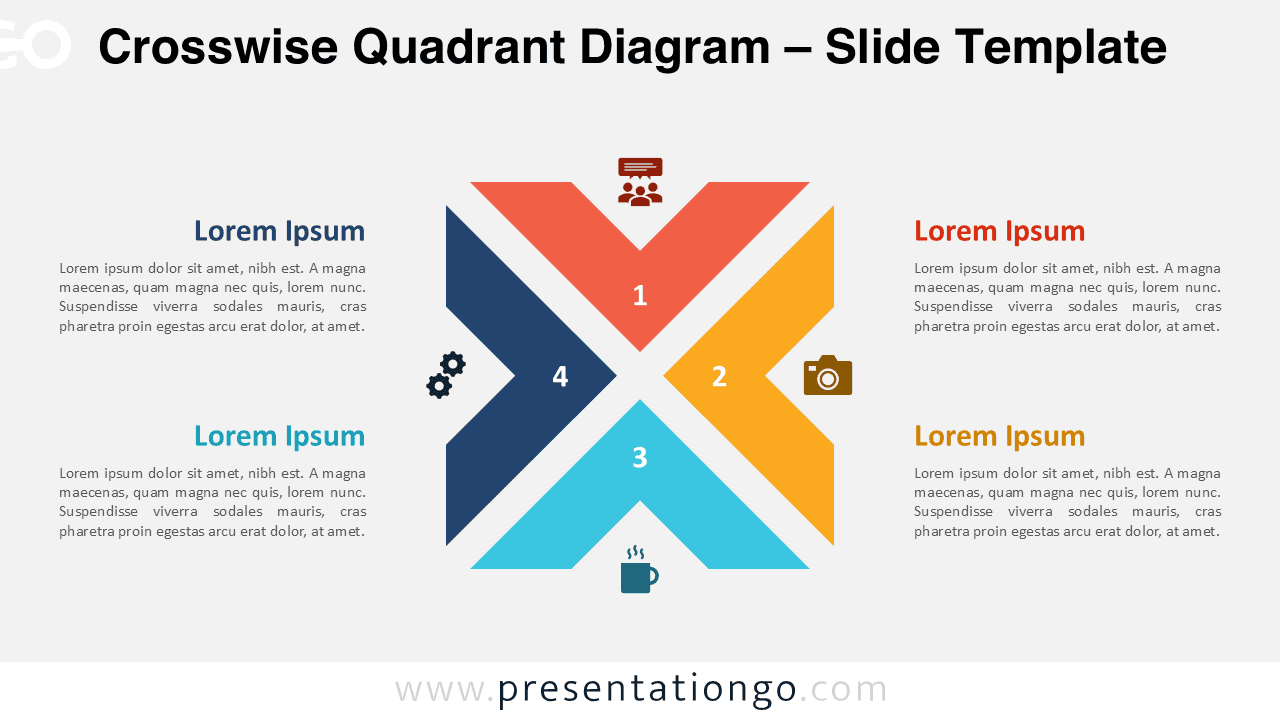
Download this Crosswise Quadrant Diagram for PowerPoint and Google Slides to illustrate 4 options with icons and a central focus.
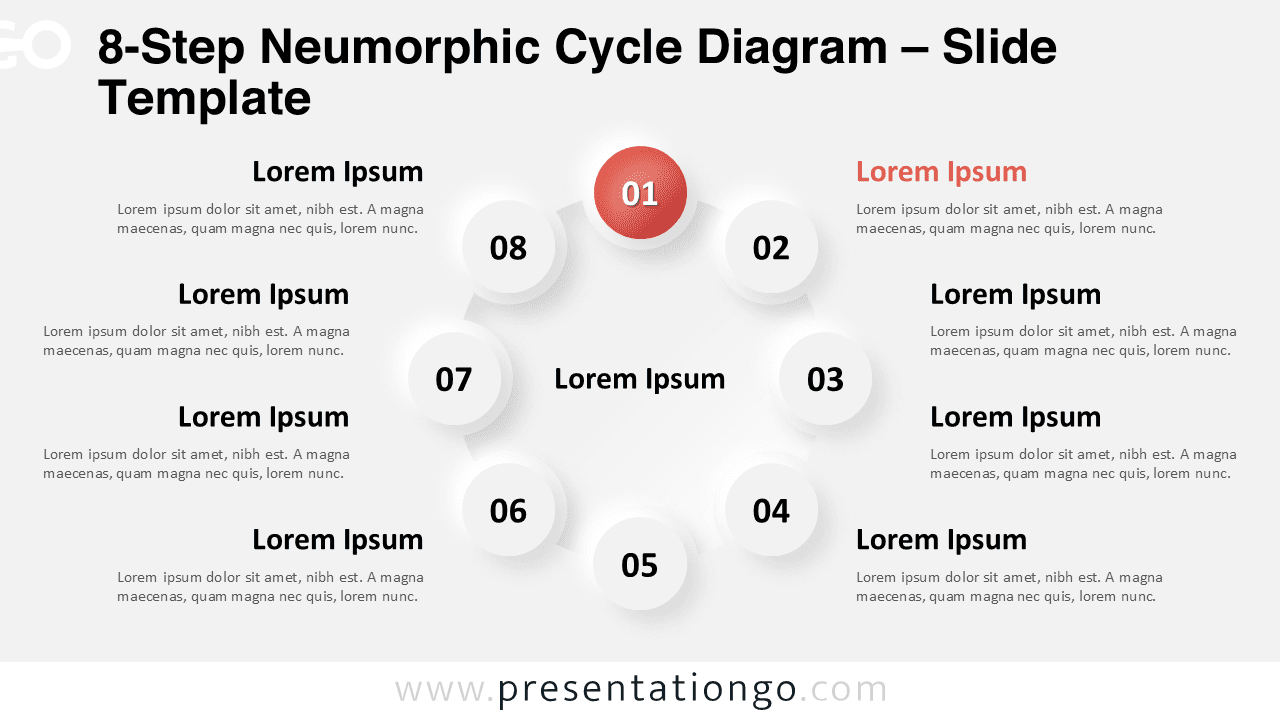
Download this 8-Step Neumorphic Cycle Diagram for PowerPoint and Google Slides to showcase strategic workflows and eight-stage cycles.
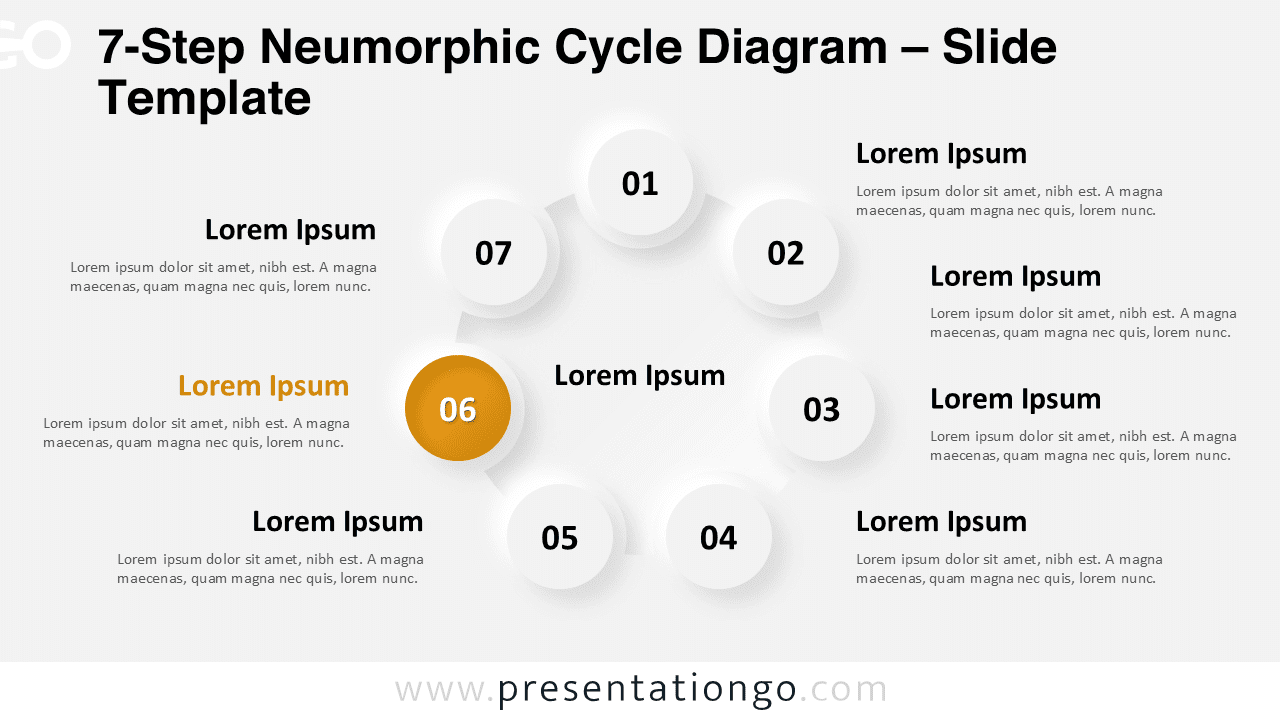
Download the 7-Step Neumorphic Cycle Diagram for PowerPoint and Google Slides to present connected concepts in a stylish radial format.
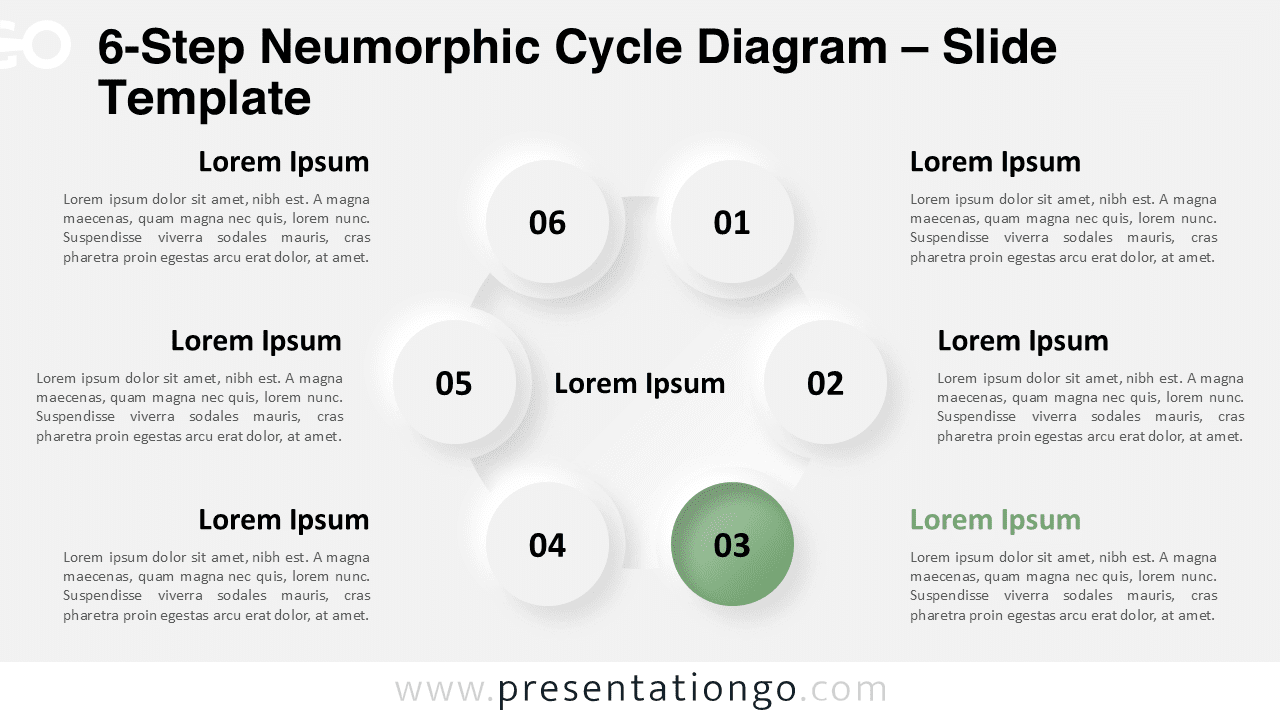
Download this free 6-Step Neumorphic Cycle Diagram for PowerPoint and Google Slides to showcase circular flows or lifecycle stages.
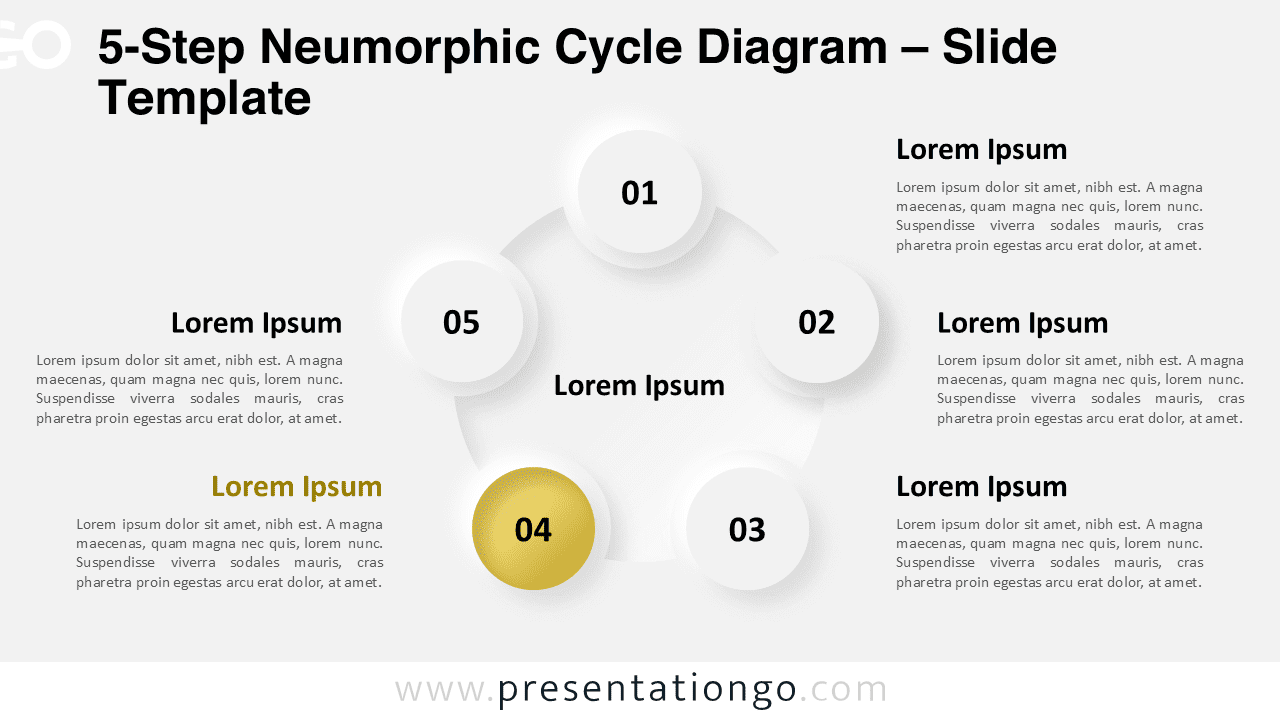
Use the 5-Step Neumorphic Cycle Diagram in PowerPoint and Google Slides to display five connected stages in a modern circular layout.
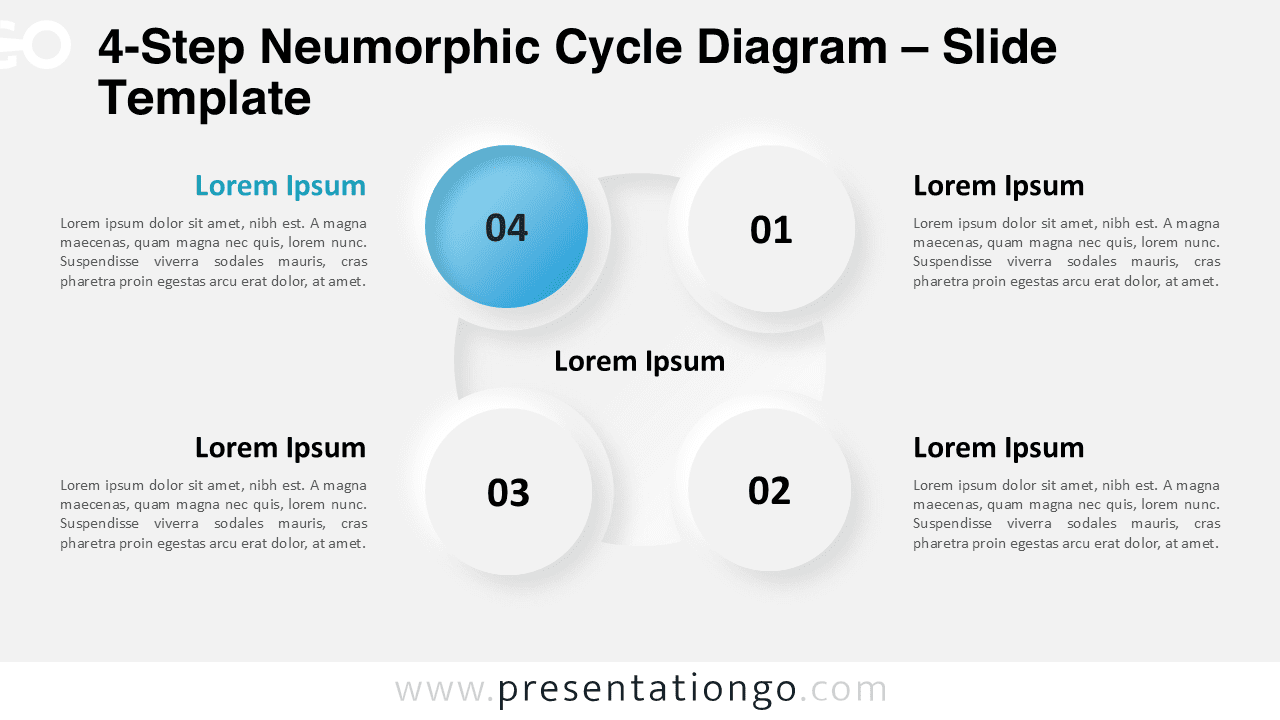
Download this 4-Step Neumorphic Cycle Diagram for PowerPoint and Google Slides to outline core concepts with four connected parts.
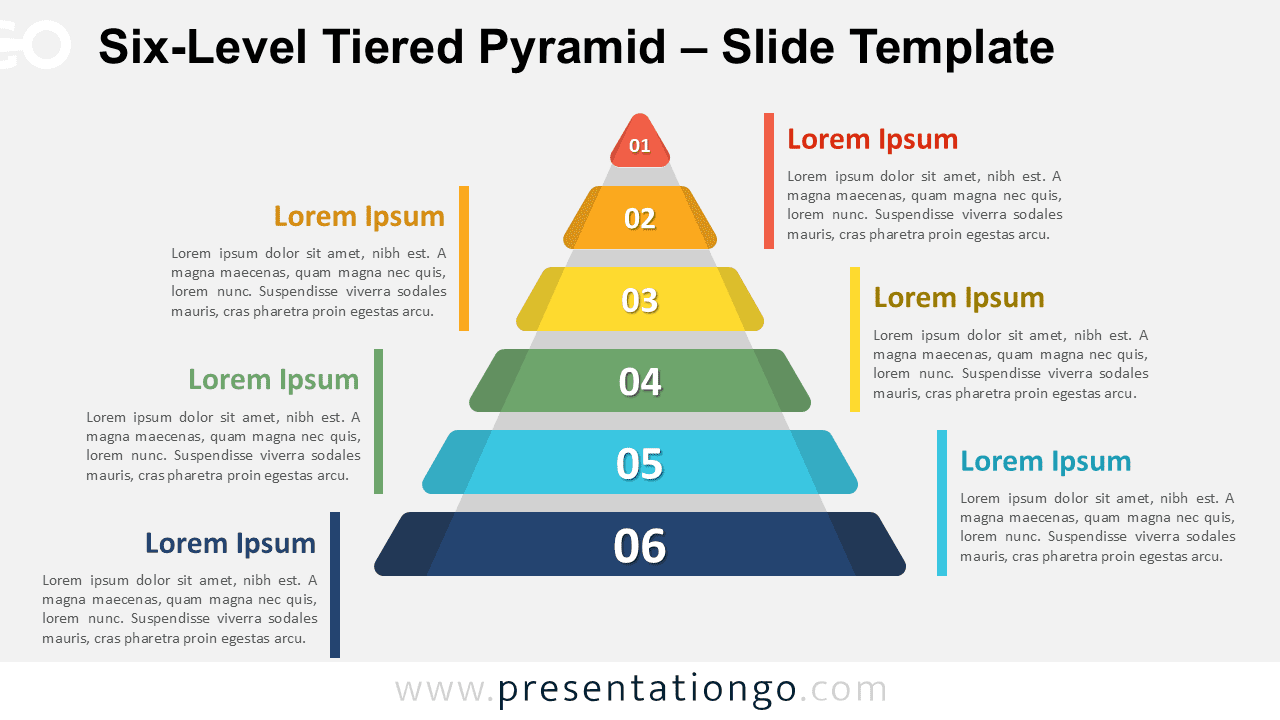
Download this free Six-Level Tiered Pyramid for PowerPoint and Google Slides to display processes, stages, or strategic hierarchies.
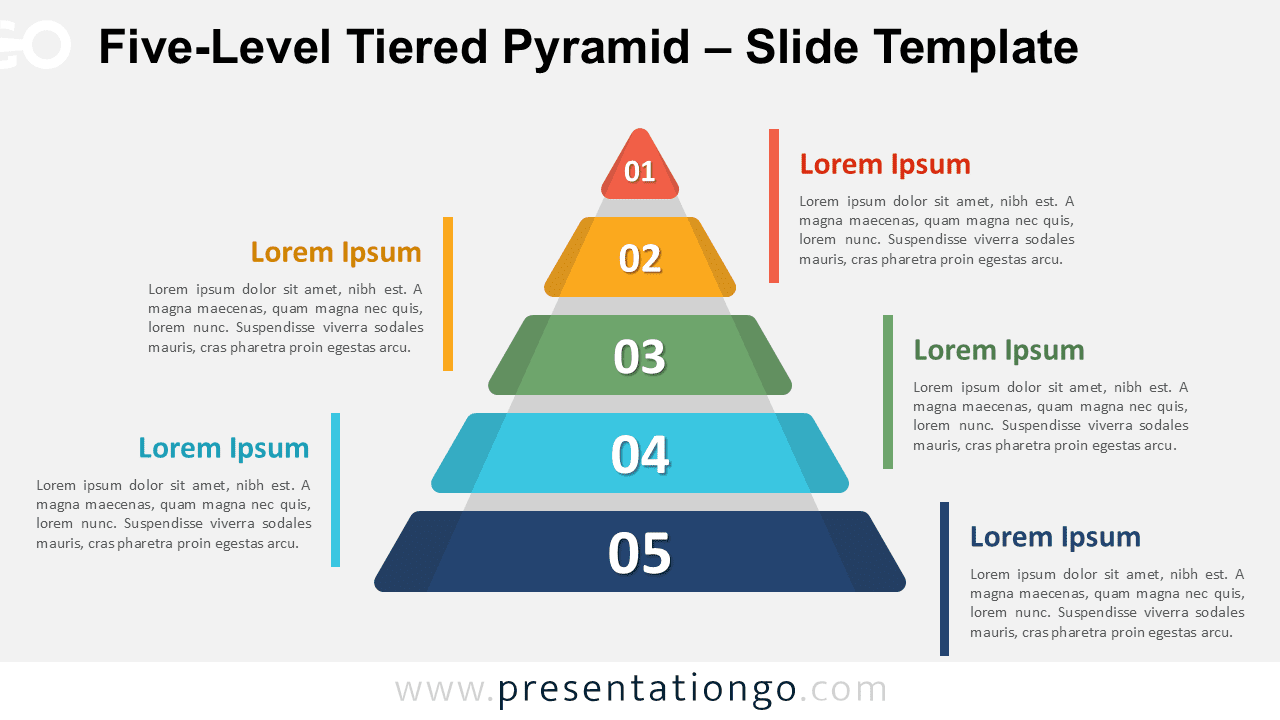
Download this free Five-Level Tiered Pyramid for PowerPoint and Google Slides to display strategies, stages, or priorities with clarity.
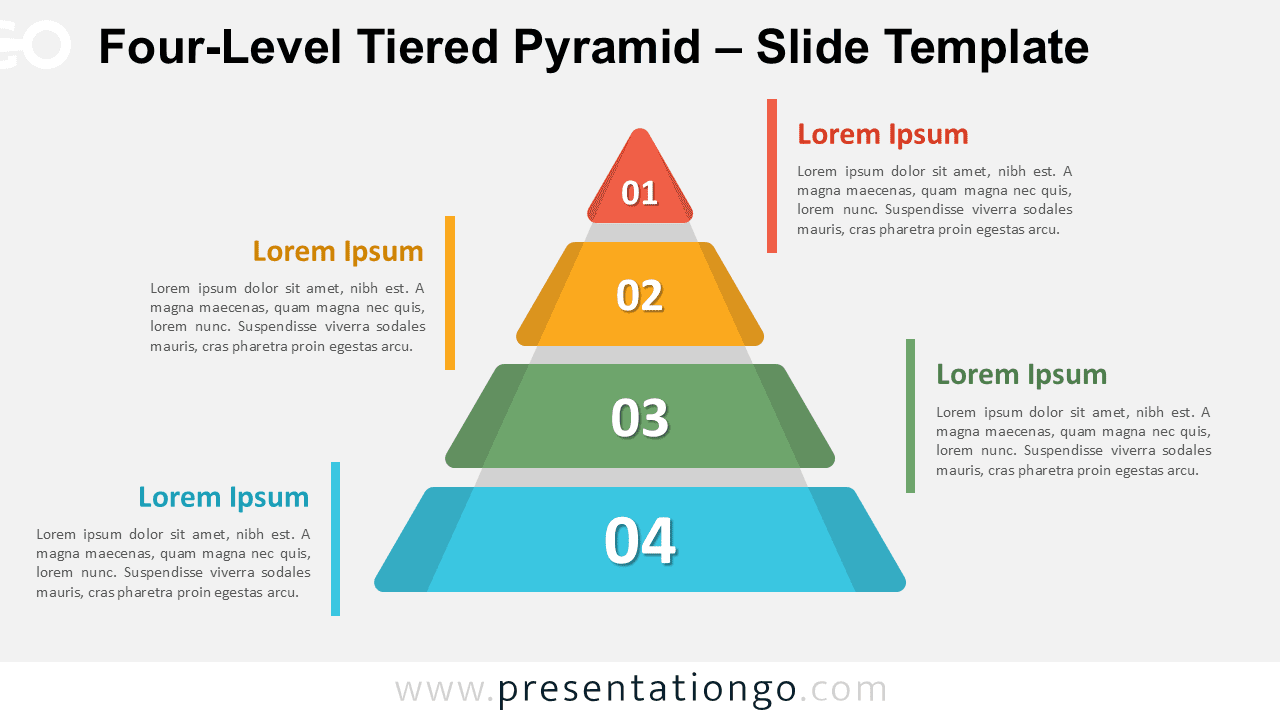
Download this Four-Level Tiered Pyramid template for PowerPoint and Google Slides to explain structure, process, or strategy in four parts.