Loading resources…
Total 1760 resources
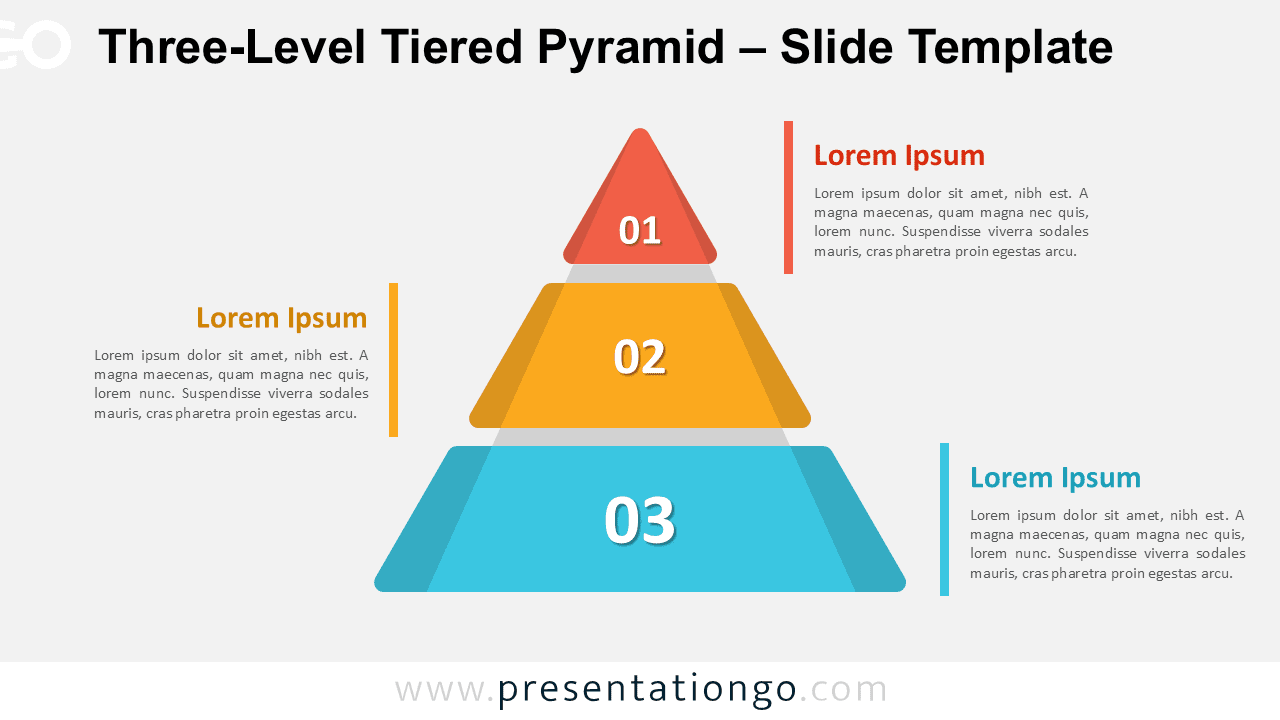
Three-Level Tiered Pyramid for PowerPoint and Google Slides features a free diagram ideal for illustrating 3-step processes or hierarchies.
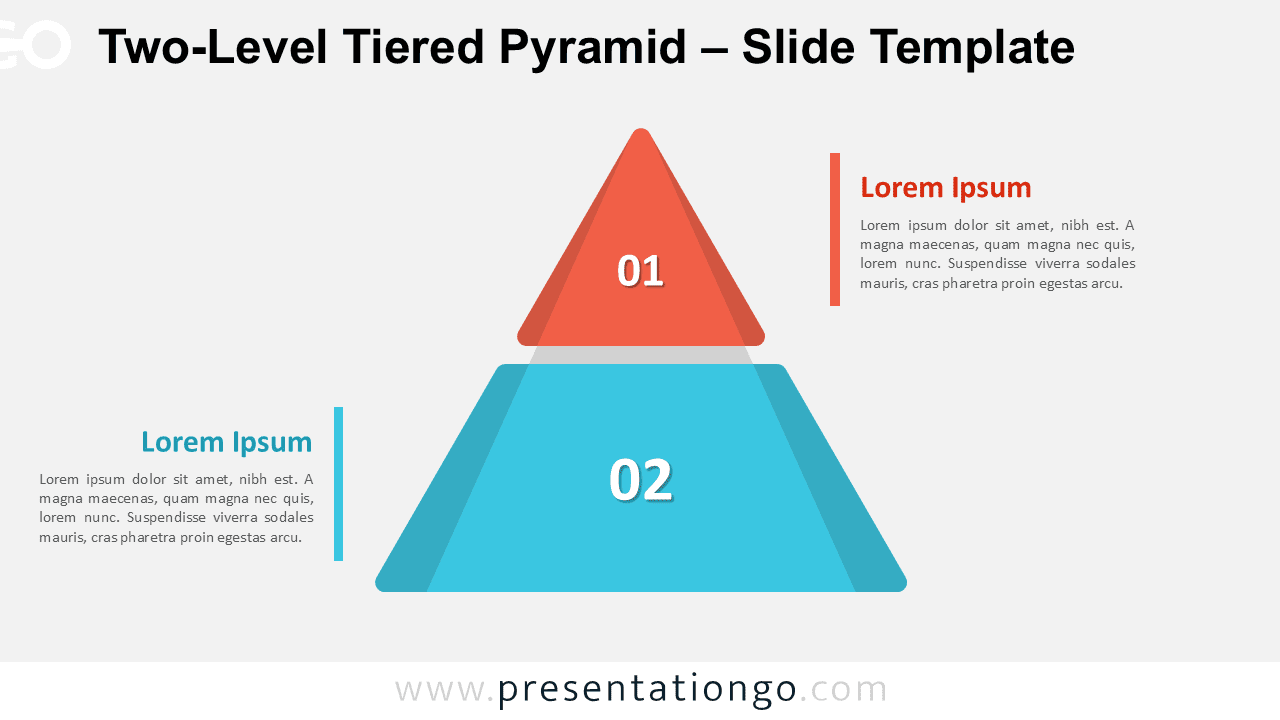
The Two-Level Tiered Pyramid for PowerPoint and Google Slides helps display clear strategic processes, phases, or organizational levels.
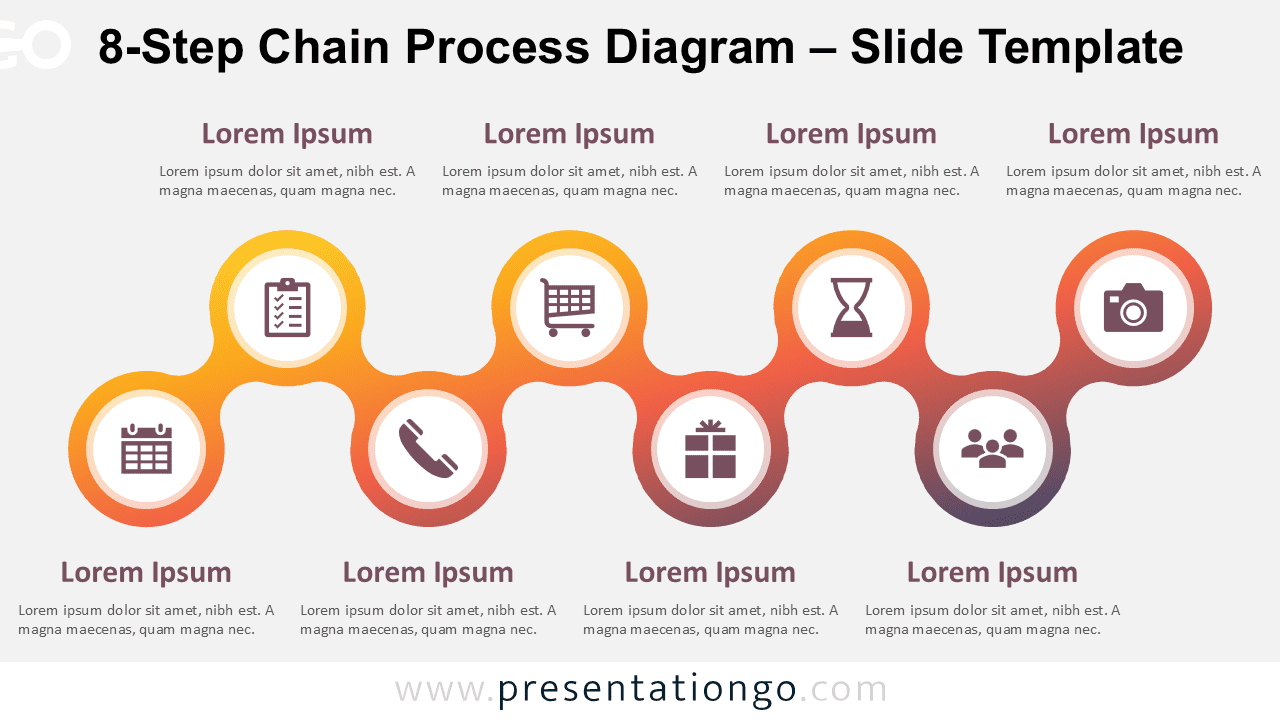
Download this 8-Step Chain Process Diagram for PowerPoint and Google Slides to show connected stages, workflows, and progressions.
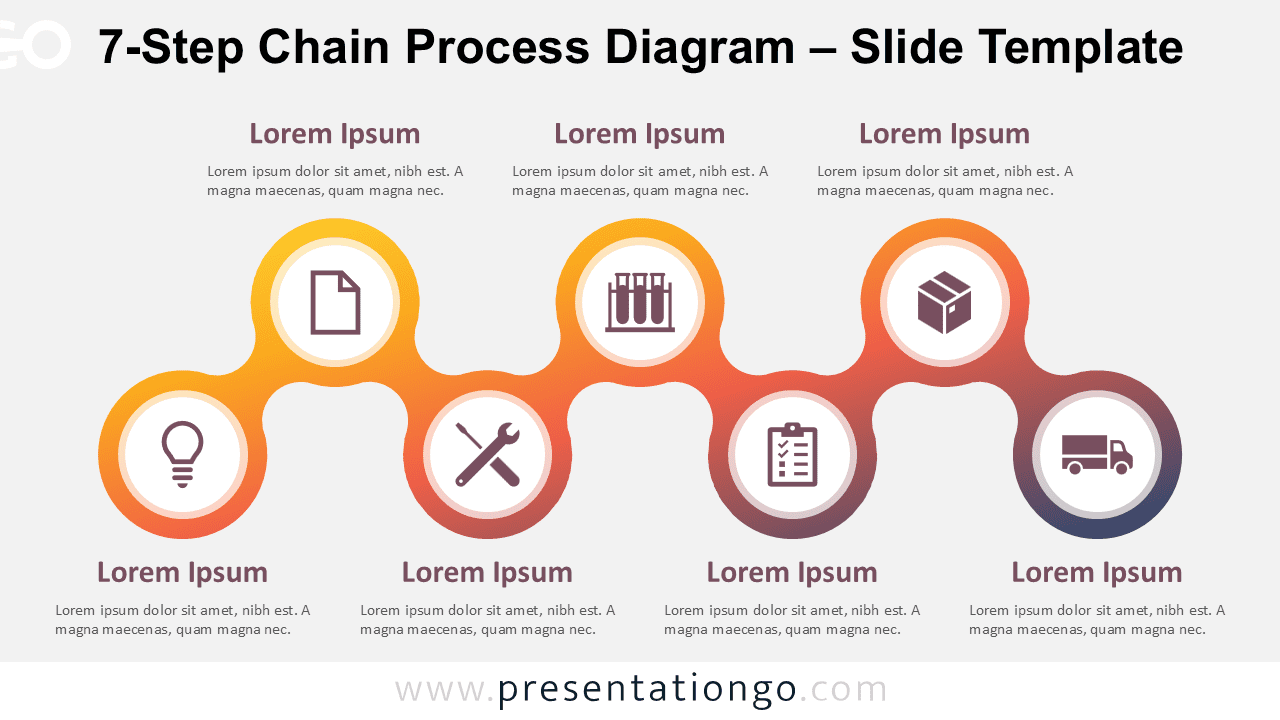
Download the 7-Step Chain Process Diagram for PowerPoint and Google Slides to present 7 linear phases in a clear, connected layout.
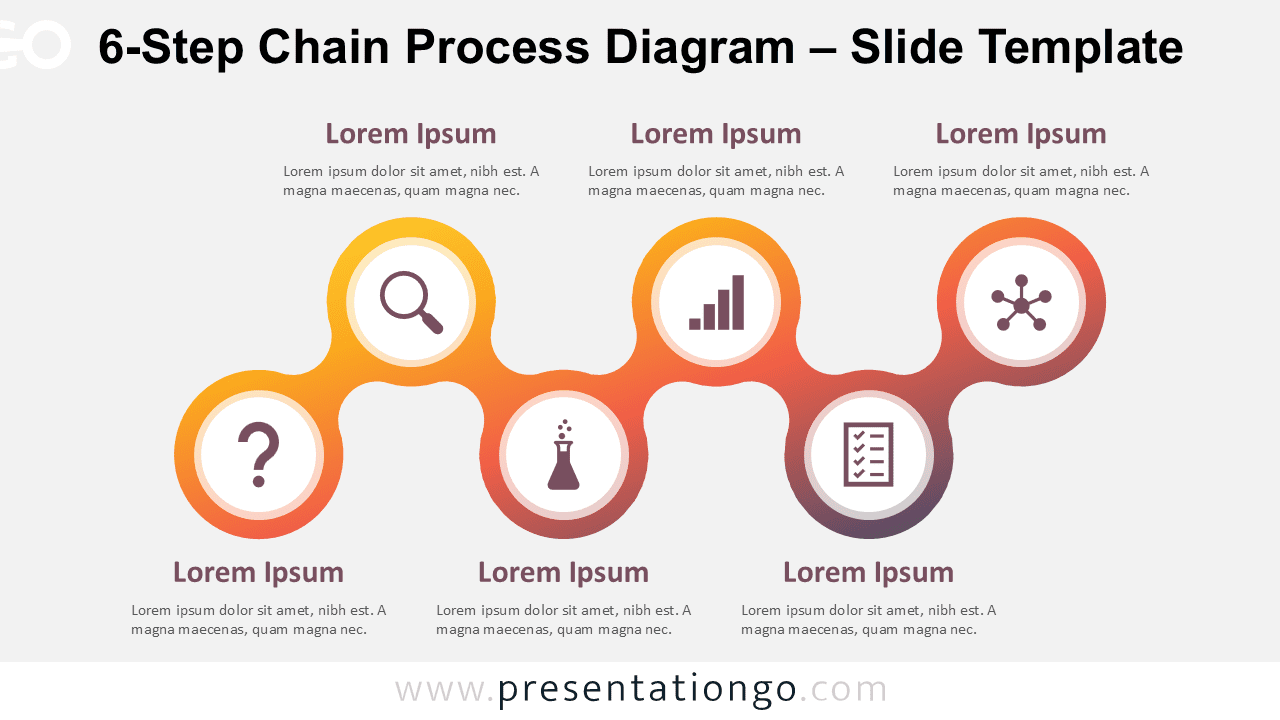
Download this free 6-Step Chain Process Diagram for PowerPoint and Google Slides to clearly illustrate any linear or sequential process.
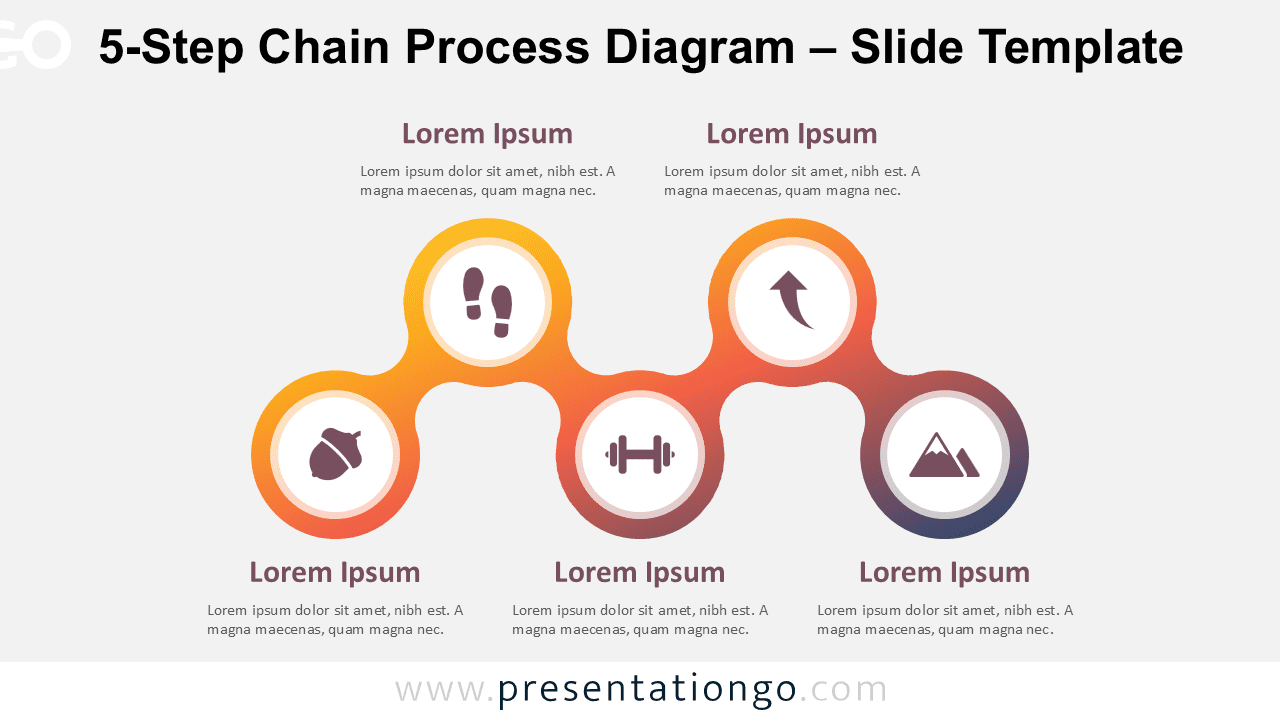
Download this free 5-Step Chain Process Diagram for PowerPoint and Google Slides to present process flows, steps, and linked phases.
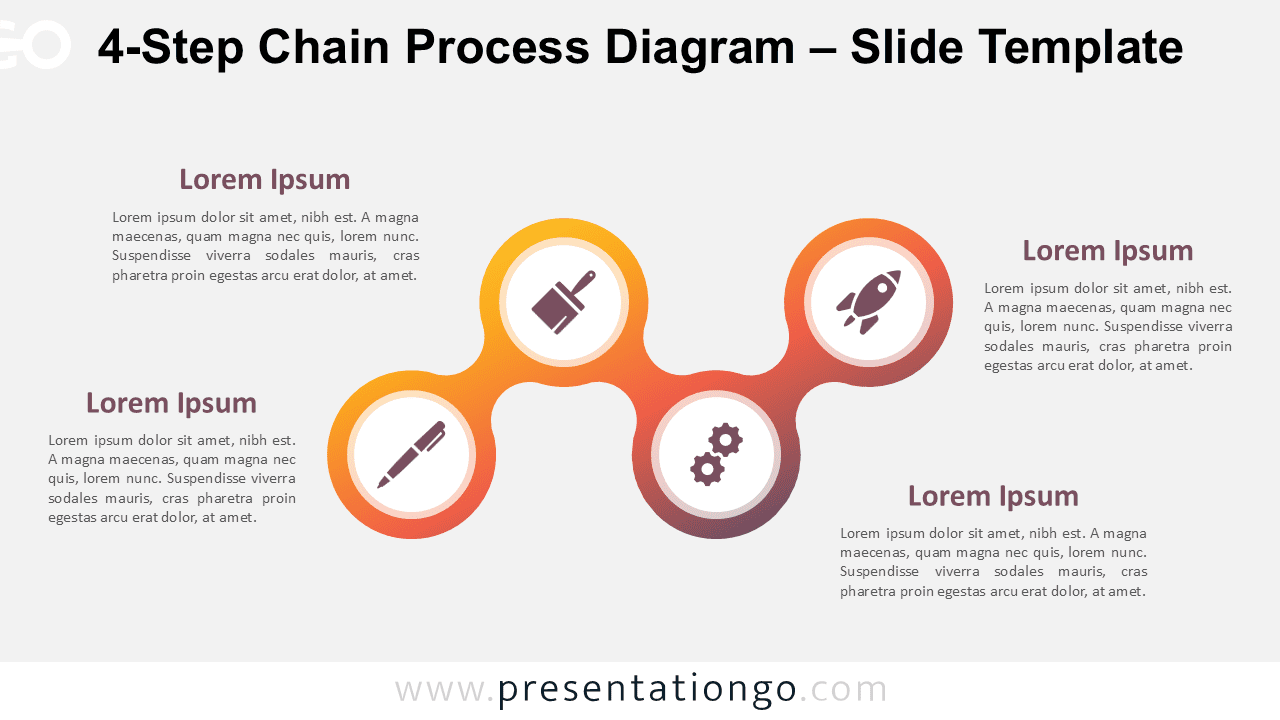
Download this free 4-Step Chain Process Diagram for PowerPoint and Google Slides and simplify your linear process presentations.
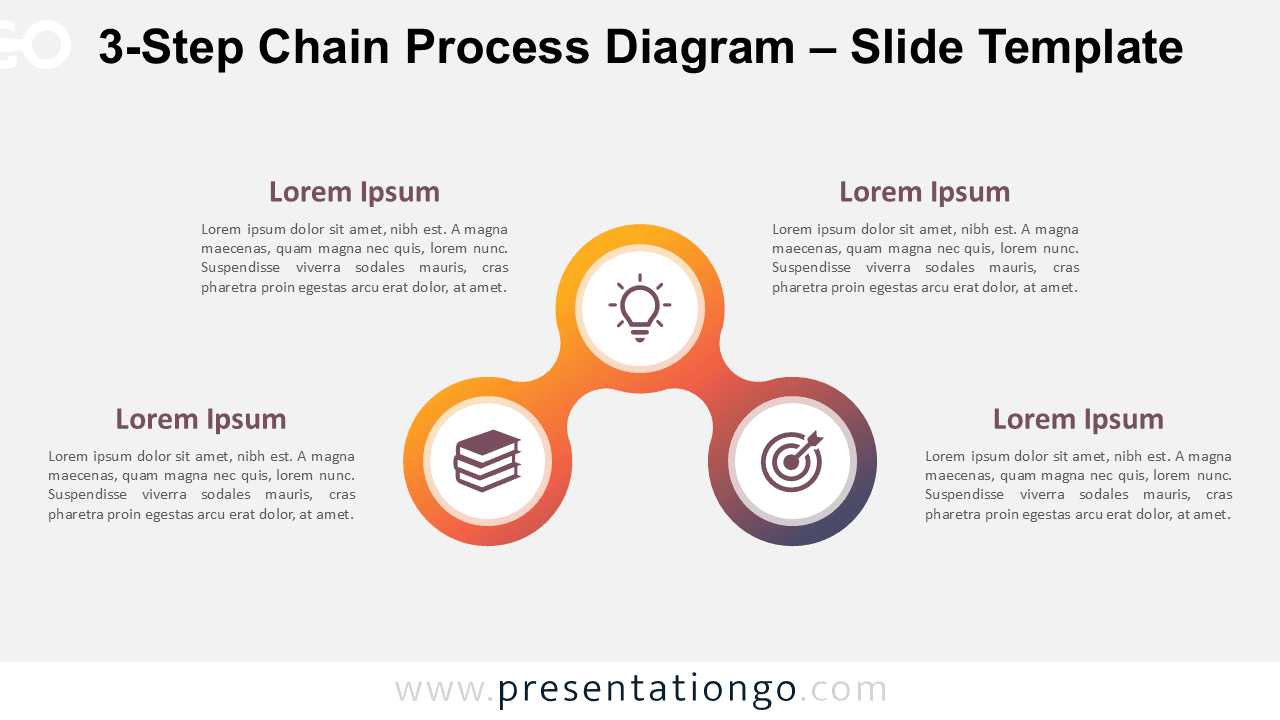
Present 3 clear stages with the 3-Step Chain Process Diagram for PowerPoint and Google Slides using editable chain link shapes.
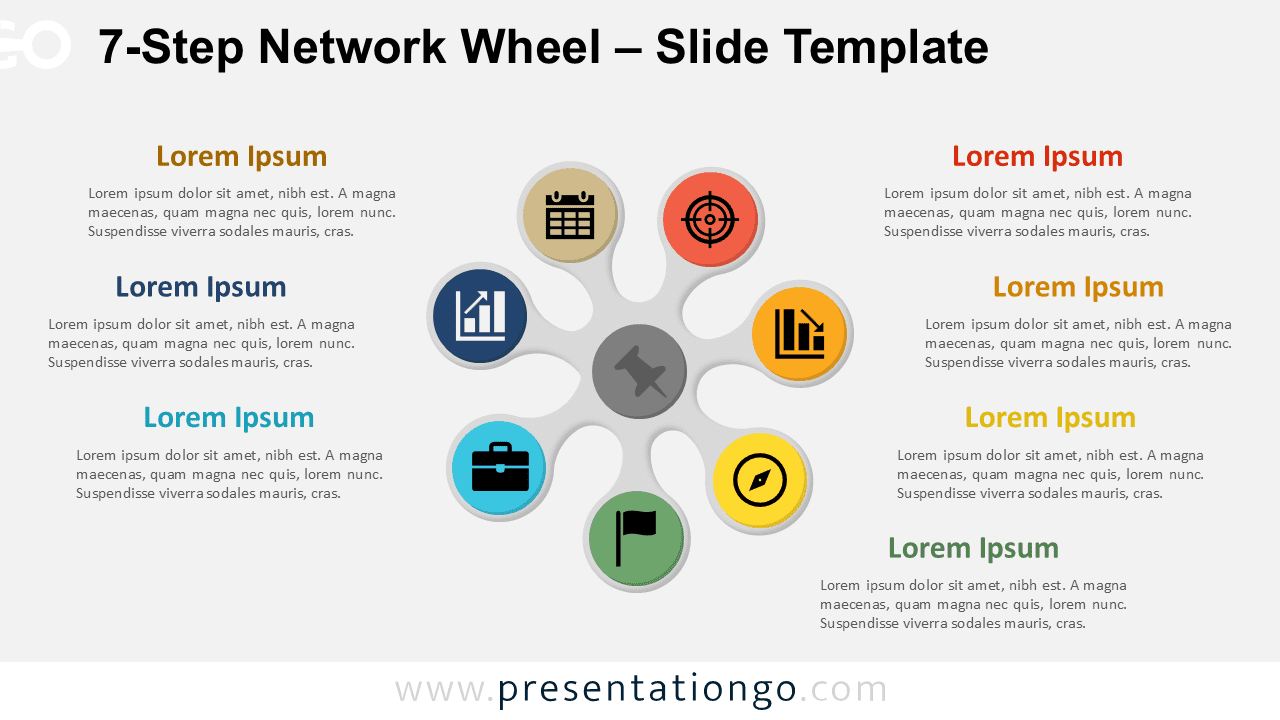
Download the 7-Step Network Wheel, free for PowerPoint and Google Slides, and visualize connected ideas in a circular radial format.
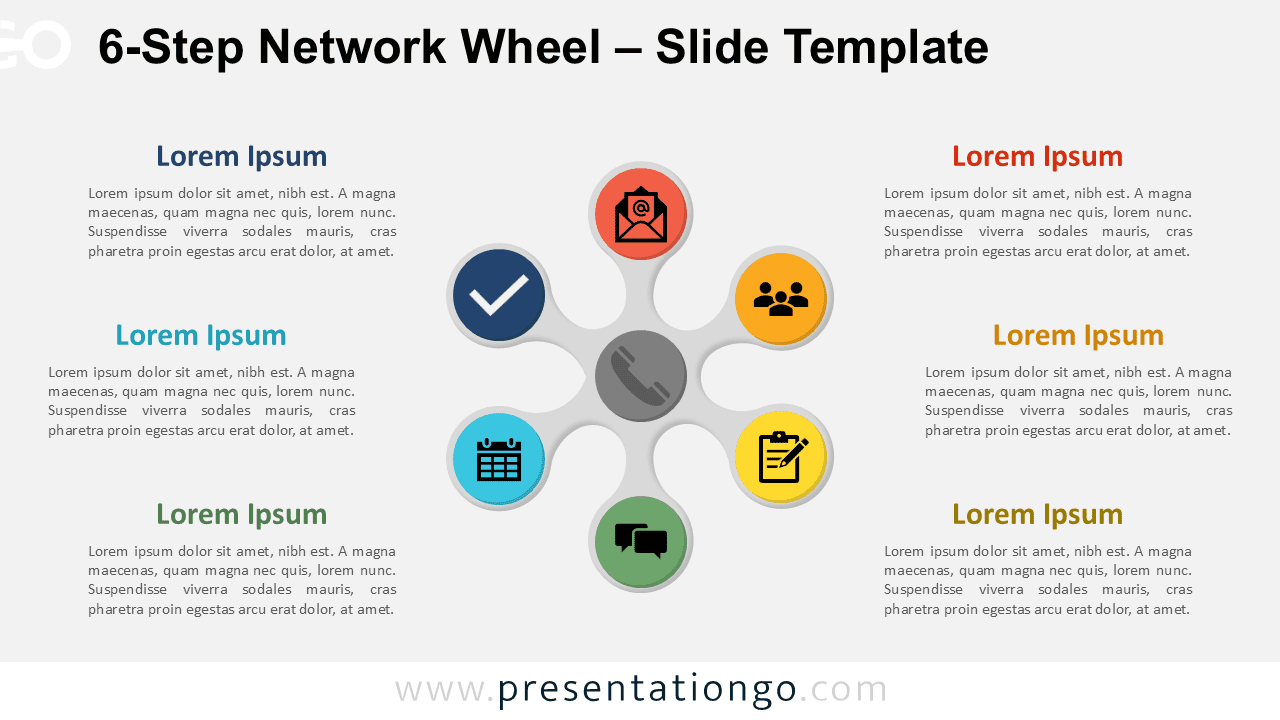
Download the 6-Step Network Wheel for PowerPoint and Google Slides – a radial presentation diagram with six editable parts and icons.
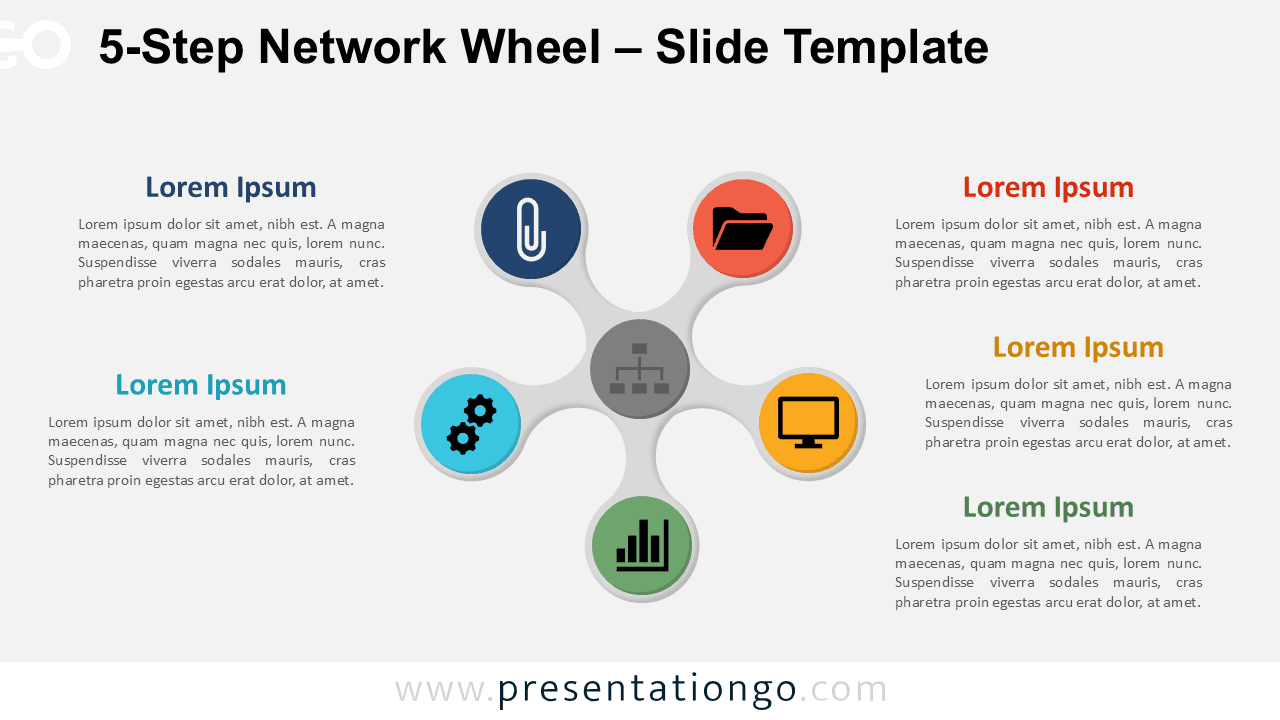
Download the 5-Step Network Wheel for PowerPoint and Google Slides to display one central concept and five surrounding nodes.
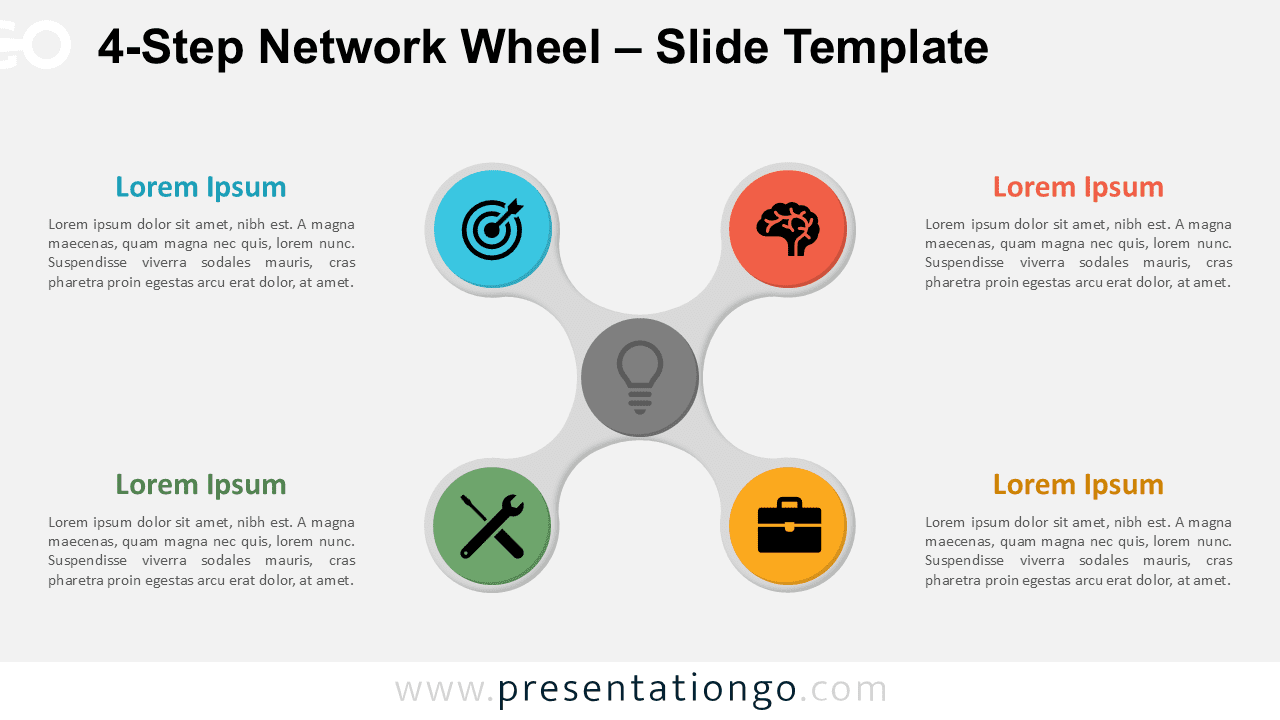
Download this 4-Step Network Wheel template for PowerPoint and Google Slides to present connected components in a radial format.
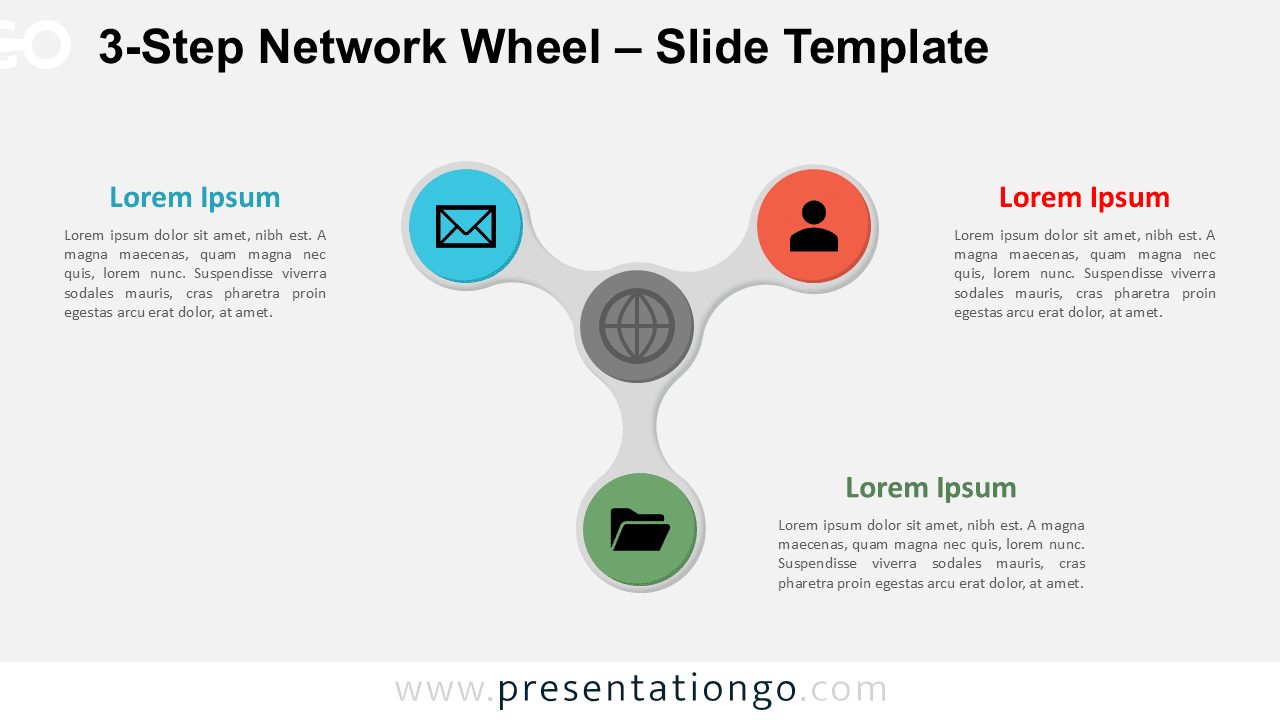
Download the 3-Step Network Wheel for PowerPoint and Google Slides—ideal for visualizing triadic processes or interconnected roles.
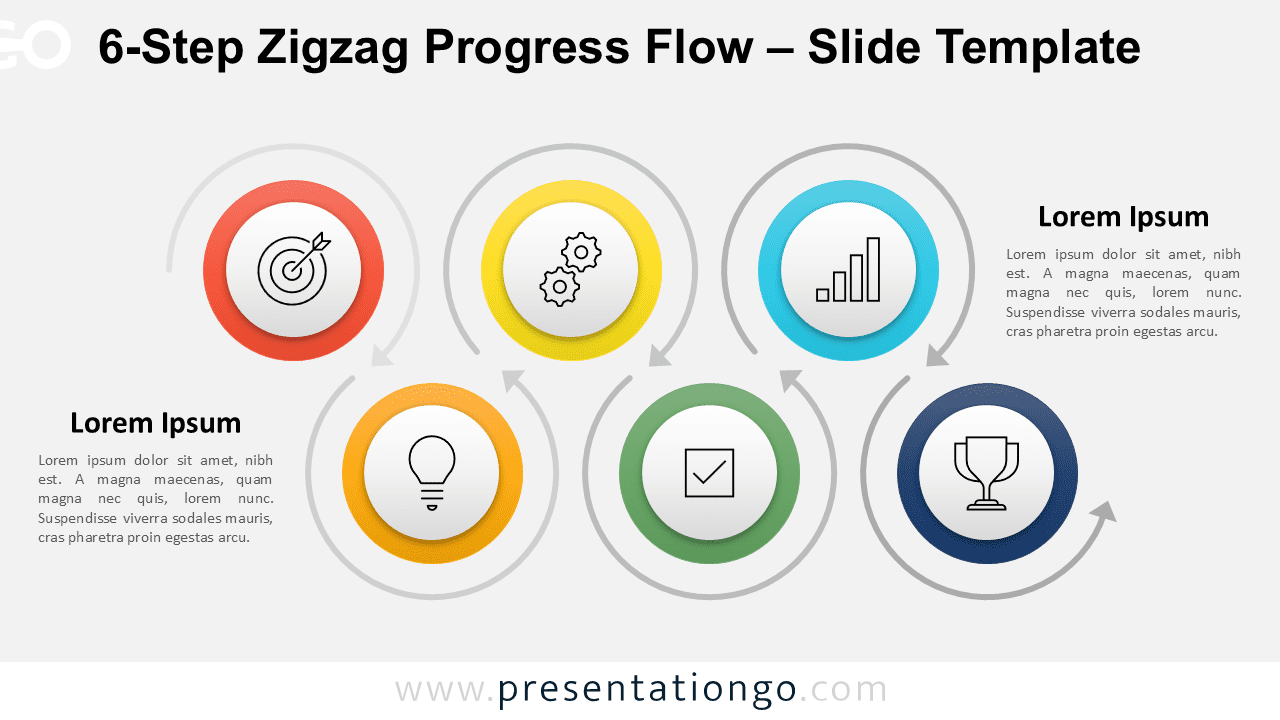
Download this 6-step zigzag template for PowerPoint and Google Slides—ideal for showing linear processes using icons and curved arrows.
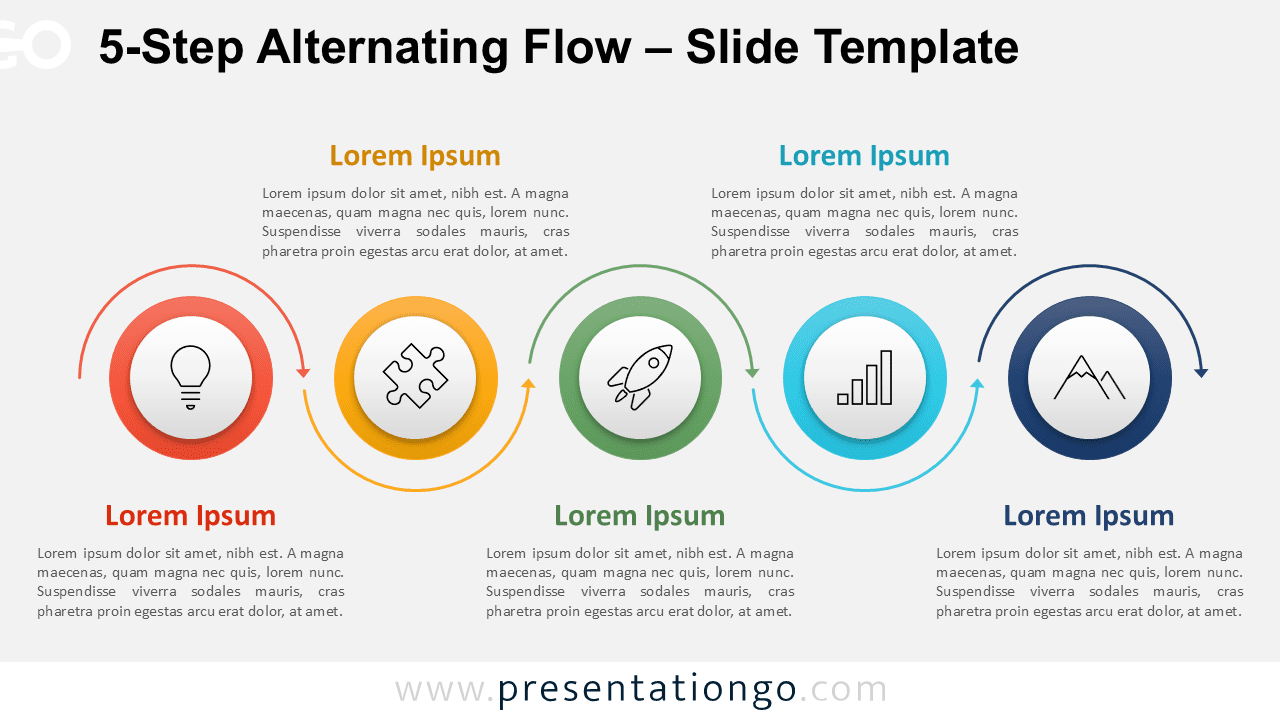
Download this free PowerPoint and Google Slides diagram: the 5-Step Alternating Flow helps visualize workflows in a dynamic layout.
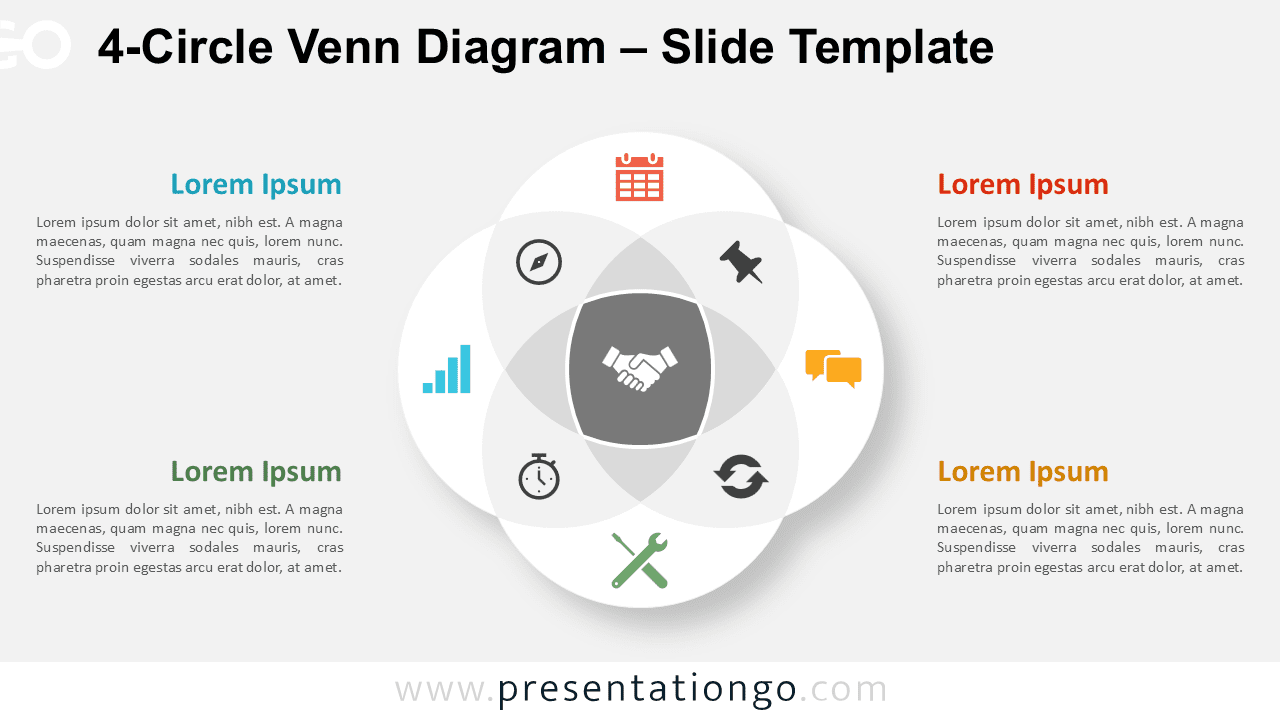
Download the 4-Circle Venn Diagram for PowerPoint and Google Slides to visualize complex relationships across overlapping categories and elements.
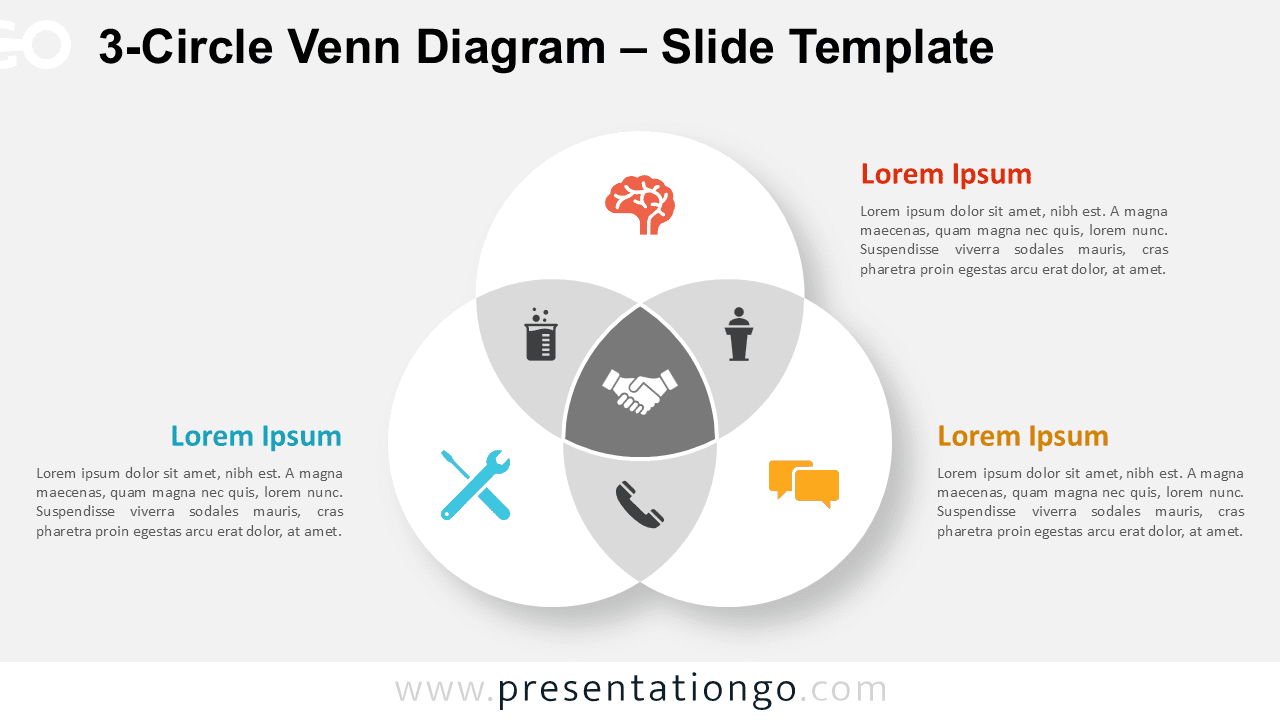
Download the 3-Circle Venn Diagram for PowerPoint and Google Slides to explain overlaps and concepts with clear, customizable visuals.
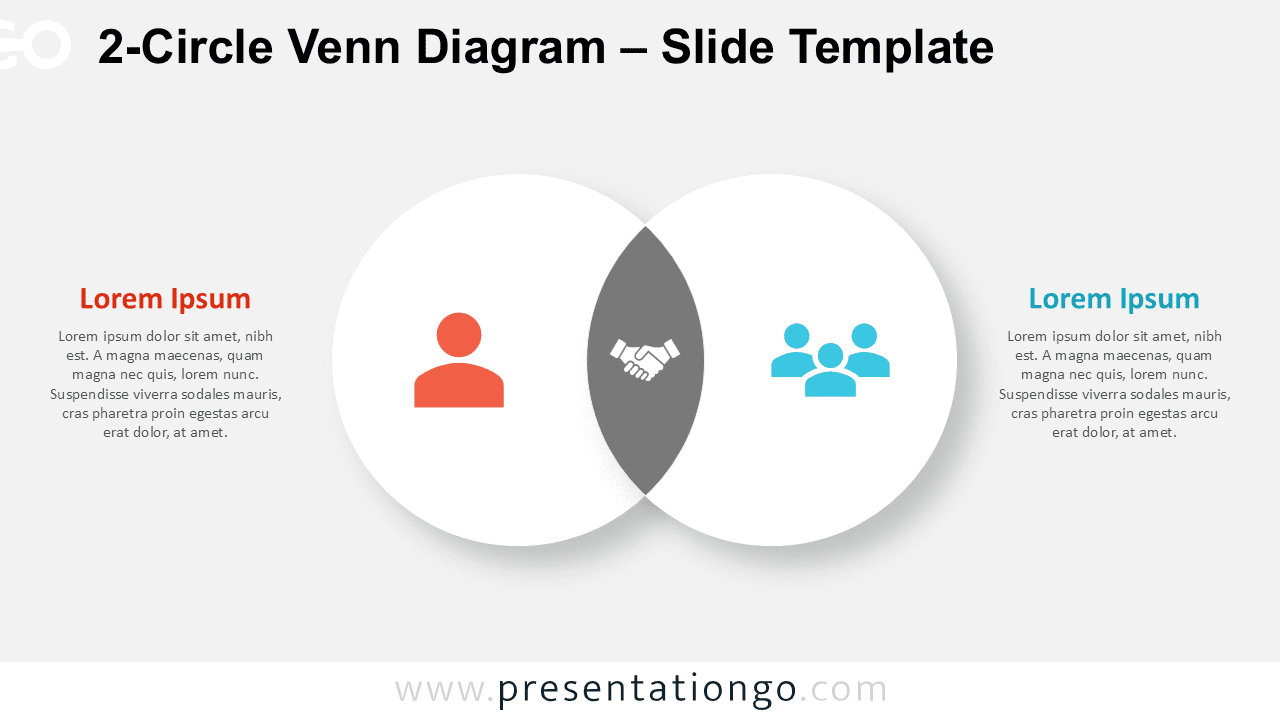
Download the 2-Circle Venn Diagram for PowerPoint and Google Slides to compare ideas and show shared values. Free, editable, and clear.
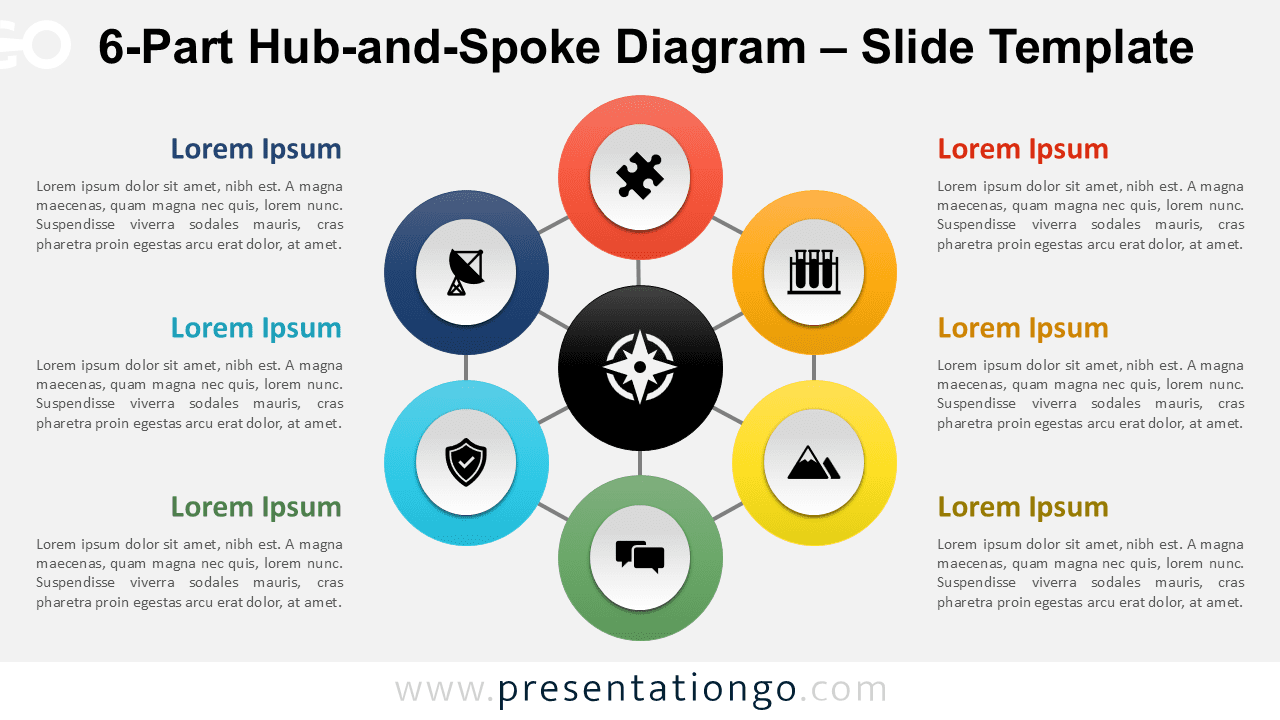
Download the 6-Part Hub-and-Spoke Diagram for PowerPoint and Google Slides to showcase centralized systems with six connected components.
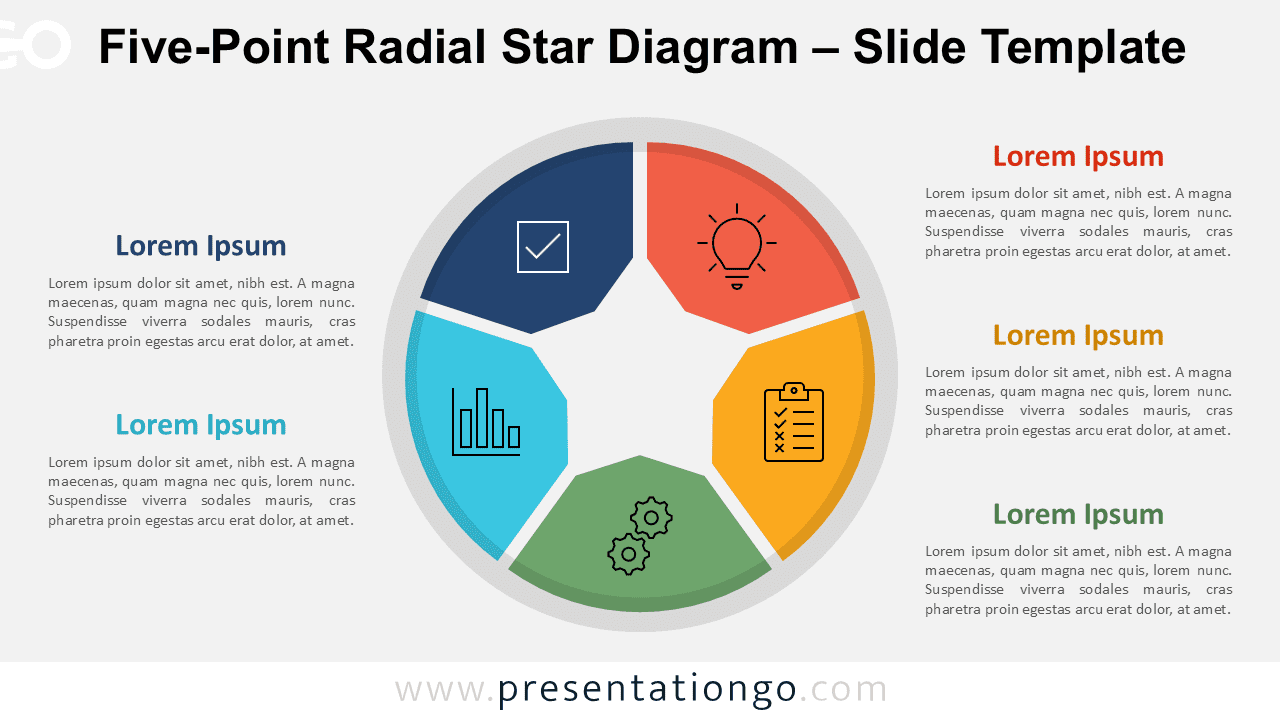
Download a free Five-Point Radial Star Diagram for PowerPoint and Google Slides—perfect for concepts built around a core theme.
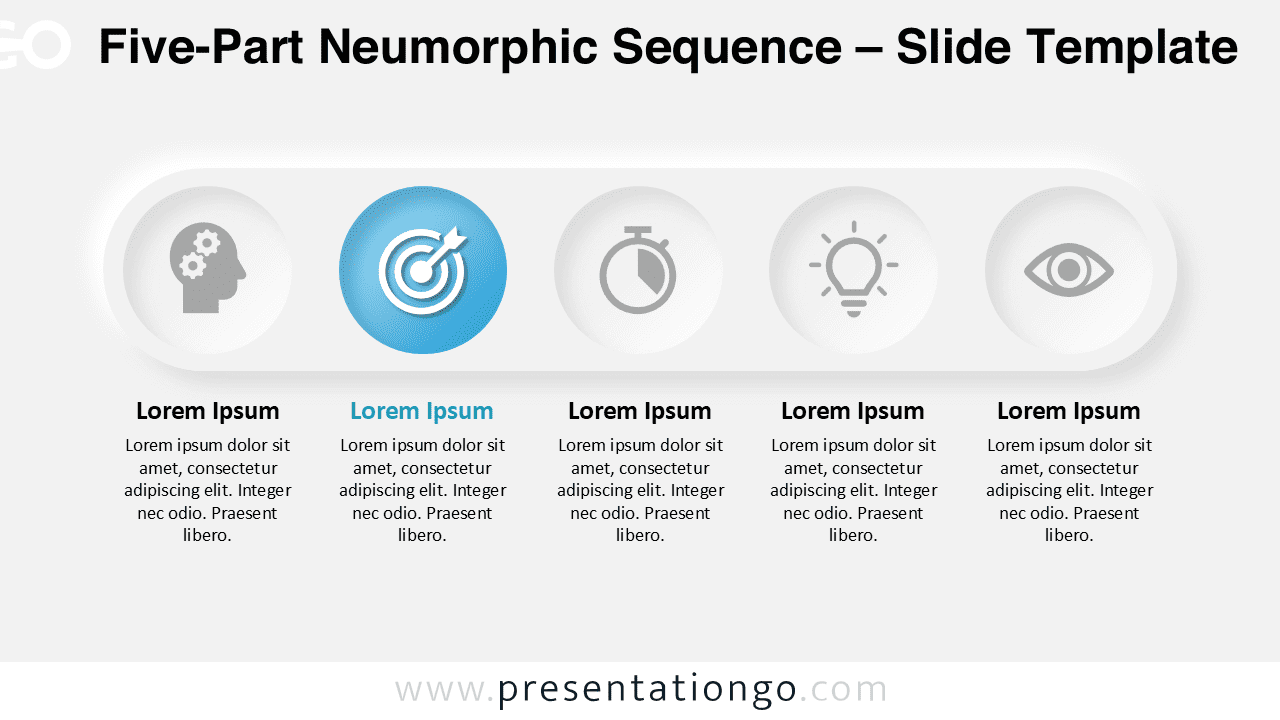
Download this Five-Part Neumorphic Sequence for PowerPoint and Google Slides and emphasize five steps or stages with neumorphic design.
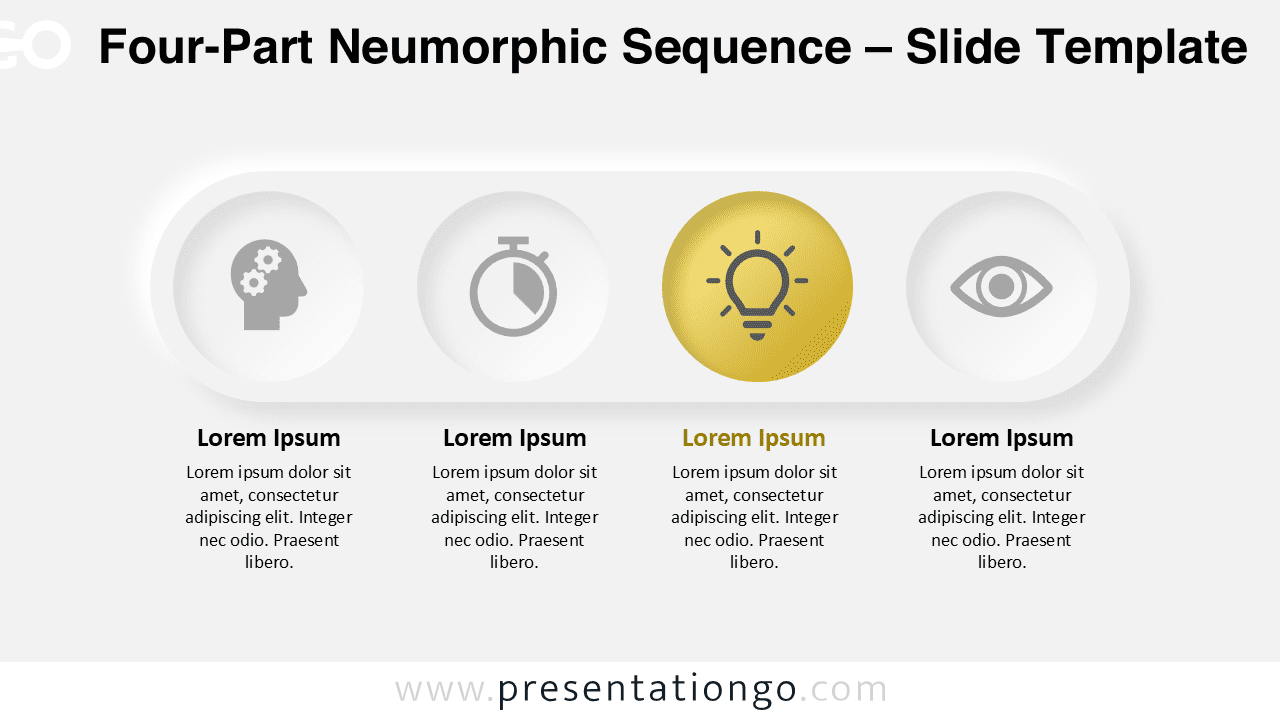
The Four-Part Neumorphic Sequence for PowerPoint and Google Slides offers a clean 4-step layout with tactile design and editable icons.
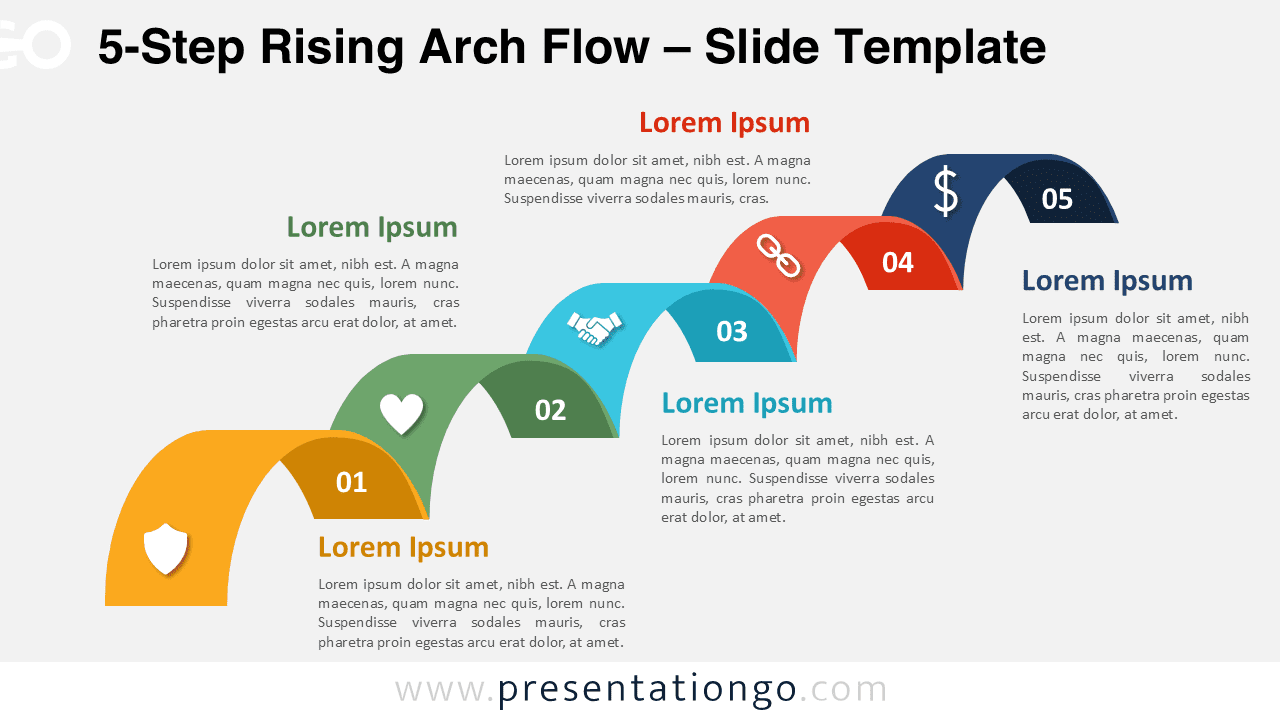
Download the 5-Step Rising Arch Flow for PowerPoint and Google Slides, a free diagram to present workflows and progressive steps.
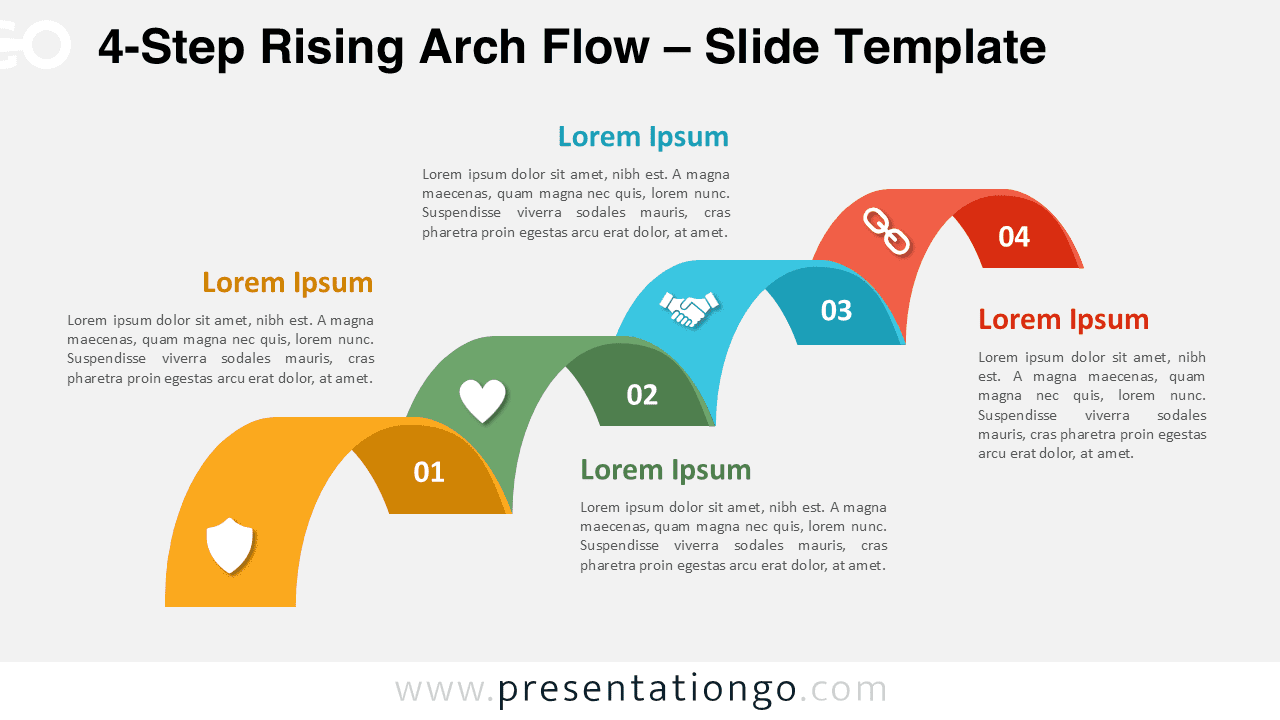
Download this 4-Step Rising Arch Flow for PowerPoint and Google Slides to illustrate growth, rising processes, and directional strategies.