Loading resources…
Total 1760 resources
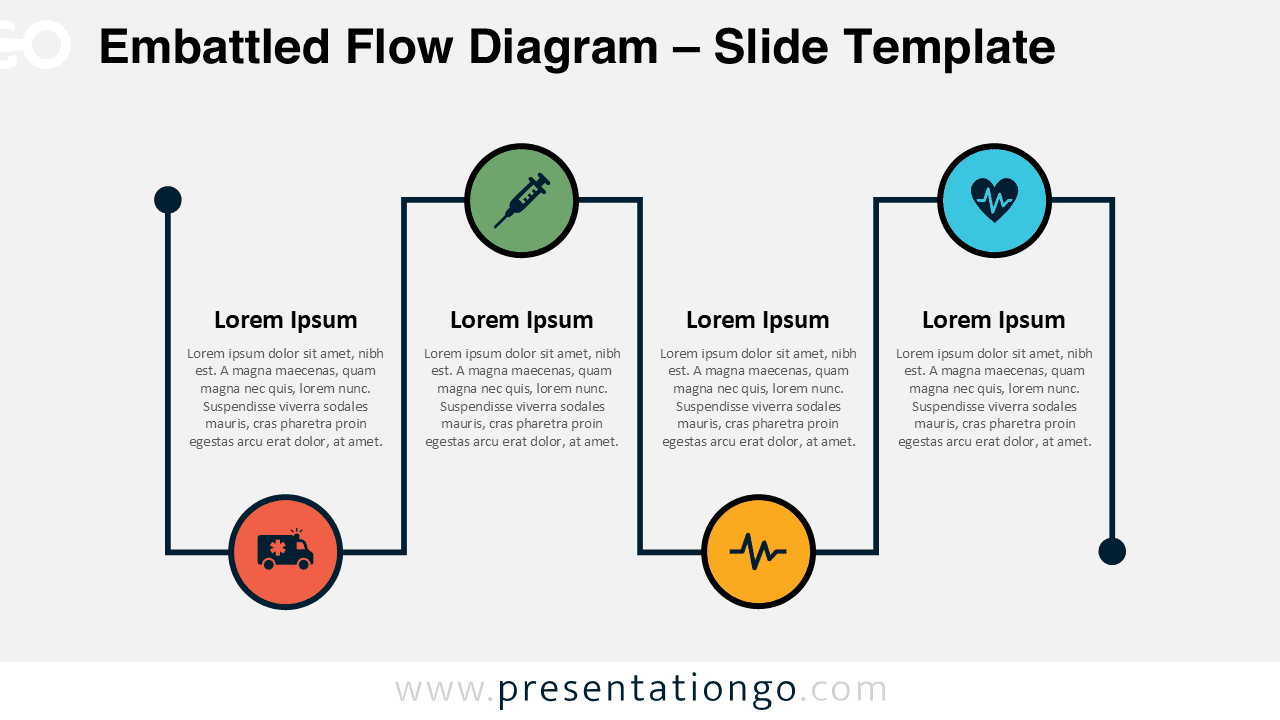
Download the Embattled Flow Diagram for PowerPoint and Google Slides, a four-step alternating design for clear process visualization.
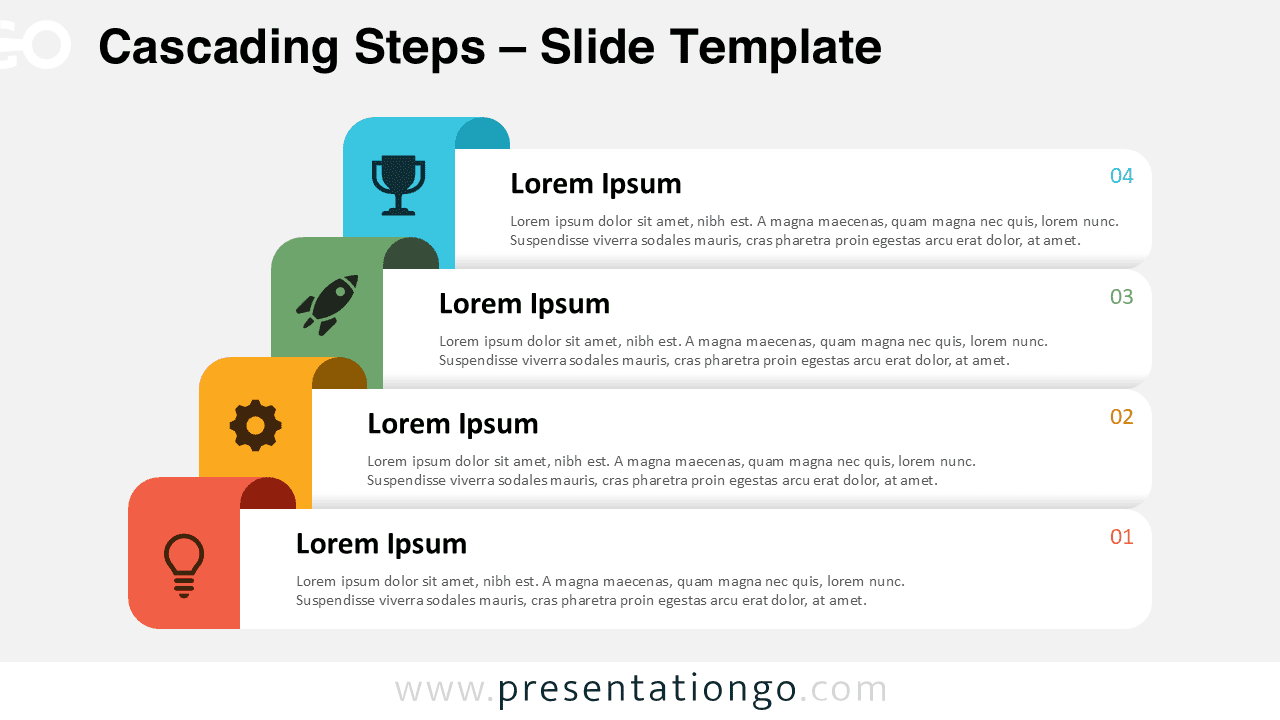
Illustrate sequential processes with the Cascading Steps diagram for PowerPoint and Google Slides. Features 4 customizable steps.
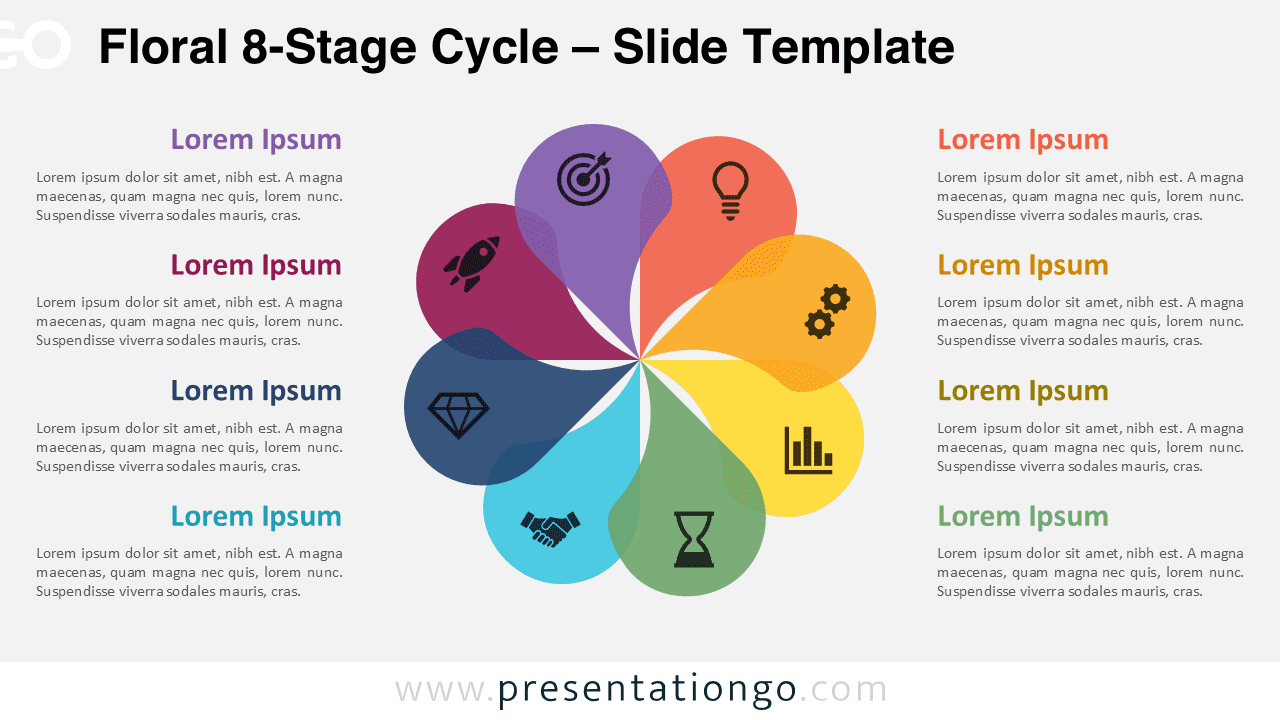
Present processes with the Floral 8-Stage Cycle for PowerPoint & Google Slides—an 8-step infographic for seamless visual storytelling.
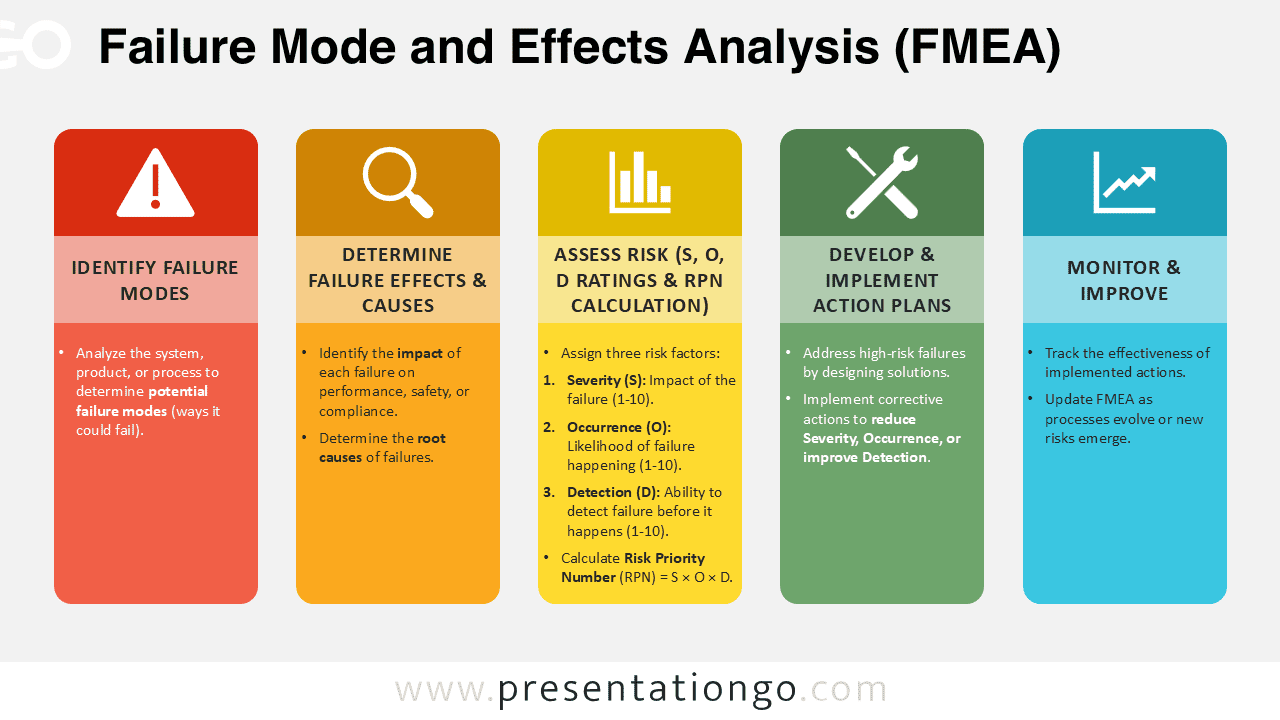
The Failure Mode and Effects Analysis (FMEA) template for PowerPoint & Google Slides features 4 layouts to analyze risks and workflows.
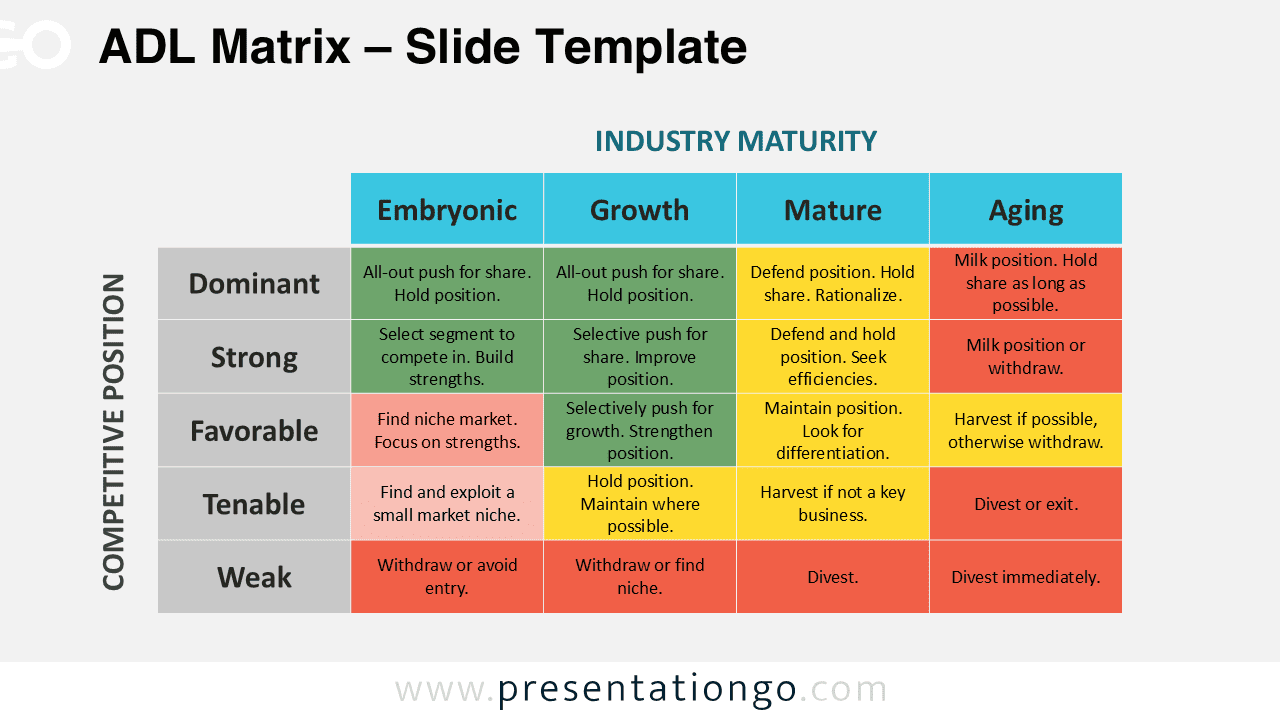
Download the ADL Matrix for PowerPoint & Google Slides - a dual-layout template for mapping competitive position and industry maturity.
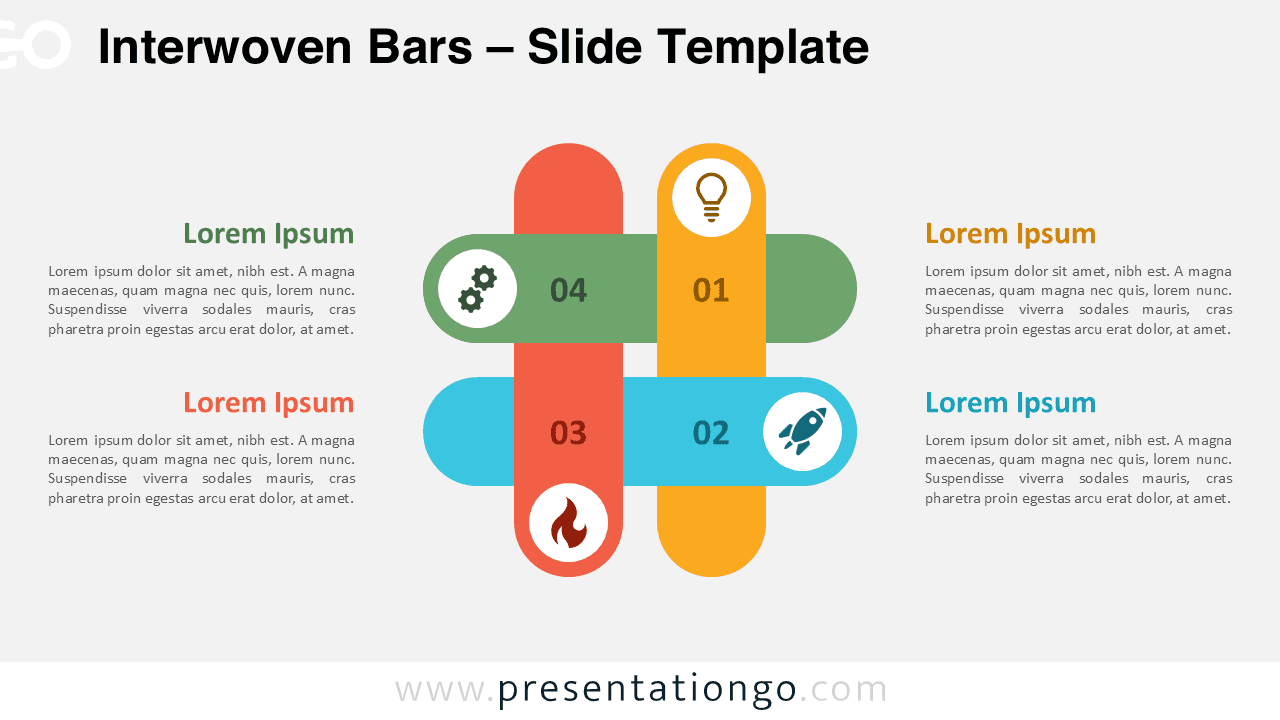
Download the Interwoven Bars template for PowerPoint and Google Slides to showcase processes and relationships in a 4-step diagram.
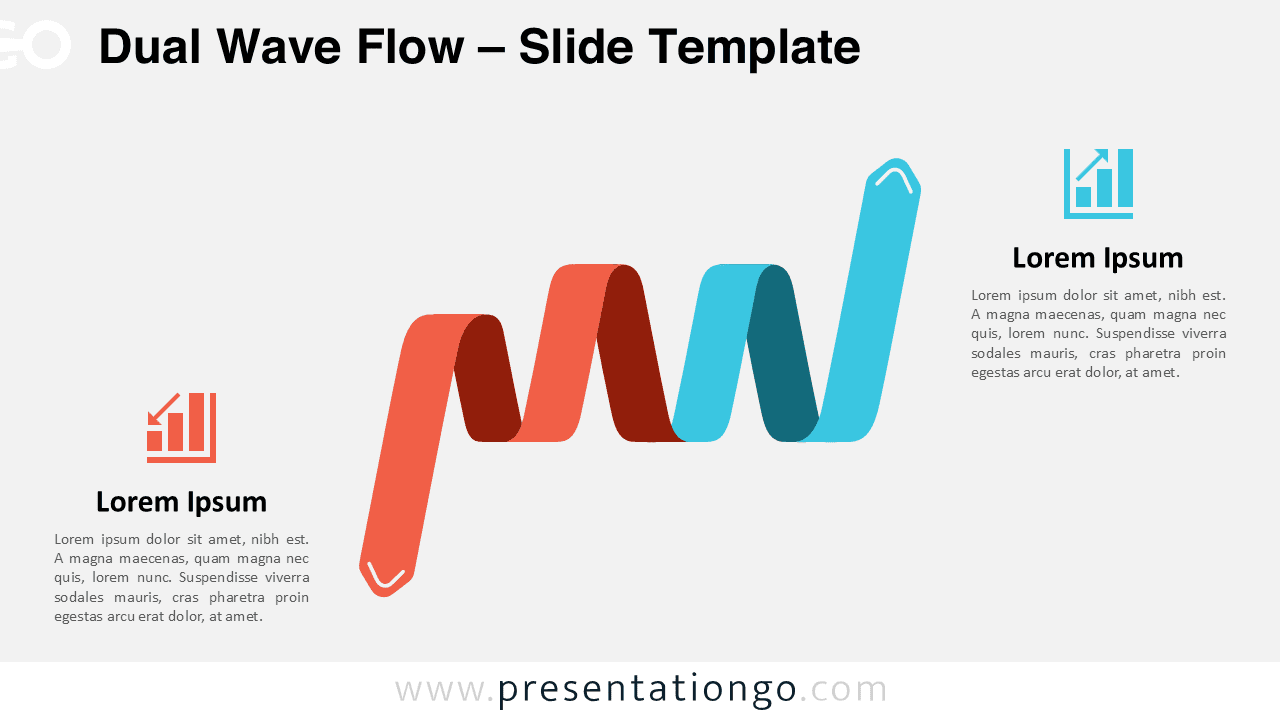
Download the Dual Wave Flow template for PowerPoint & Google Slides to illustrate dual concepts, workflows, or comparisons with ease.
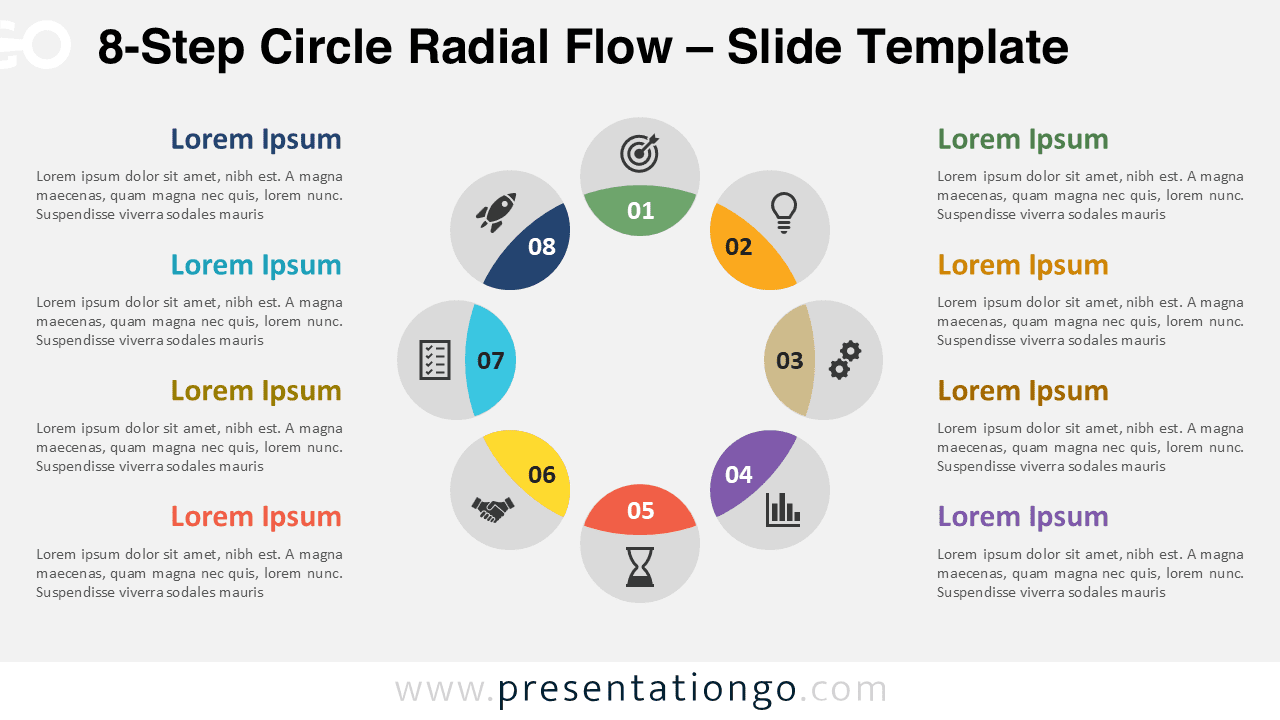
Download this 8-Step Radial Flow template for PowerPoint and Google Slides. Ideal for illustrating workflows or connected processes.
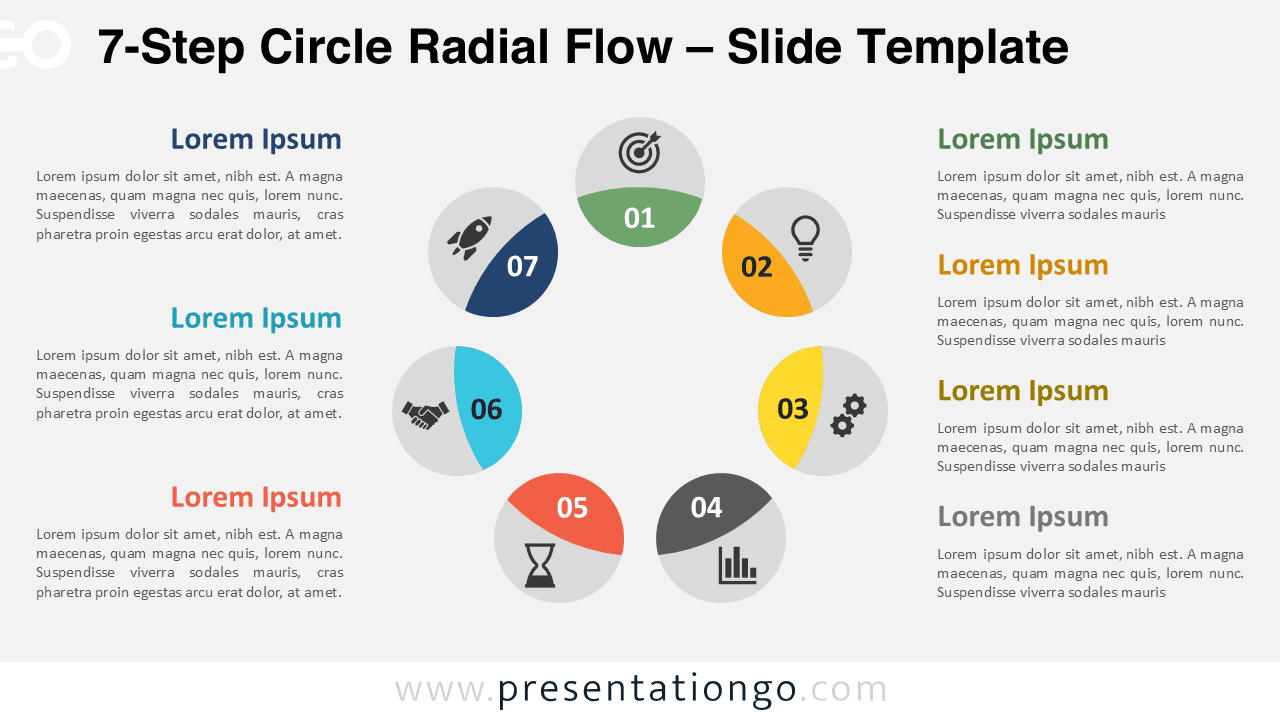
Download the 7-Step Circle Radial Flow for PowerPoint and Google Slides. Ideal for illustrating seven-step processes and workflows.
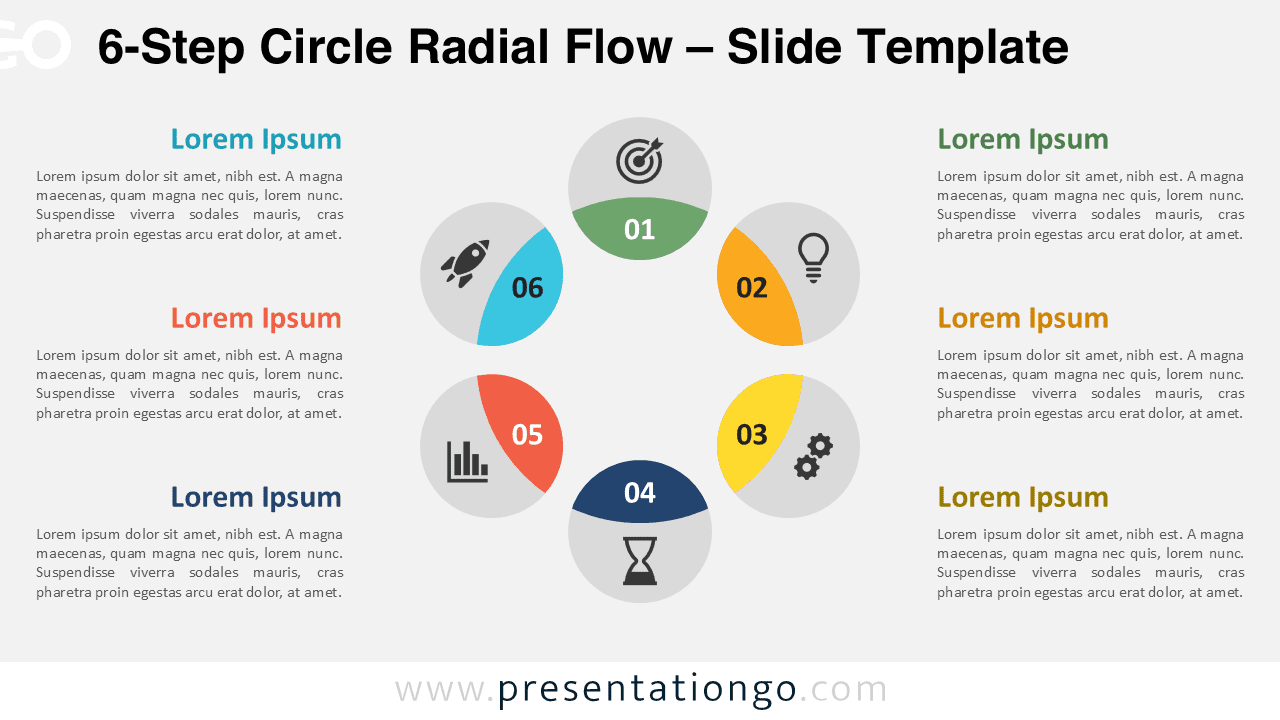
Download the 6-Step Circle Radial Flow for PowerPoint & Google Slides. Perfect for showcasing sequential or cyclical processes.
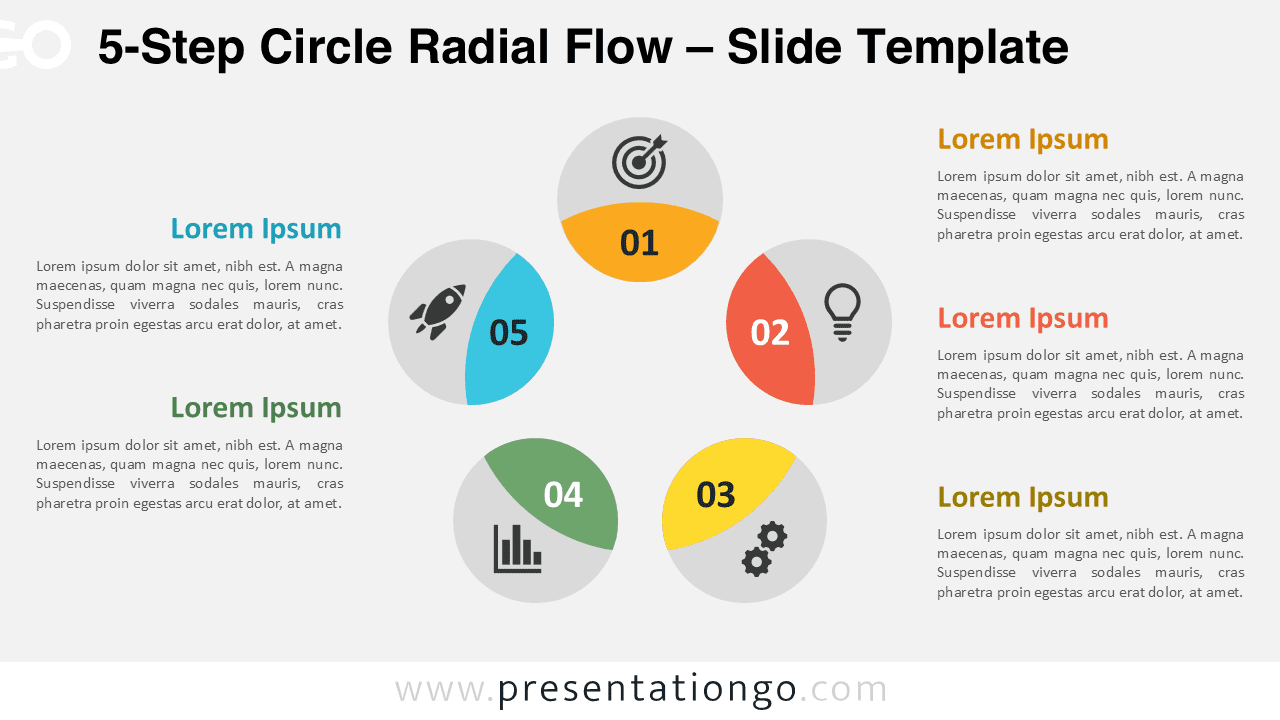
Download this 5-Step Circle Radial Flow for PowerPoint & Google Slides. Perfect for illustrating processes, sequences, and workflows.
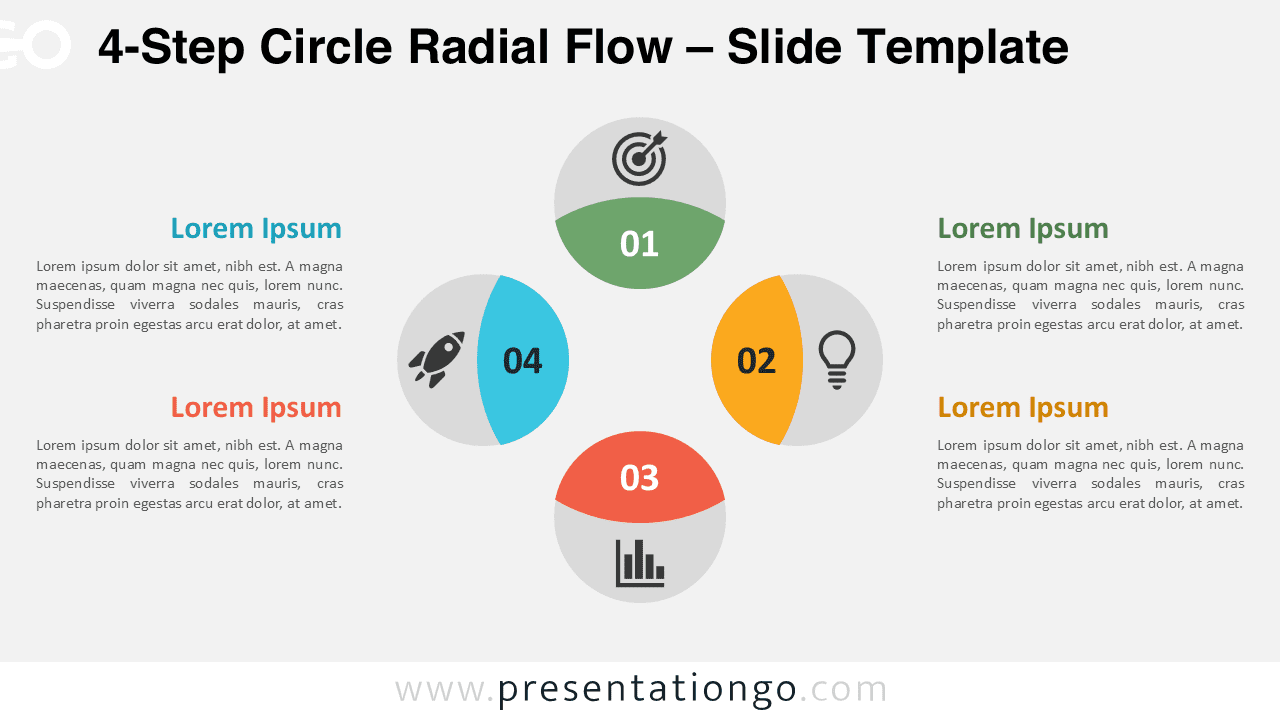
Download the 4-Step Circle Radial Flow template for PowerPoint & Google Slides. Perfect for workflows, processes, and cyclical diagrams!
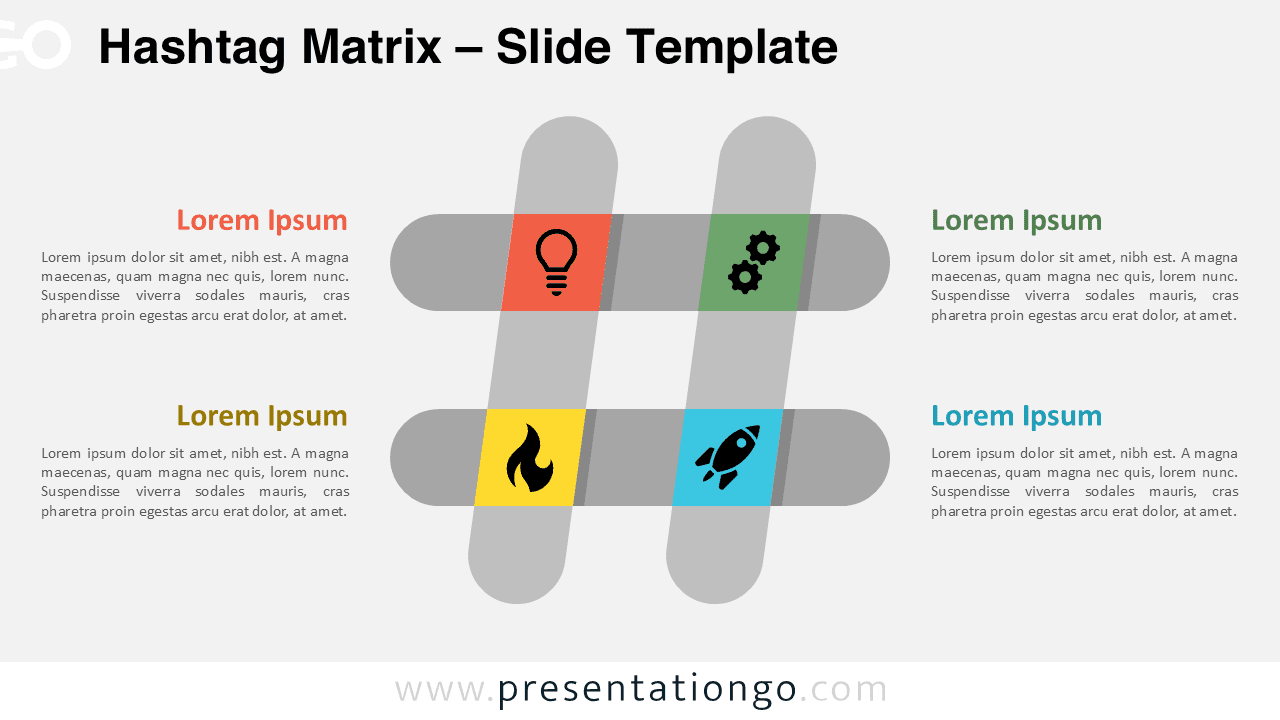
The Hashtag Matrix template for PowerPoint and Google Slides offers a four-quadrant design perfect for presenting interconnected concepts.
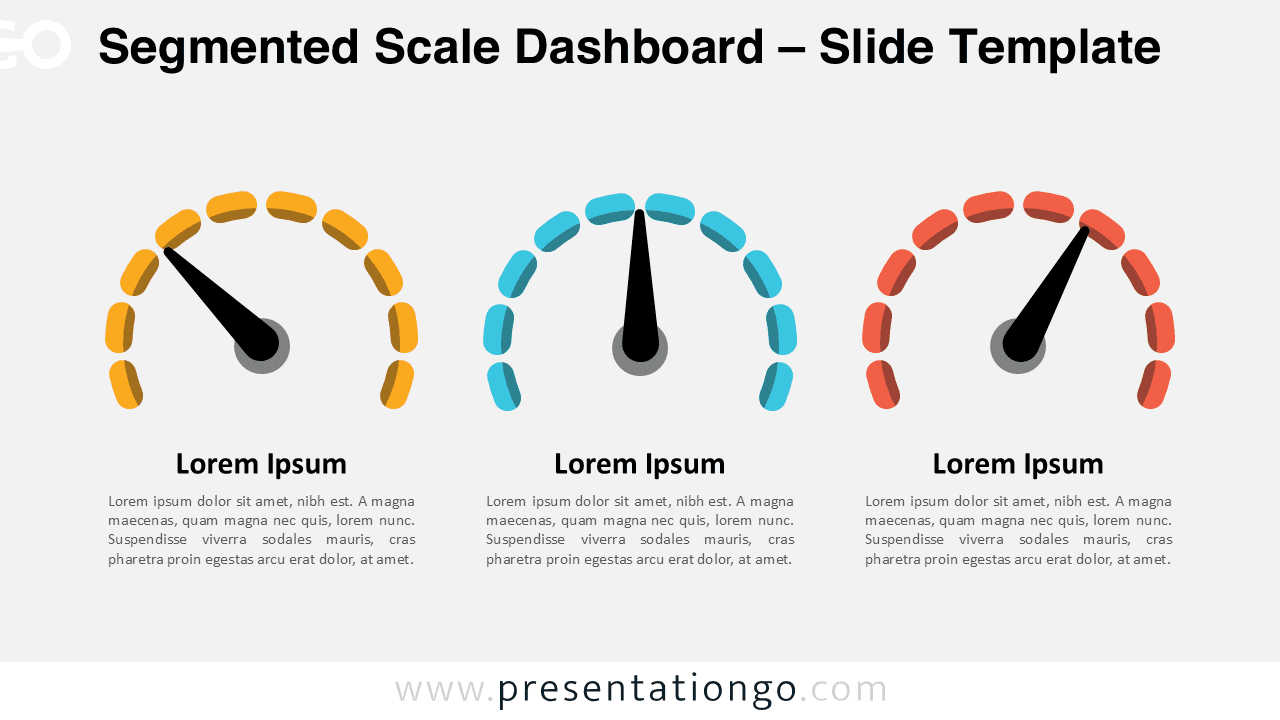
Present your KPIs effectively using the Segmented Scale Dashboard for PowerPoint and Google Slides with three customizable gauges.
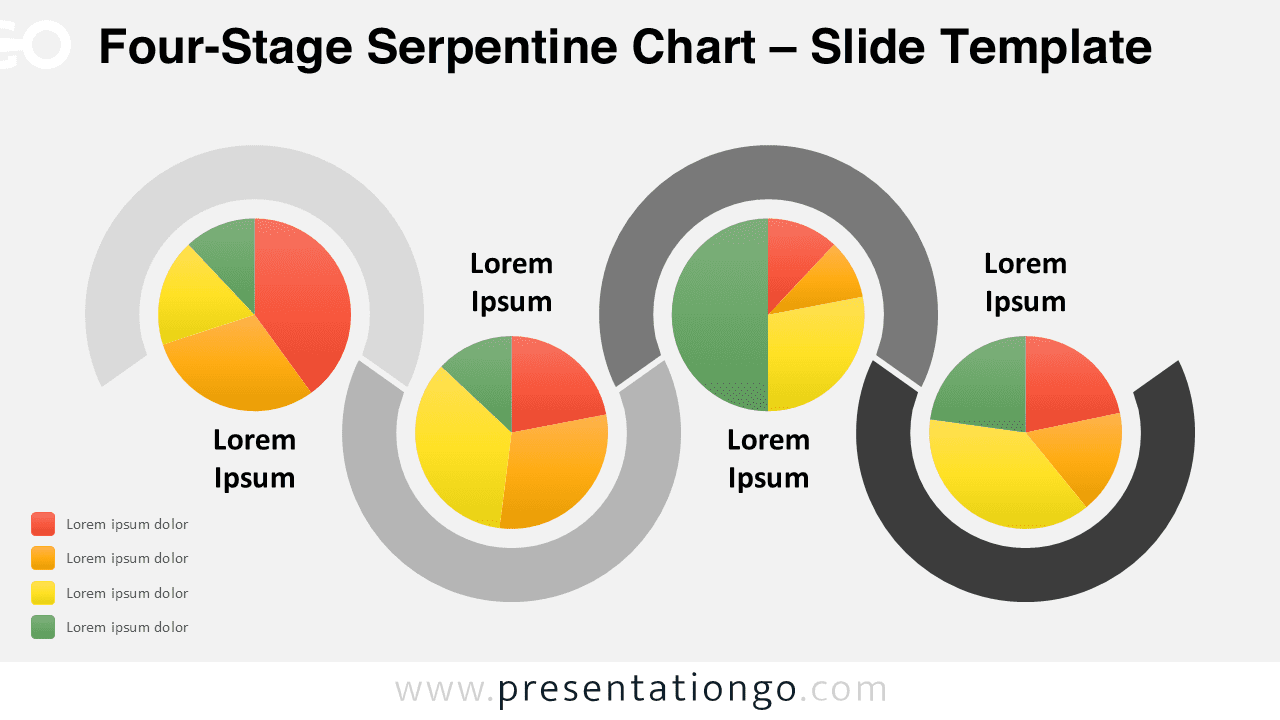
Show four-step workflows with this serpentine chart template, fully editable for PowerPoint and Google Slides. Download now!
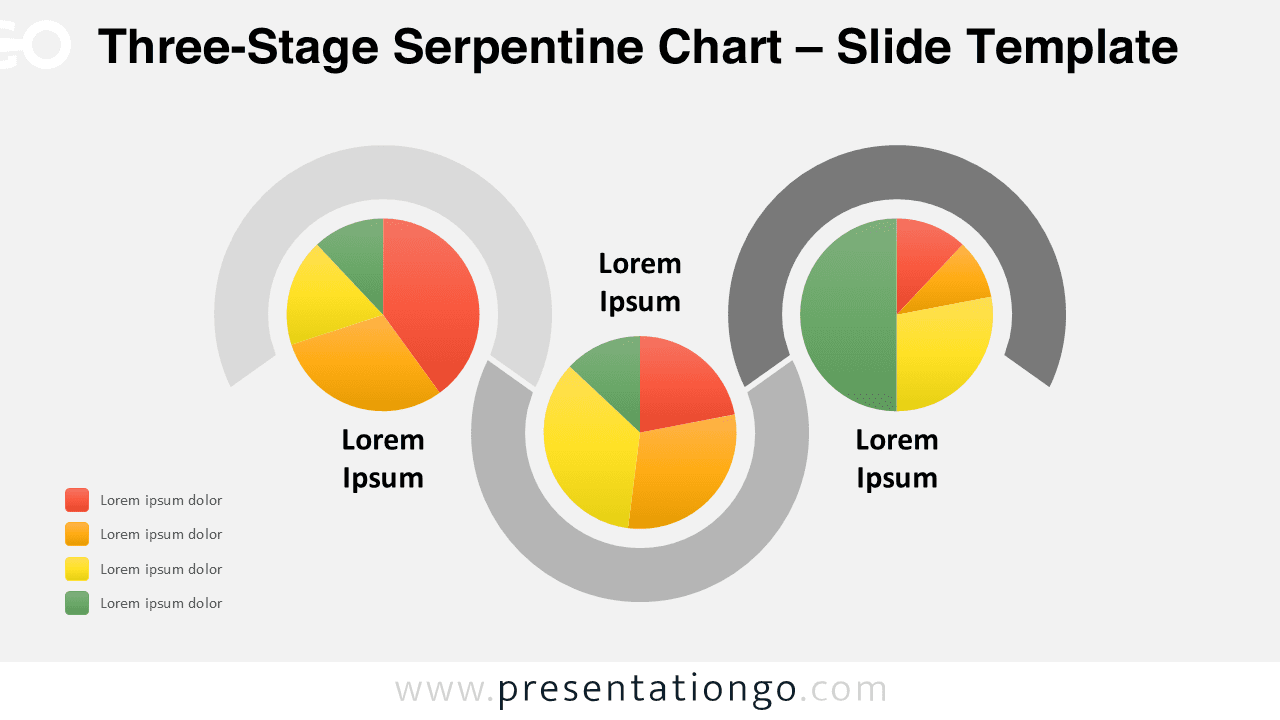
Download the free Three-Stage Serpentine Chart for PowerPoint and Google Slides to illustrate processes and workflows with pie charts.
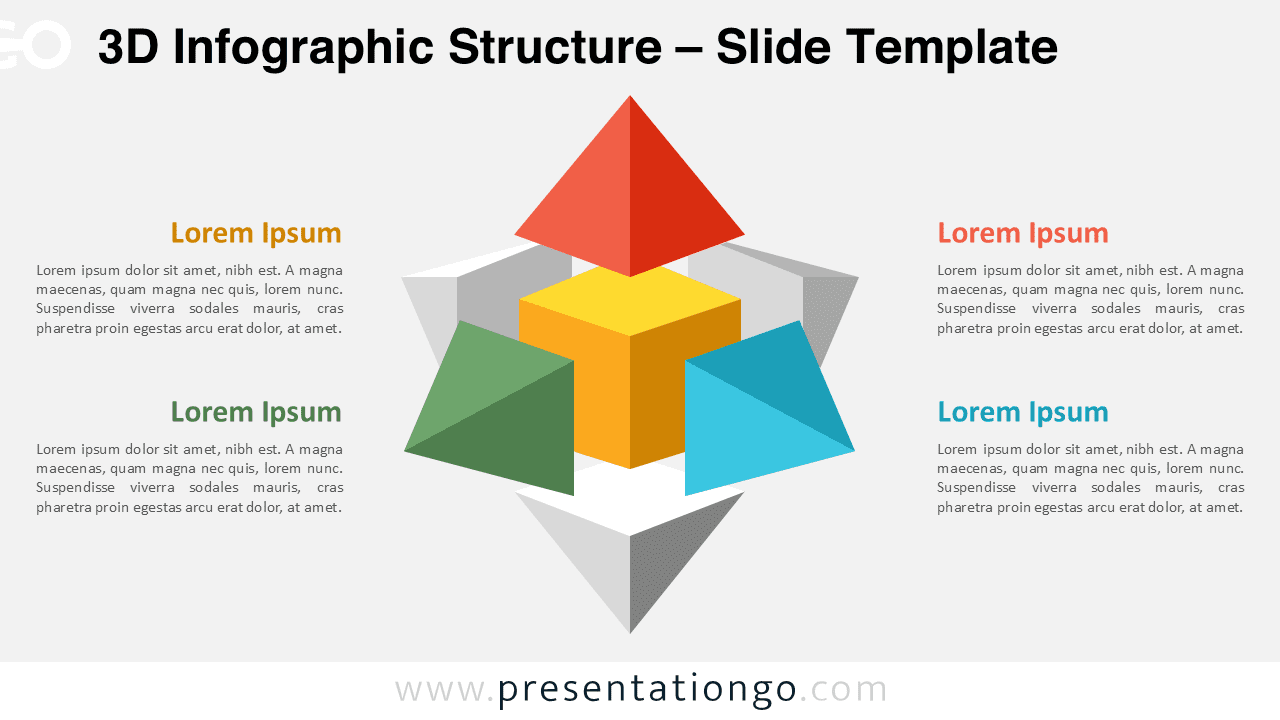
Download the 3D Infographic Structure for PowerPoint and Google Slides. Perfect for showcasing processes, relationships, and workflows.
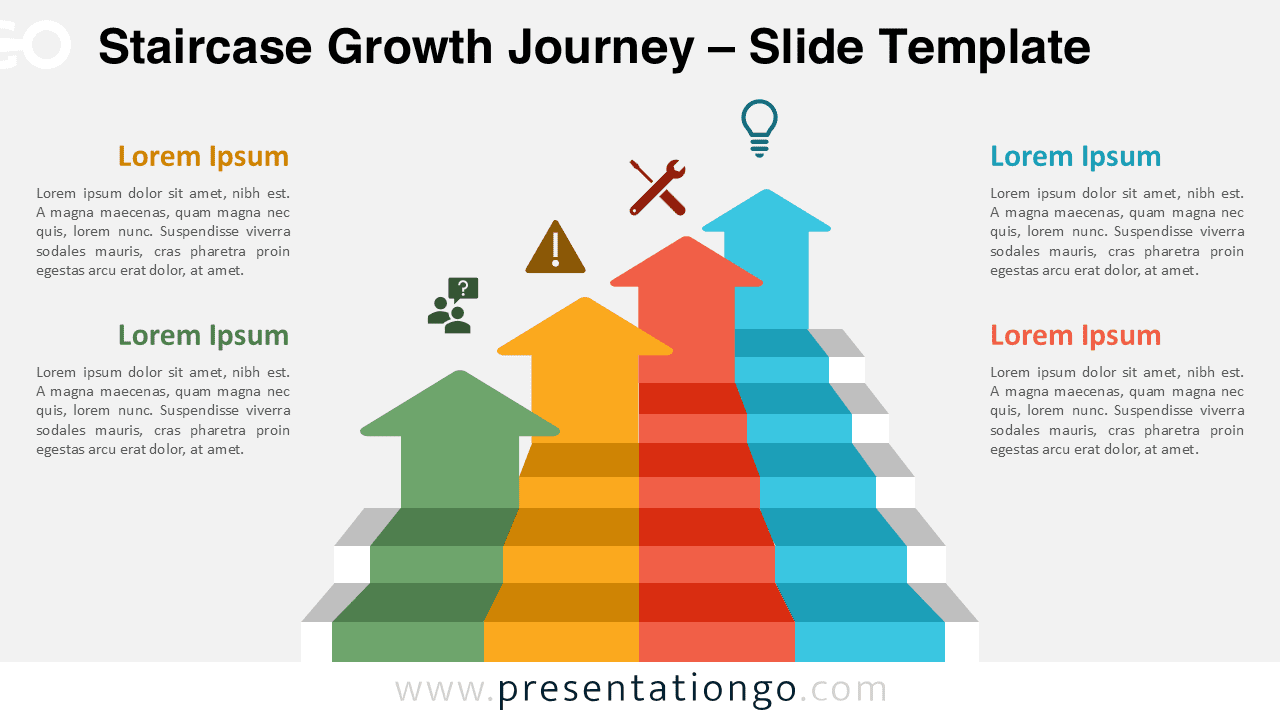
Download our professional Staircase Growth Journey for PowerPoint & Google Slides. Features 4 dynamic progression steps.
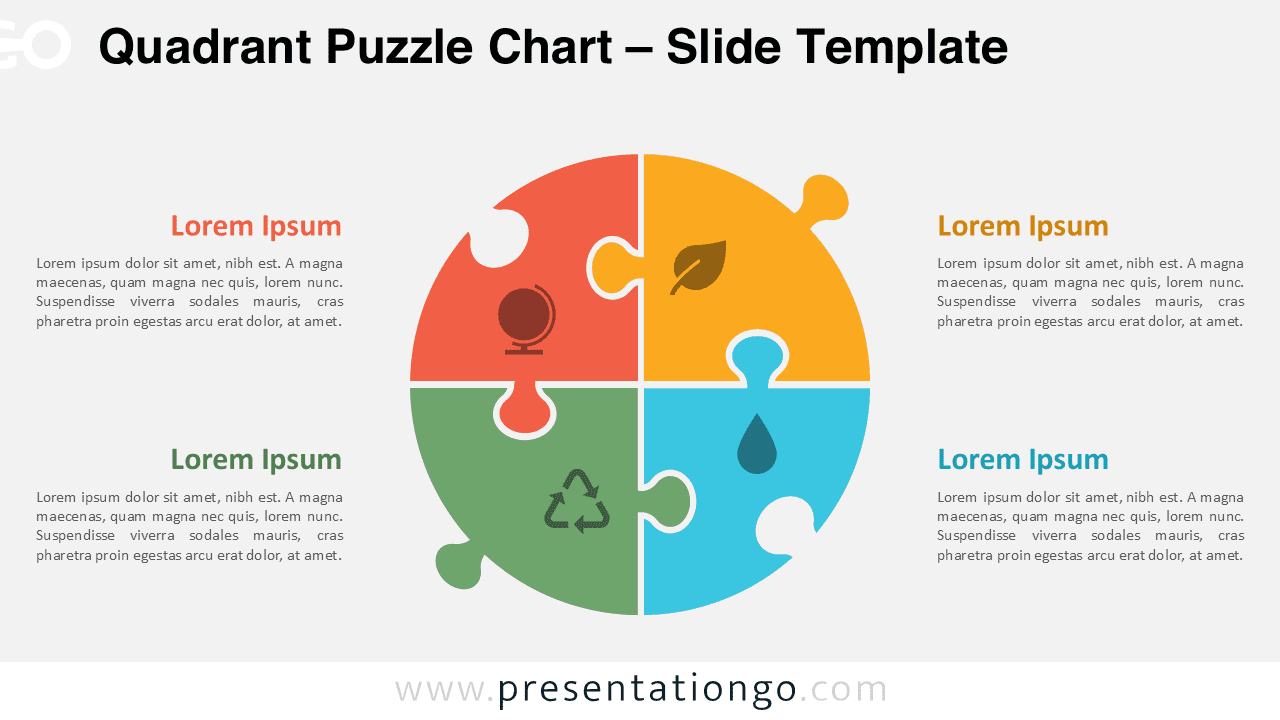
Download the Quadrant Puzzle Chart for PowerPoint & Google Slides – a customizable 4-part infographic to showcase processes or ideas.
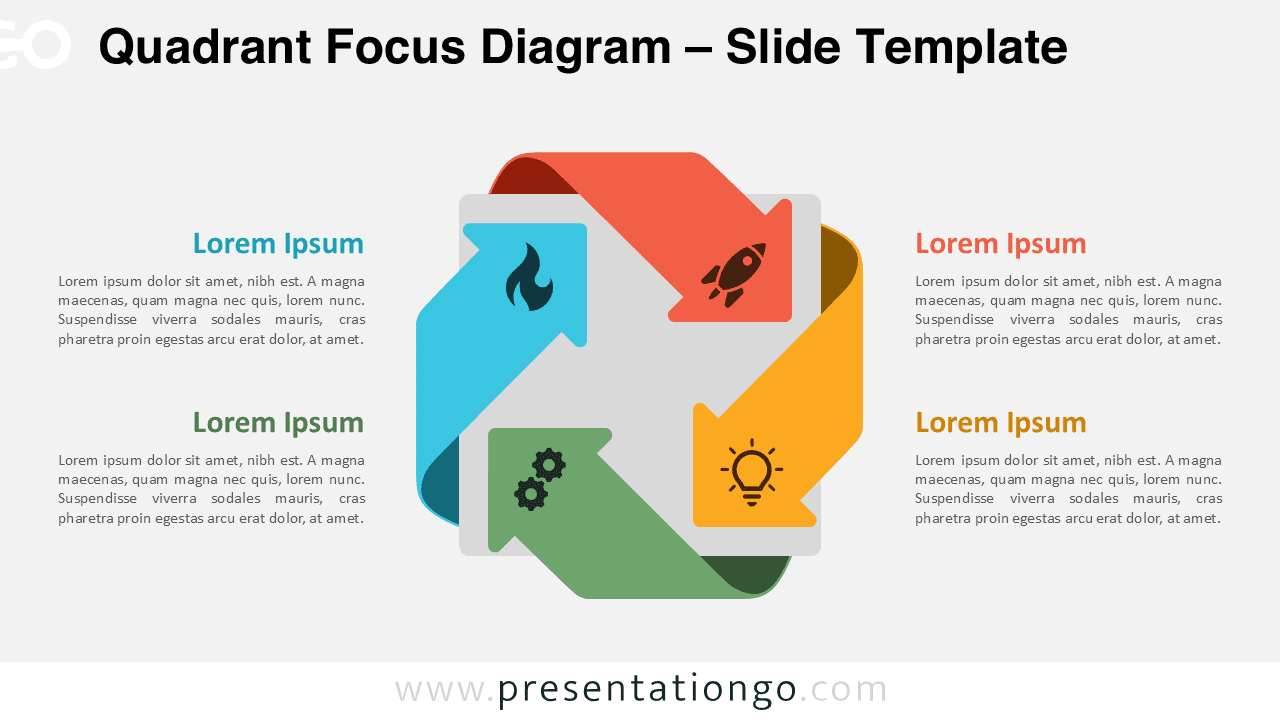
Download this Quadrant Focus Diagram for PowerPoint & Google Slides: Perfect for illustrating 4-step processes or strategies.
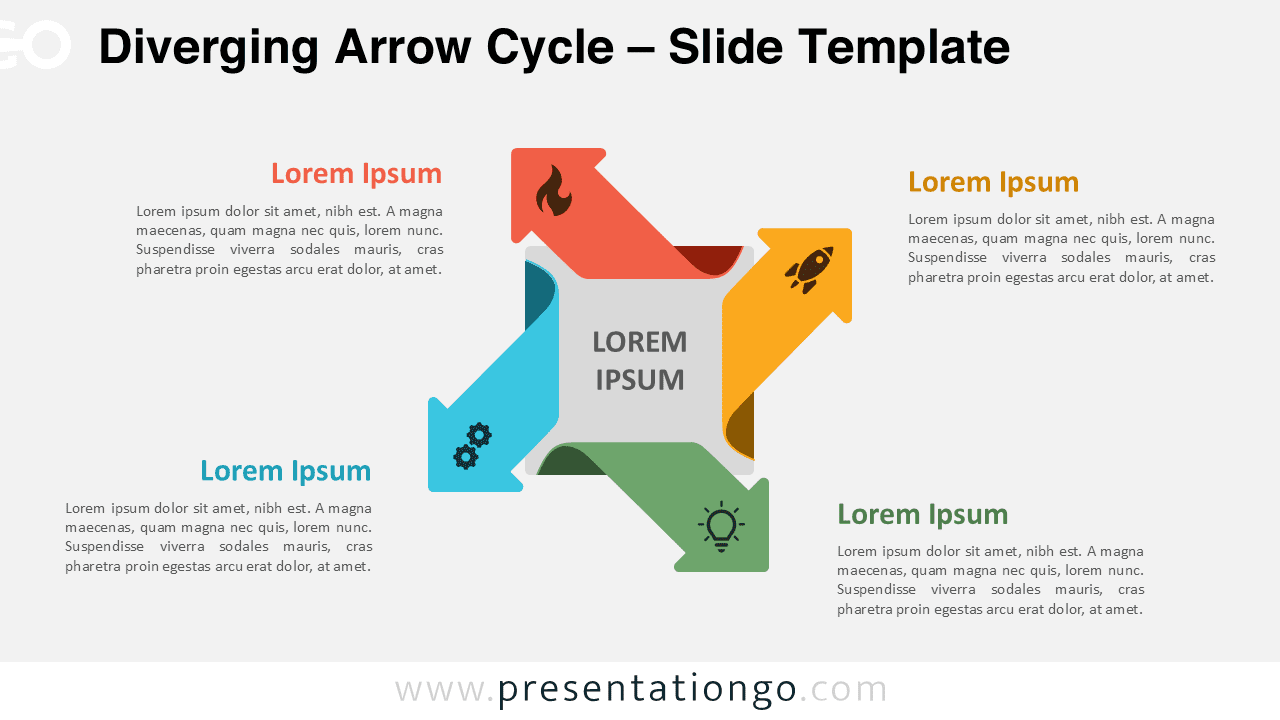
Download the Diverging Arrow Cycle template for PowerPoint and Google Slides to showcase multi-directional workflows effectively.
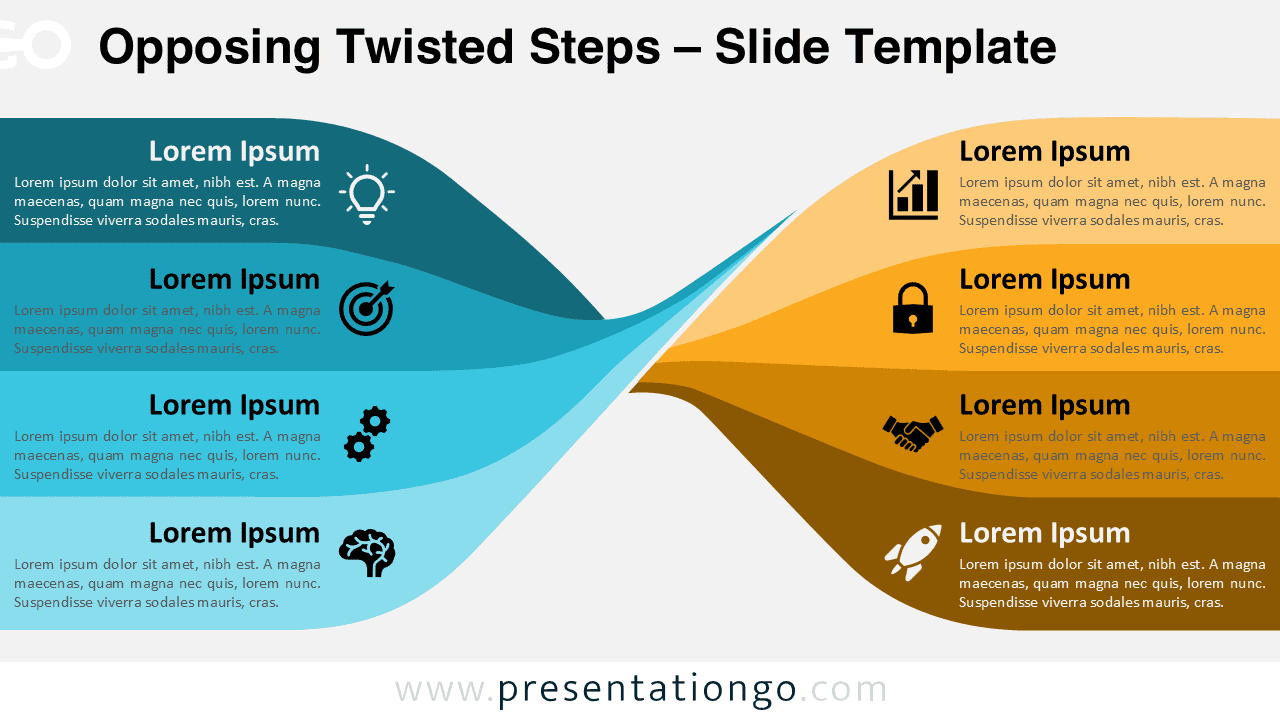
Download this versatile Opposing Twisted Steps template for PowerPoint & Google Slides, featuring mirrored banners for 8 options.
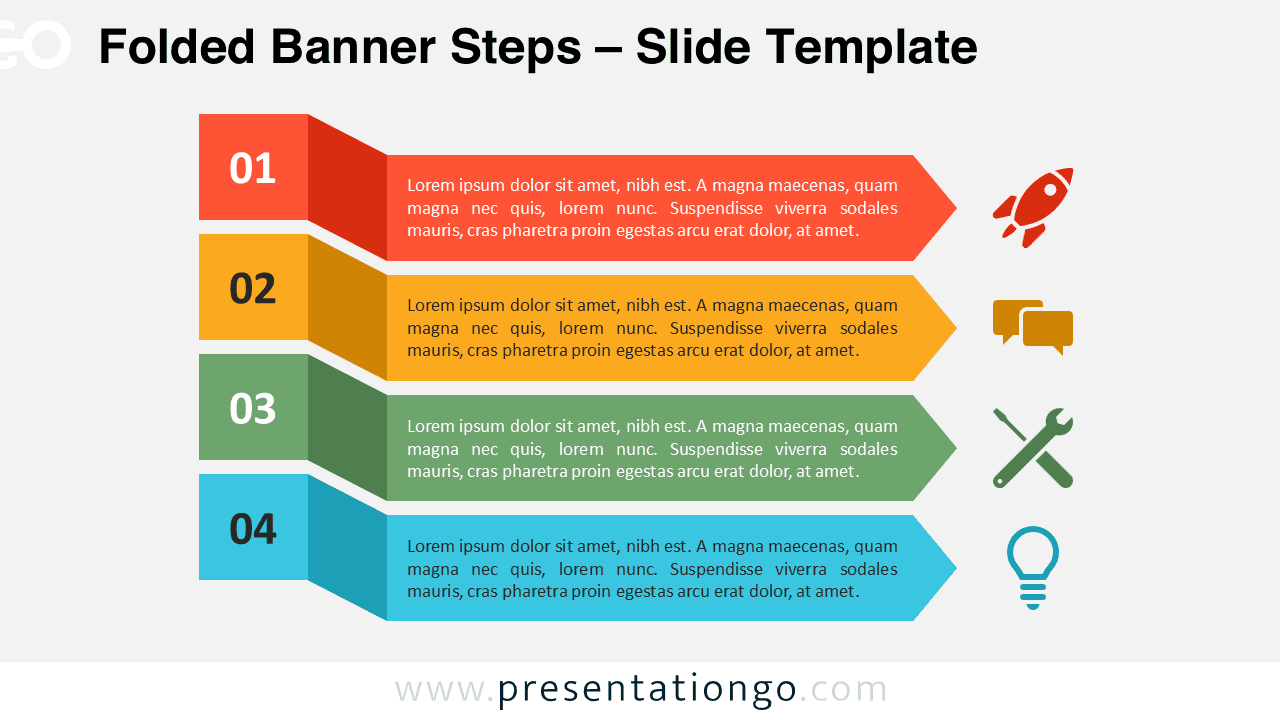
Download this 4-step Folded Banner Steps diagram for PowerPoint and Google Slides, ideal for showcasing workflows and processes.
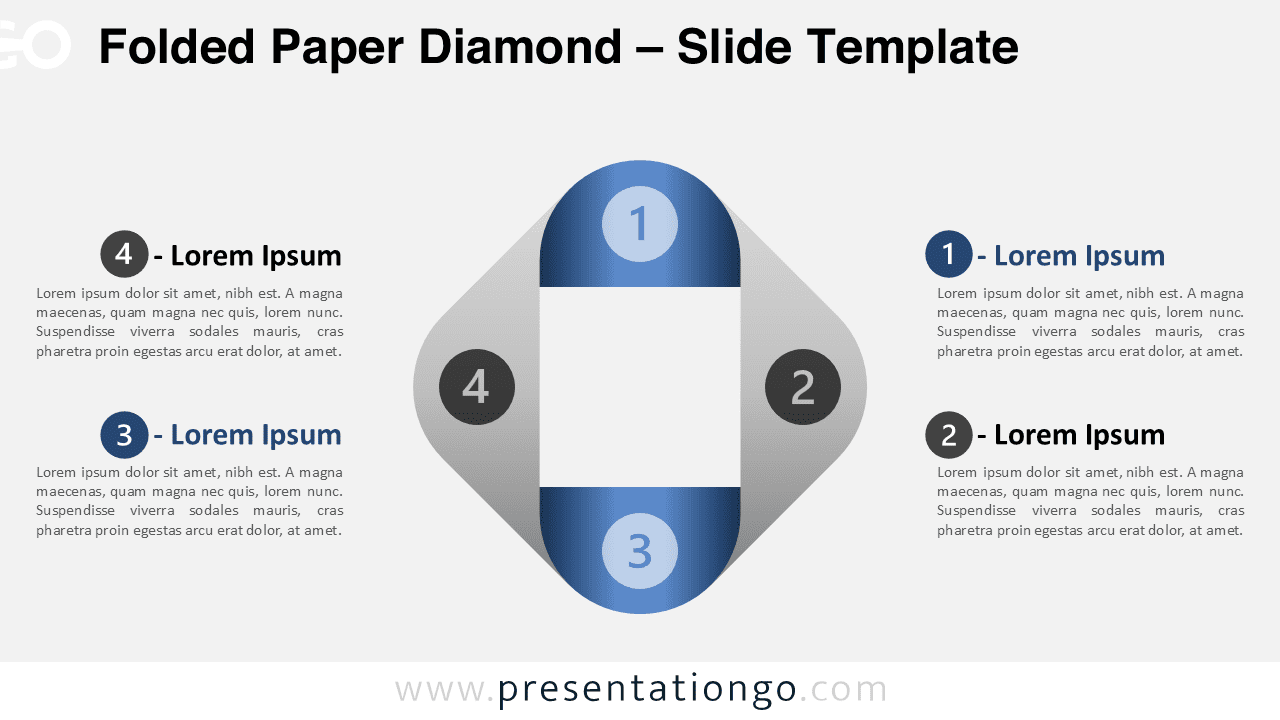
Download this 4-step Folded Paper Diamond diagram for PowerPoint and Google Slides. Perfect for processes, cycles, and workflows.