Loading resources…
Total 1760 resources
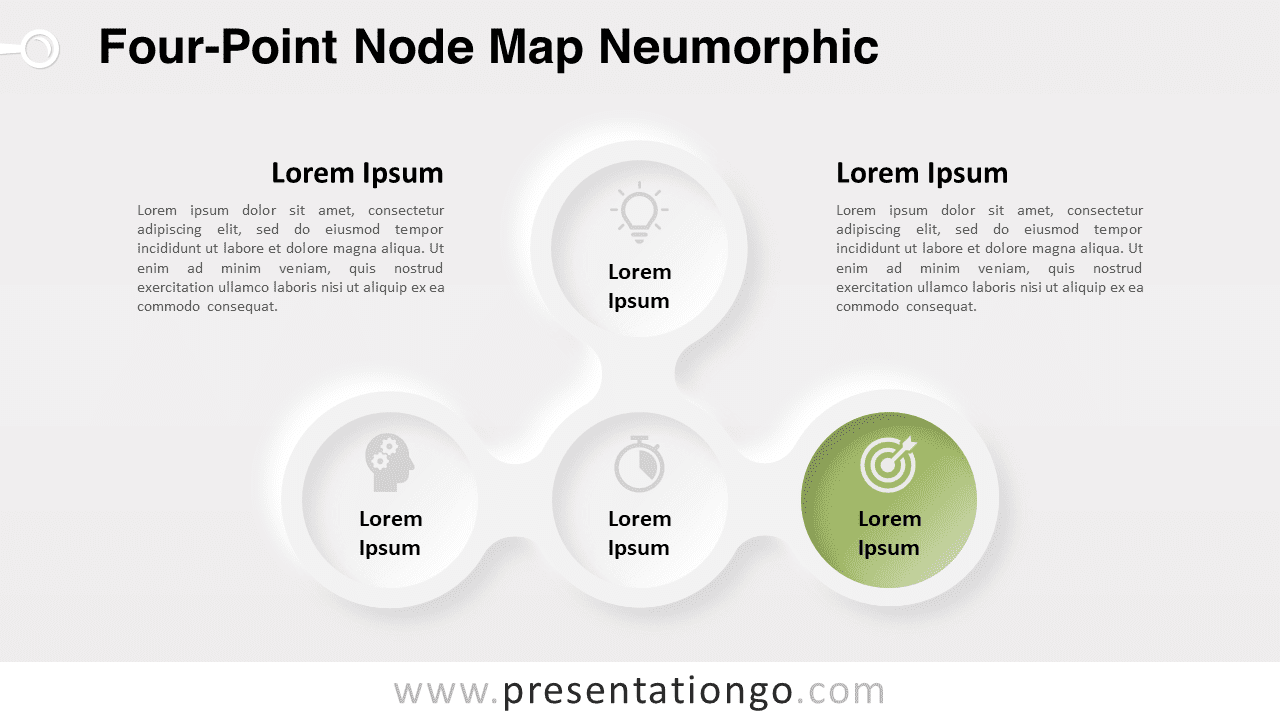
Enhance your slides with the Four-Point Node Map Neumorphic design, perfect for showcasing processes and connections in presentations.
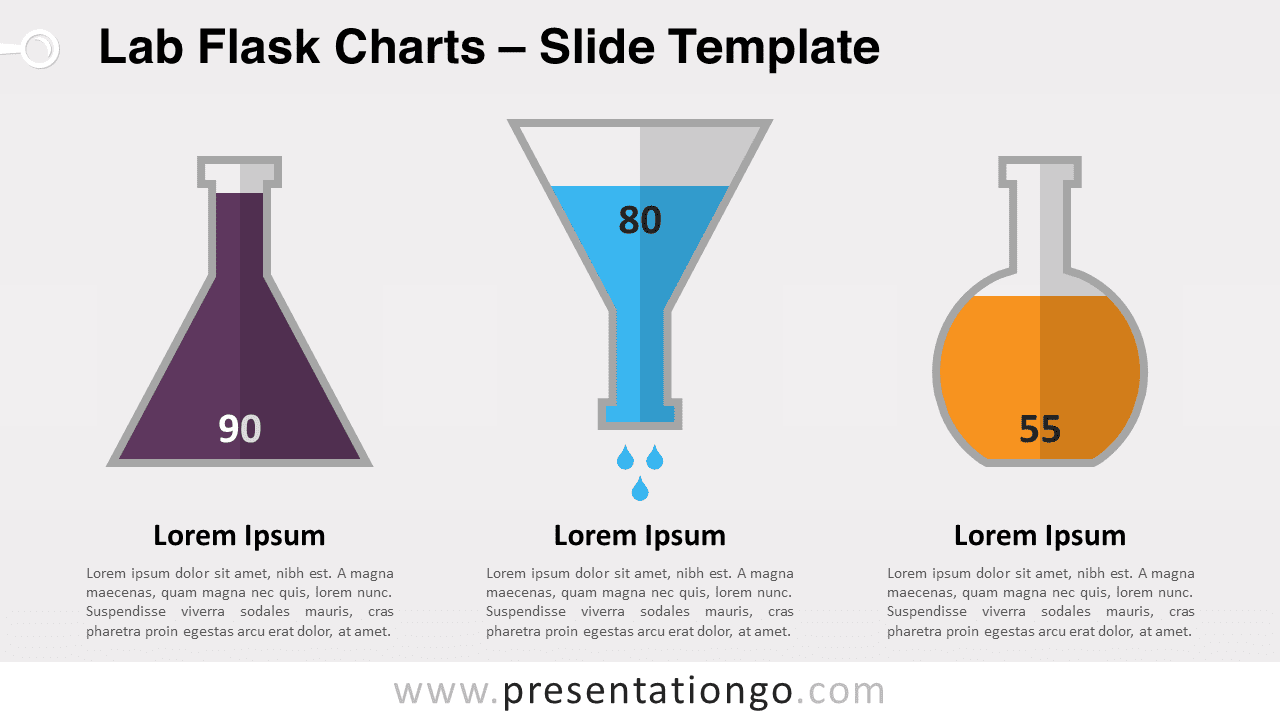
Enhance science presentations with data visualization using Lab Flask Charts for PowerPoint and Google Slides. Dynamic, editable graphics.
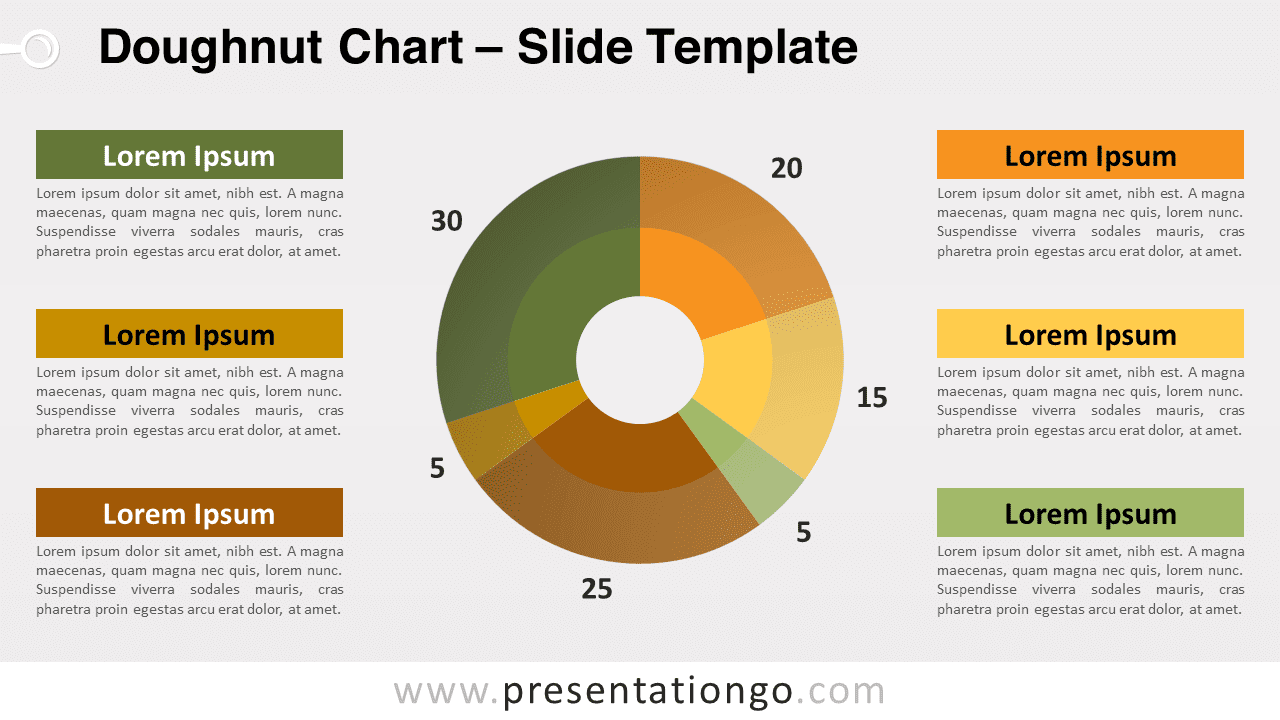
Discover editable Modern Doughnut Charts for PowerPoint to dynamically present data with style and precision in your slides.
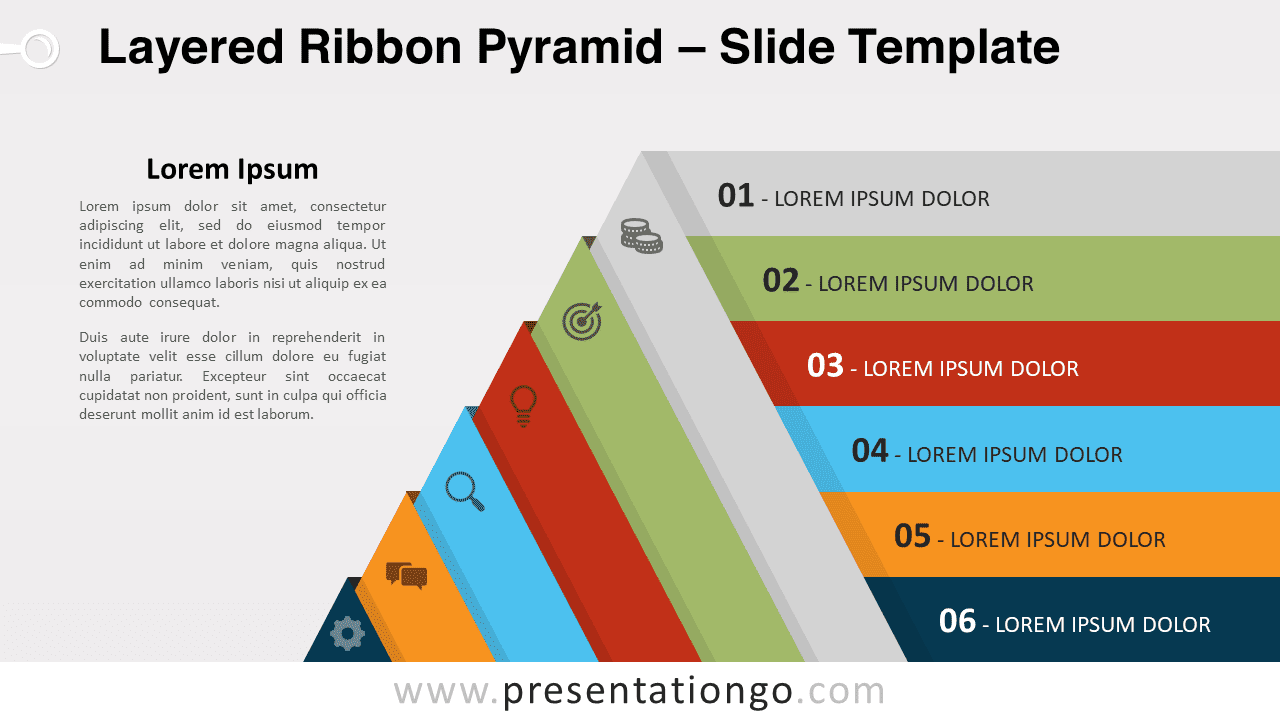
Boost slides with the Layered Ribbon Pyramid for PowerPoint, ideal for showcasing processes and hierarchies in a clear layout.
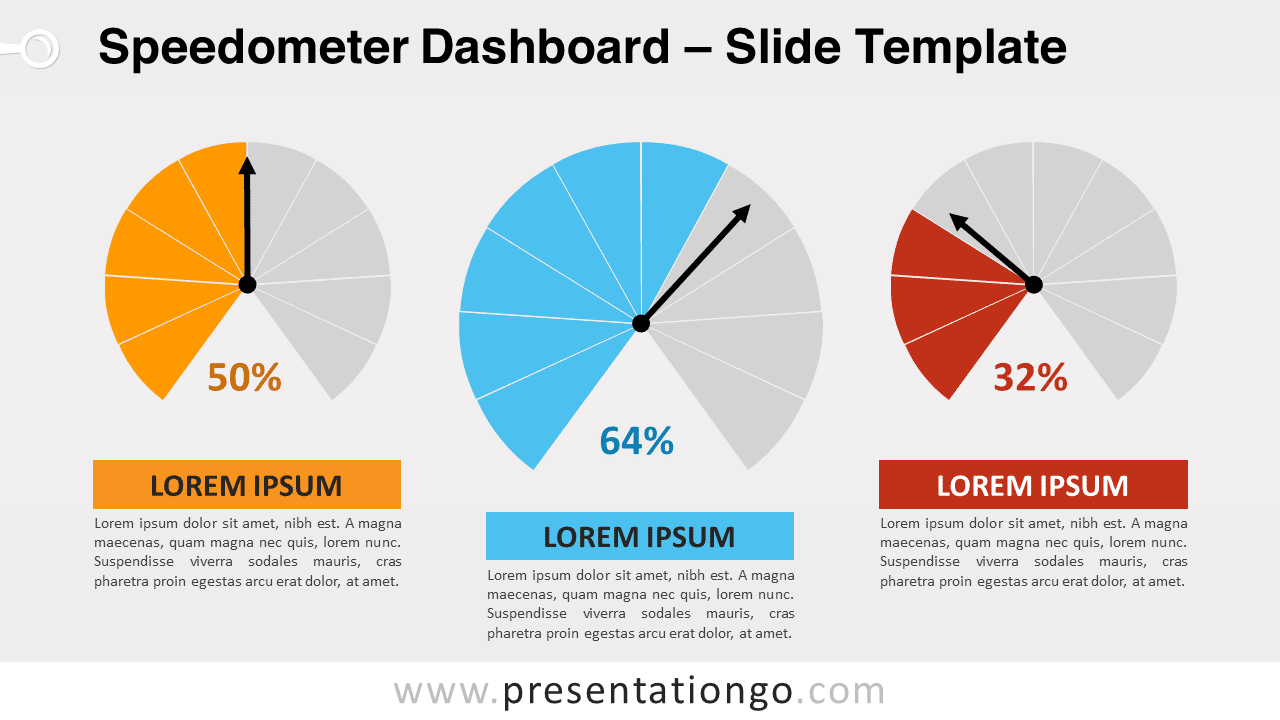
Enhance your slides with our Speedometer Dashboard for PowerPoint and Google Slides, a customizable template for dynamic data display and analysis.
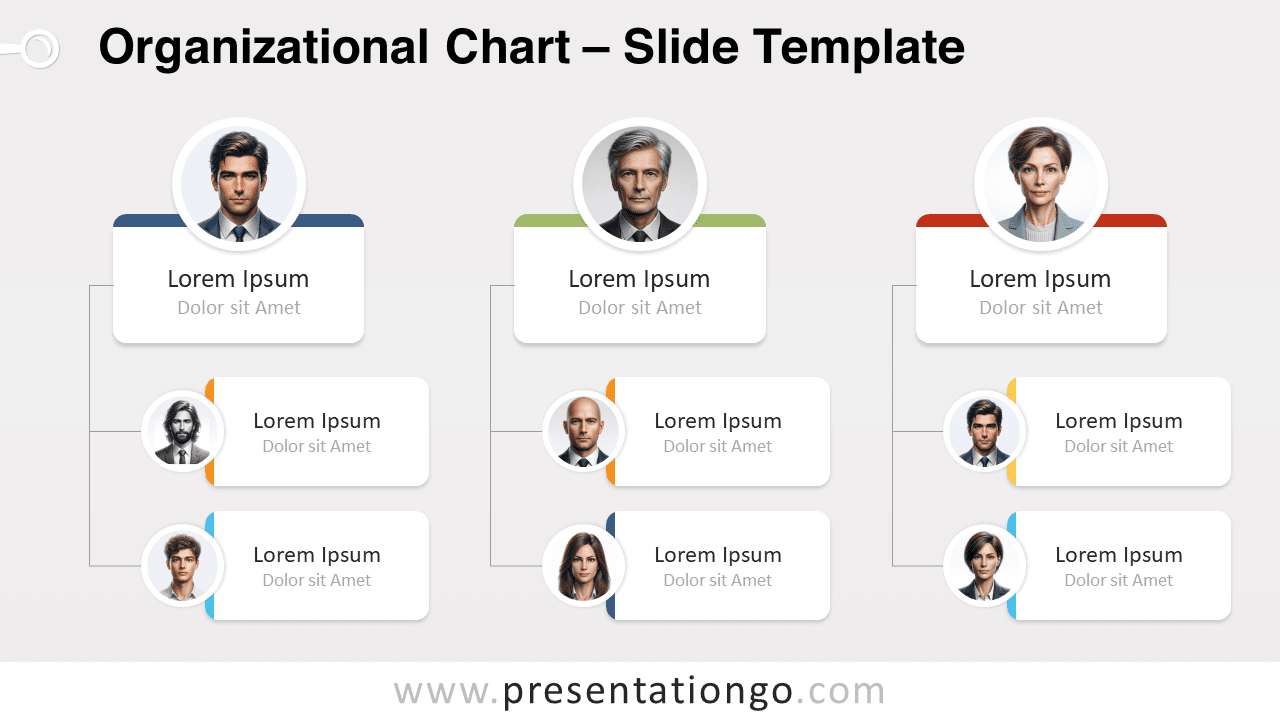
Explore our Organizational Chart for PowerPoint and Google Slides to clearly present company hierarchies and roles with a customizable, intuitive design.
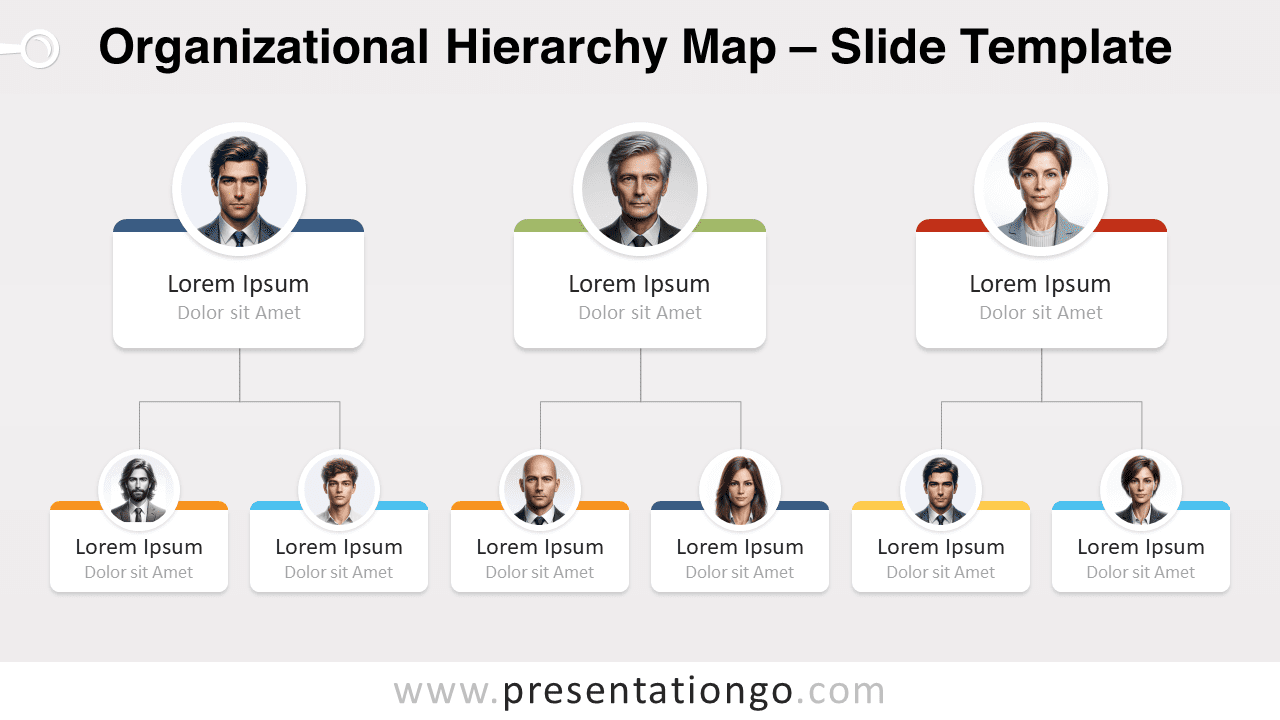
Streamline your presentations with the Organizational Hierarchy Map for PowerPoint and Google Slides, an editable, versatile tool for depicting company structures.
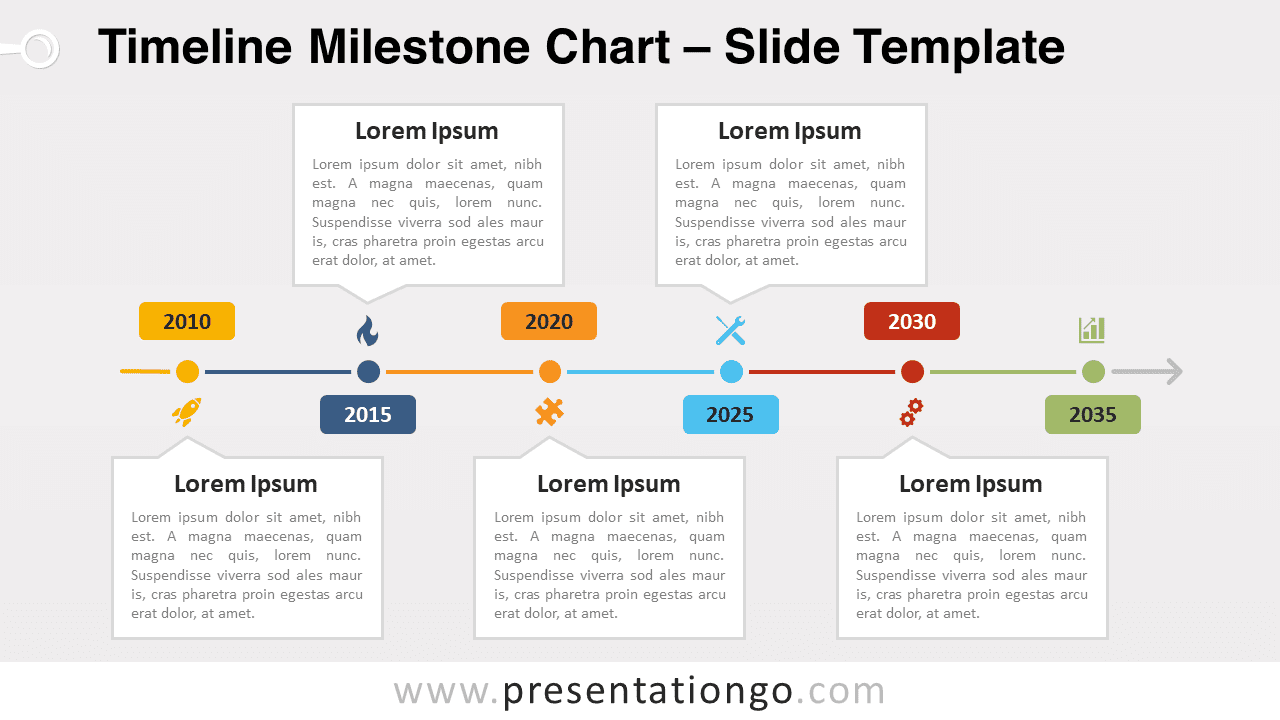
Download our customizable Timeline Milestone Chart for presentations on PowerPoint and Google Slides to visualize project timelines effectively.
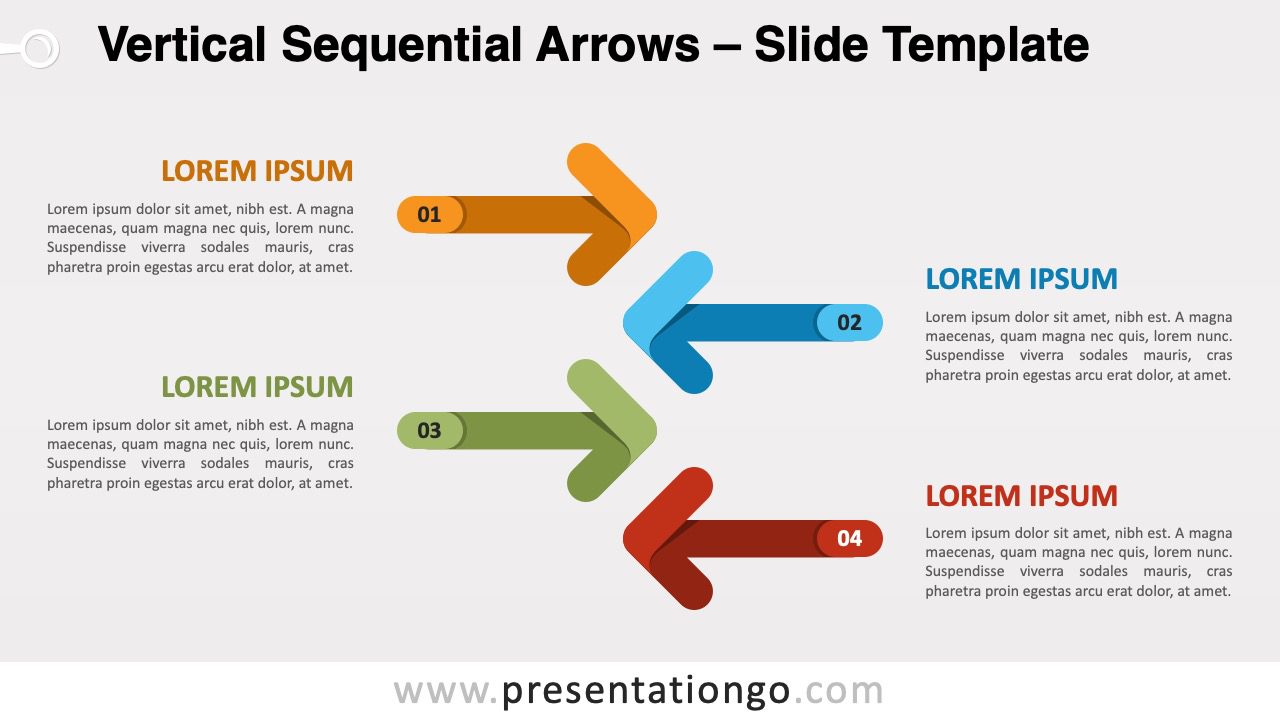
Download Vertical Sequential Arrows to visually streamline your presentation's process flow in PowerPoint and Google Slides.
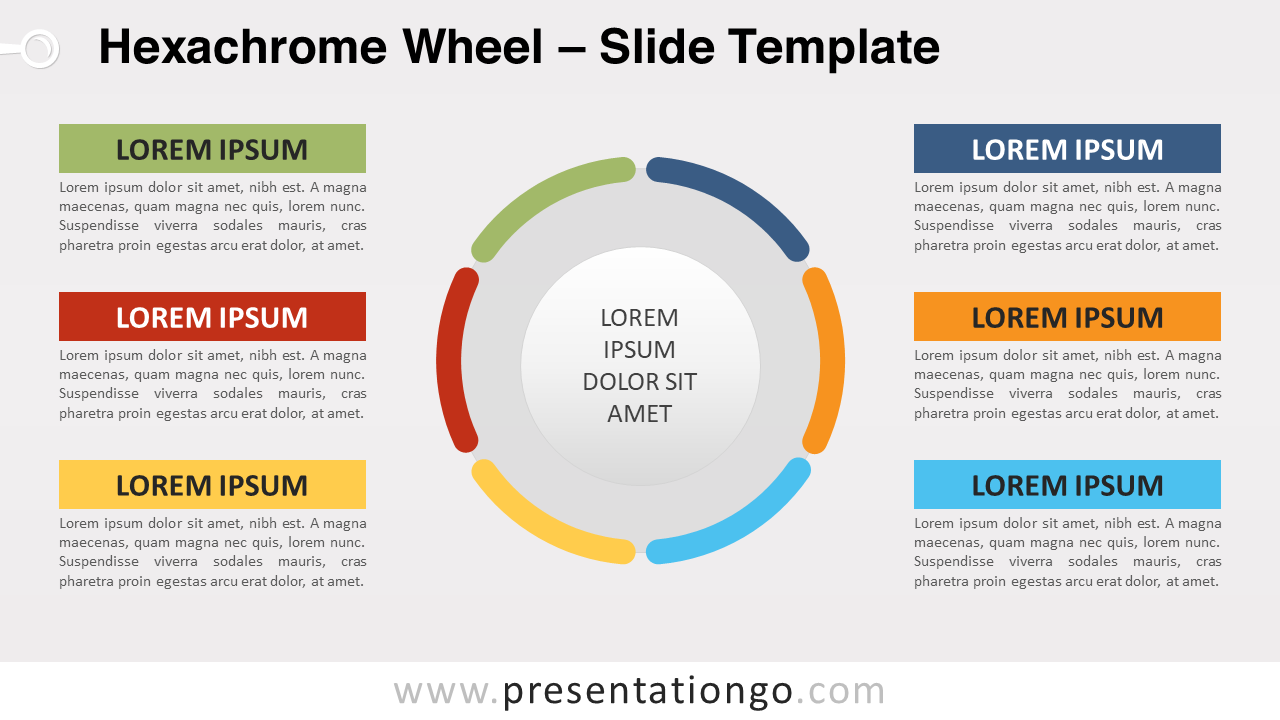
Explore the Hexachrome Wheel for PowerPoint and Google Slides: a sophisticated circular diagram adept at delineating six integrated concepts.
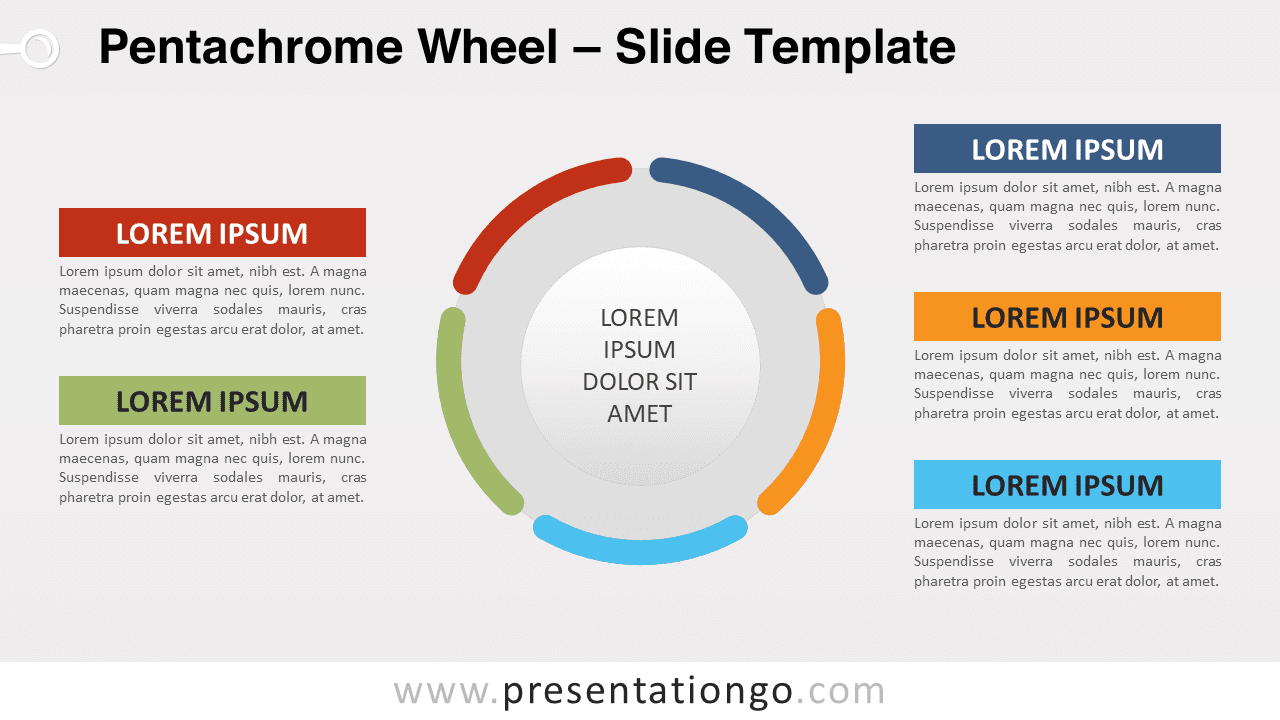
Delve into the Pentachrome Wheel for PowerPoint and Google Slides: an elegant circular diagram designed to illustrate five intertwined ideas distinctly.
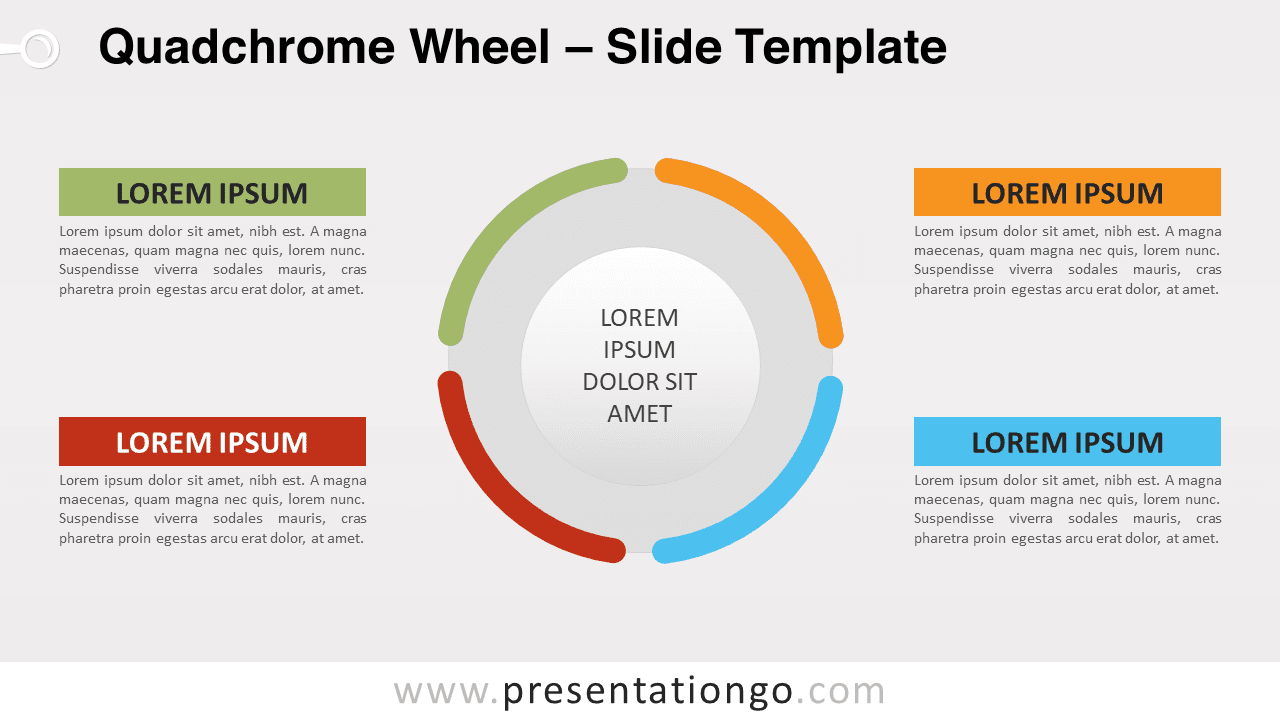
Experience the Quadchrome Wheel for PowerPoint and Google Slides: a refined circular diagram to elucidate four related ideas vividly.
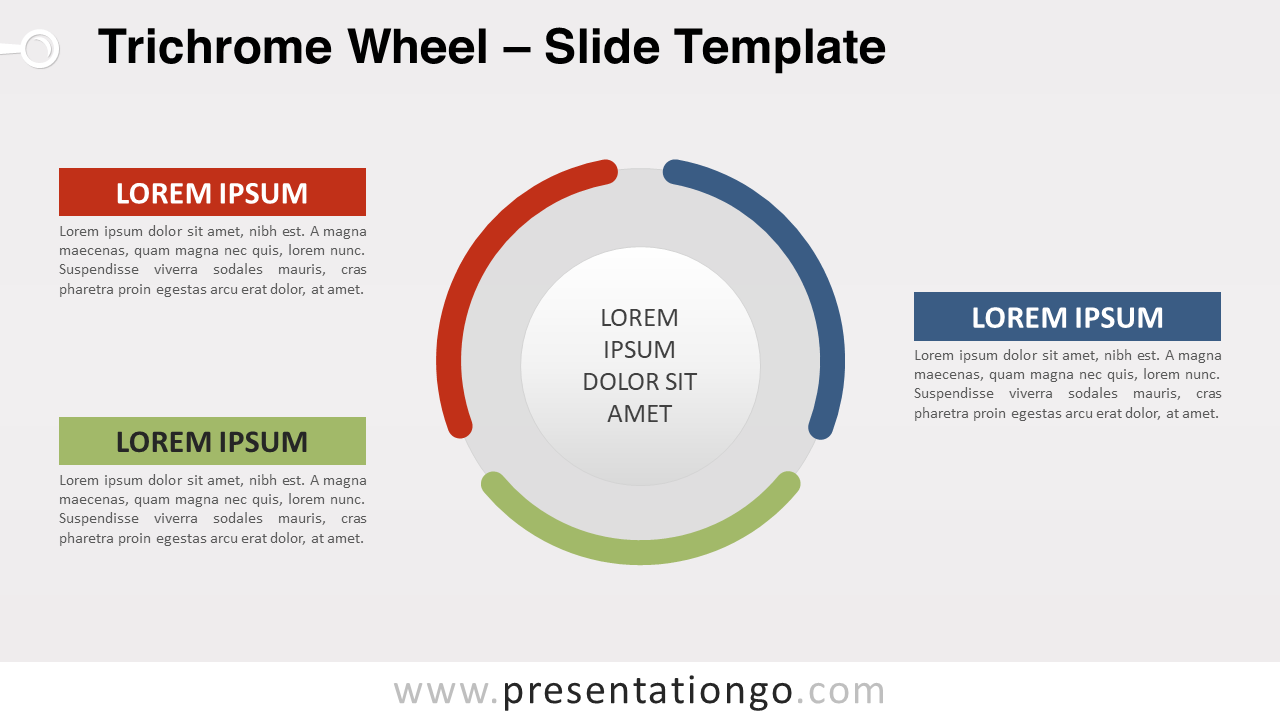
Discover the Trichrome Wheel for PowerPoint and Google Slides: a captivating circular diagram to present three interconnected ideas with clarity.
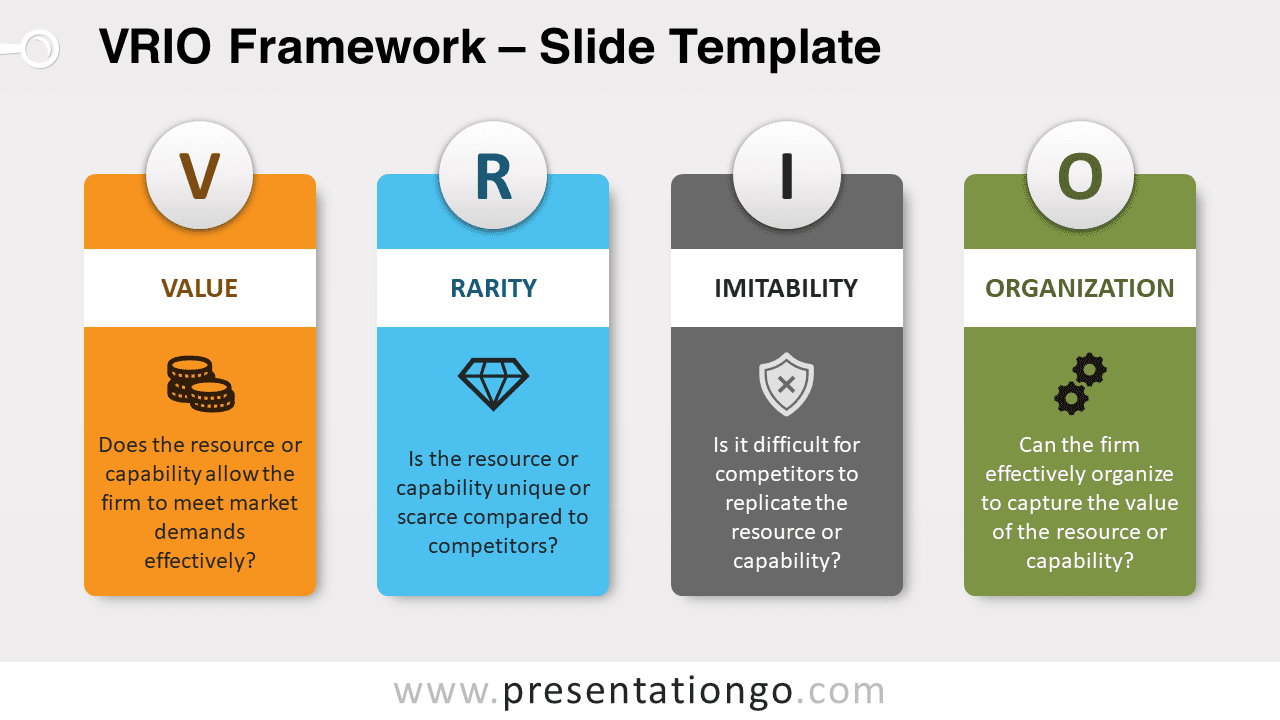
Unveil the VRIO Framework for PowerPoint: a unique design with vivid cards representing Value, Rarity, Imitability, and Organization for standout presentations.
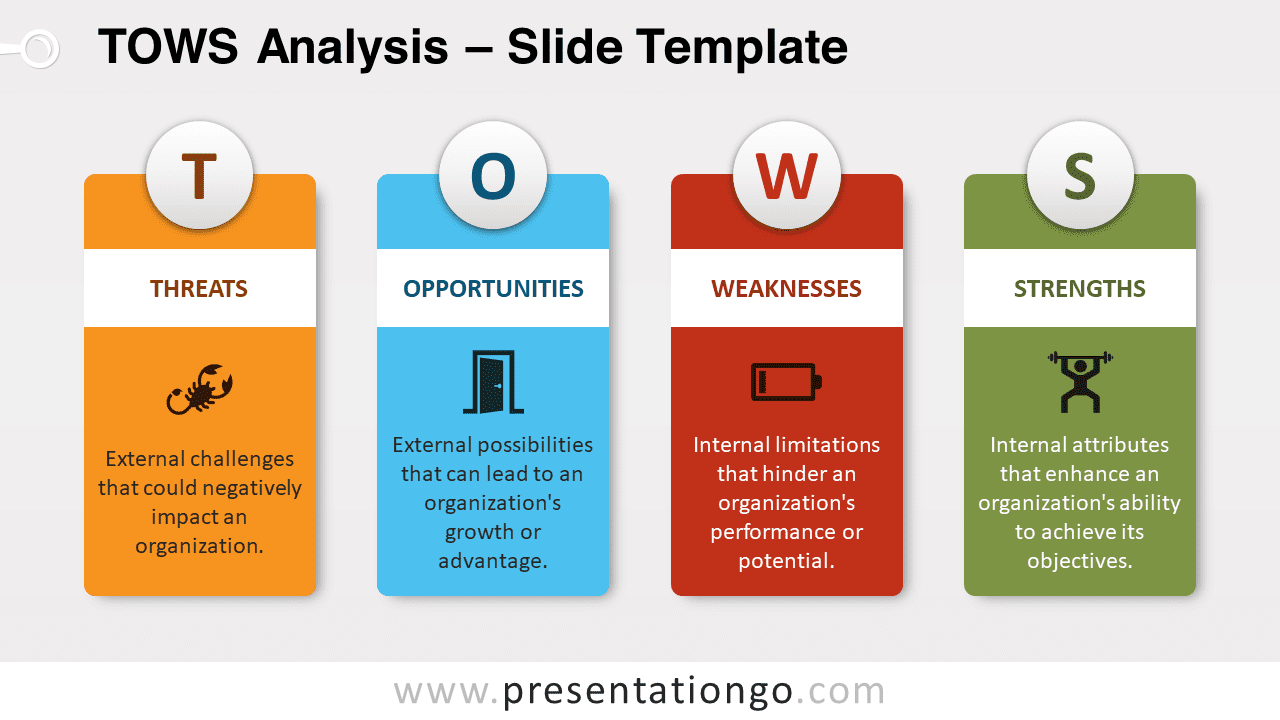
Discover the TOWS Analysis for PowerPoint: a dynamic design for impactful presentations. Dive into its vibrant model and elevate your strategy talks.
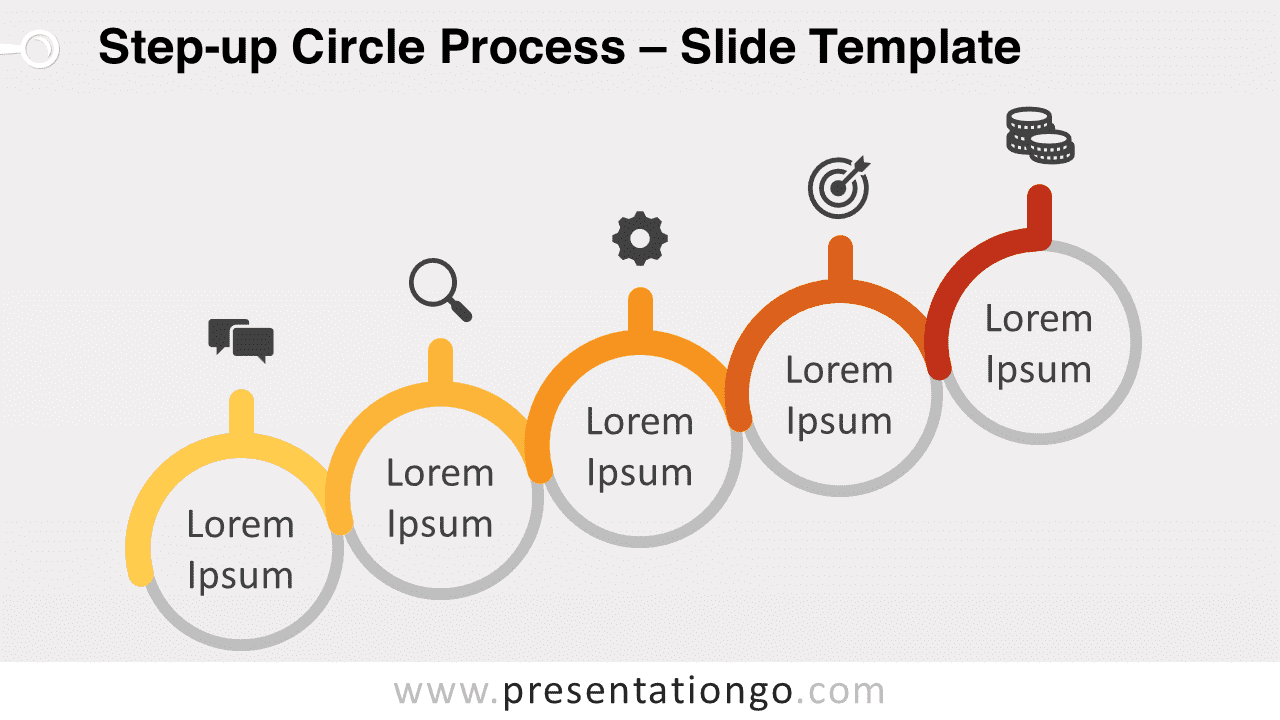
Discover the Step-up Circle Process for PowerPoint & Google Slides: a 5-part design to elevate presentations, illustrating growth and progression.
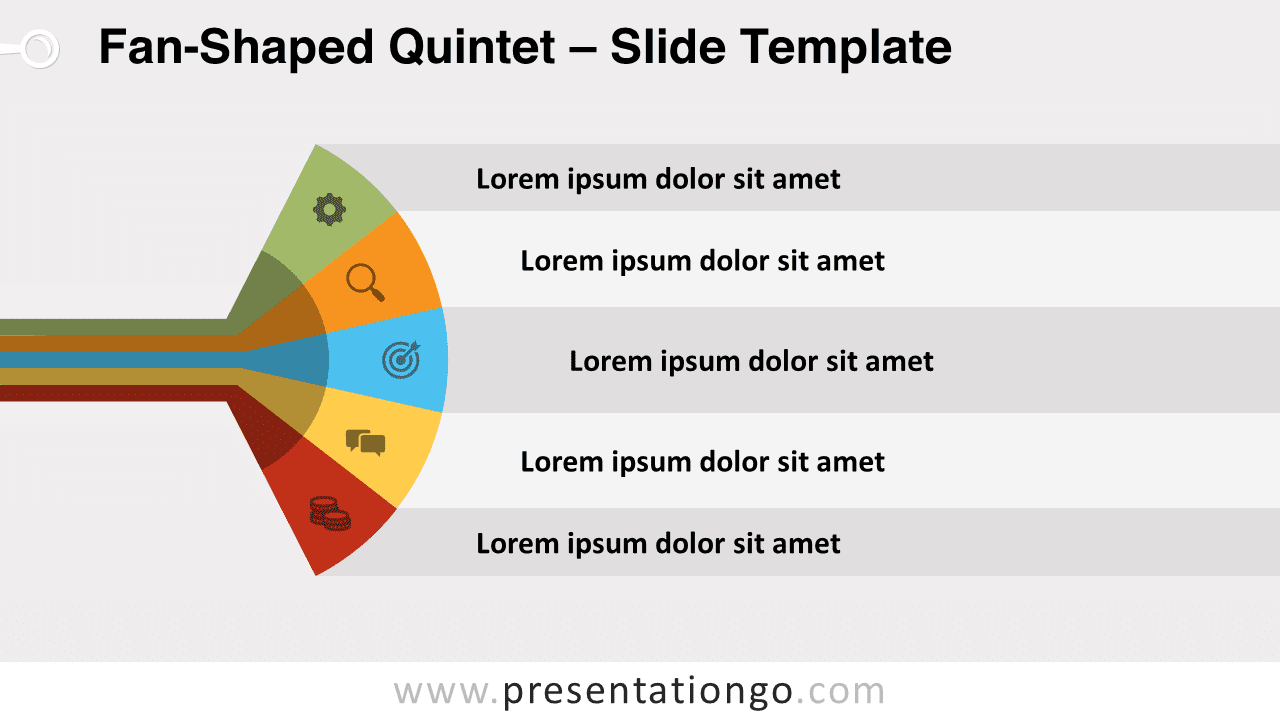
Discover the Fan-Shaped Quintet for PowerPoint: a 5-part illustration for impactful presentations. Edit, customize, and captivate your audience!
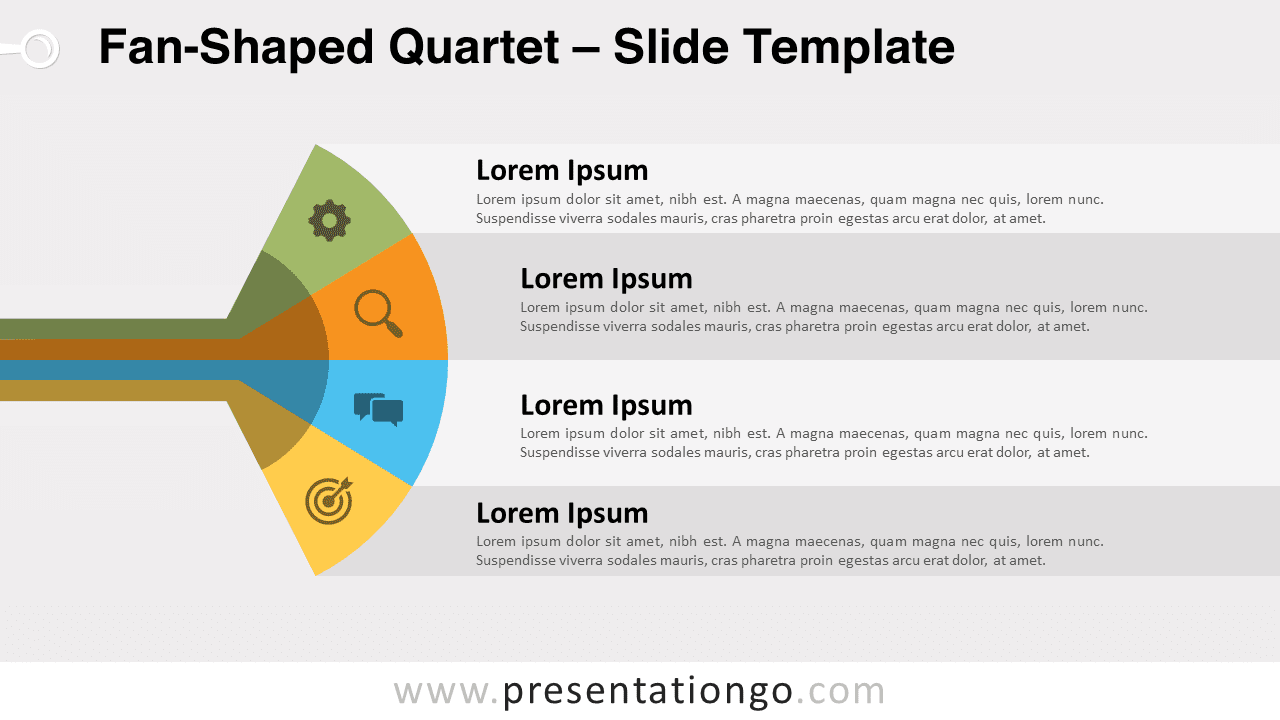
Unveil the Fan-Shaped Quartet for PowerPoint and Google Slides, an innovative slide template with 4 distinct sections for impactful presentations.
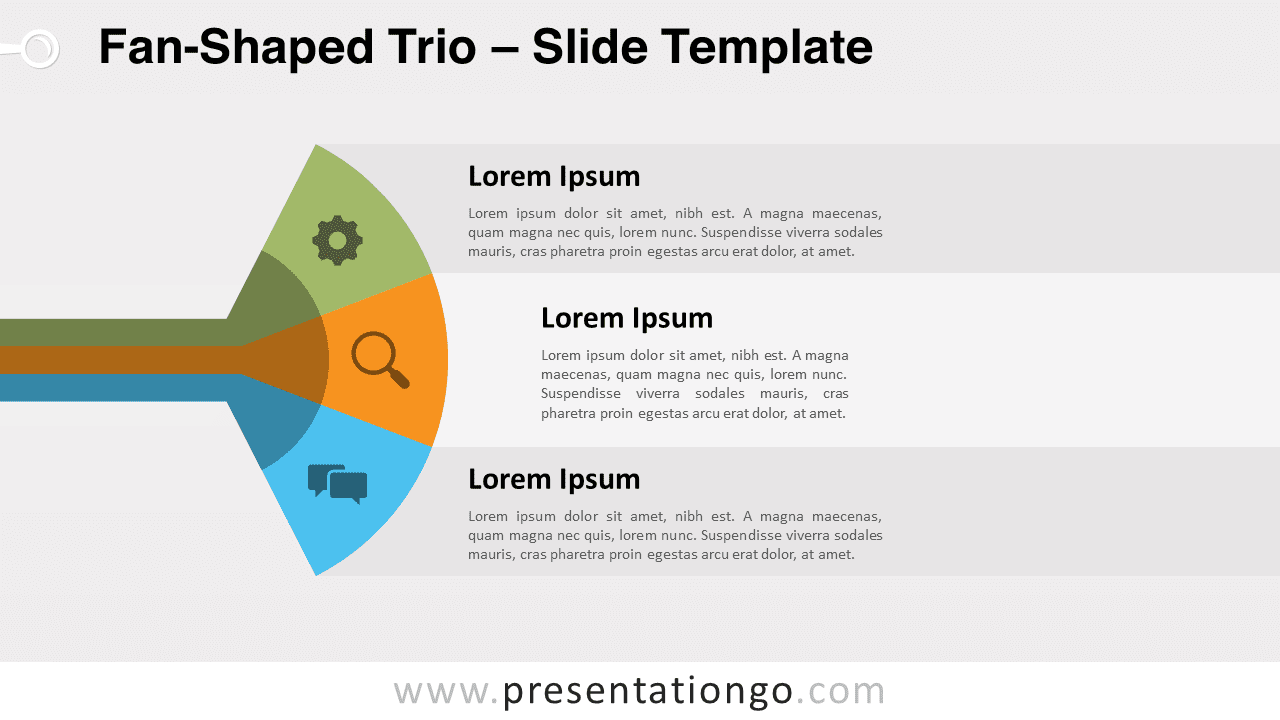
Discover the Fan-Shaped Trio for PowerPoint, a dynamic illustration for presenting three elements. Ideal for steps or lists in presentations.
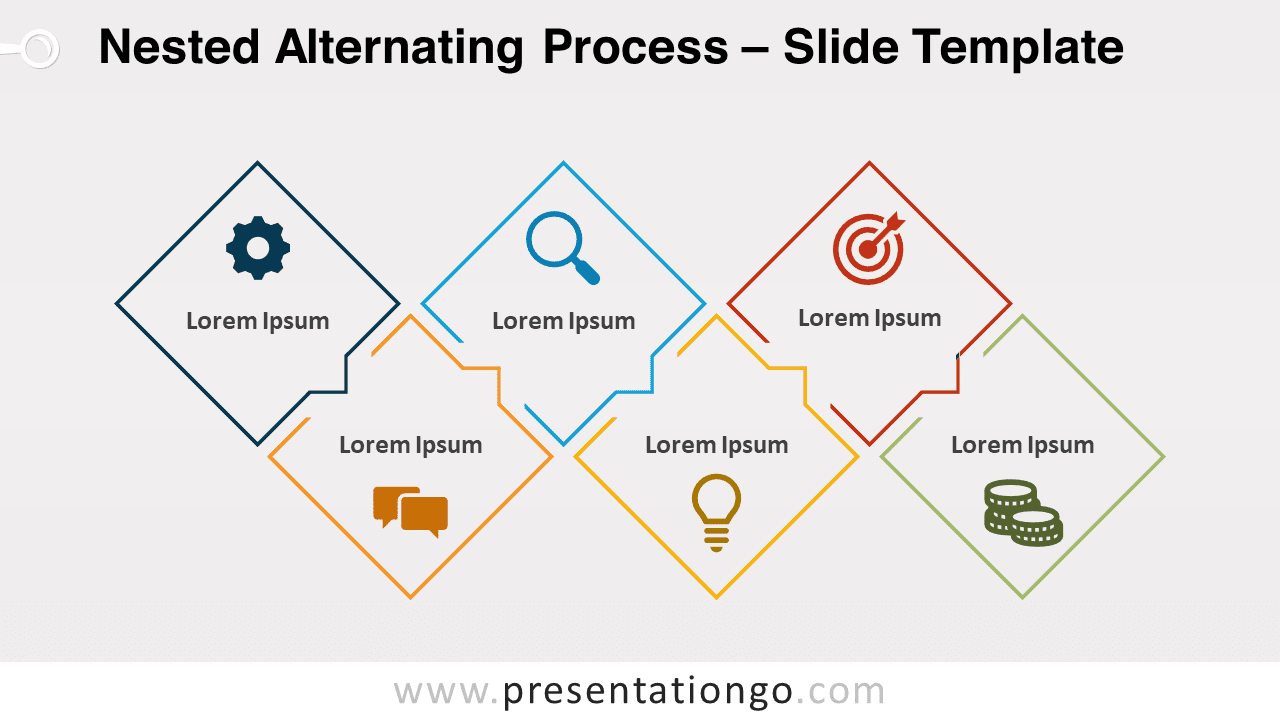
Discover the Nested Alternating Process – a 6-step illustration for impactful PowerPoint and Google Slides presentations.
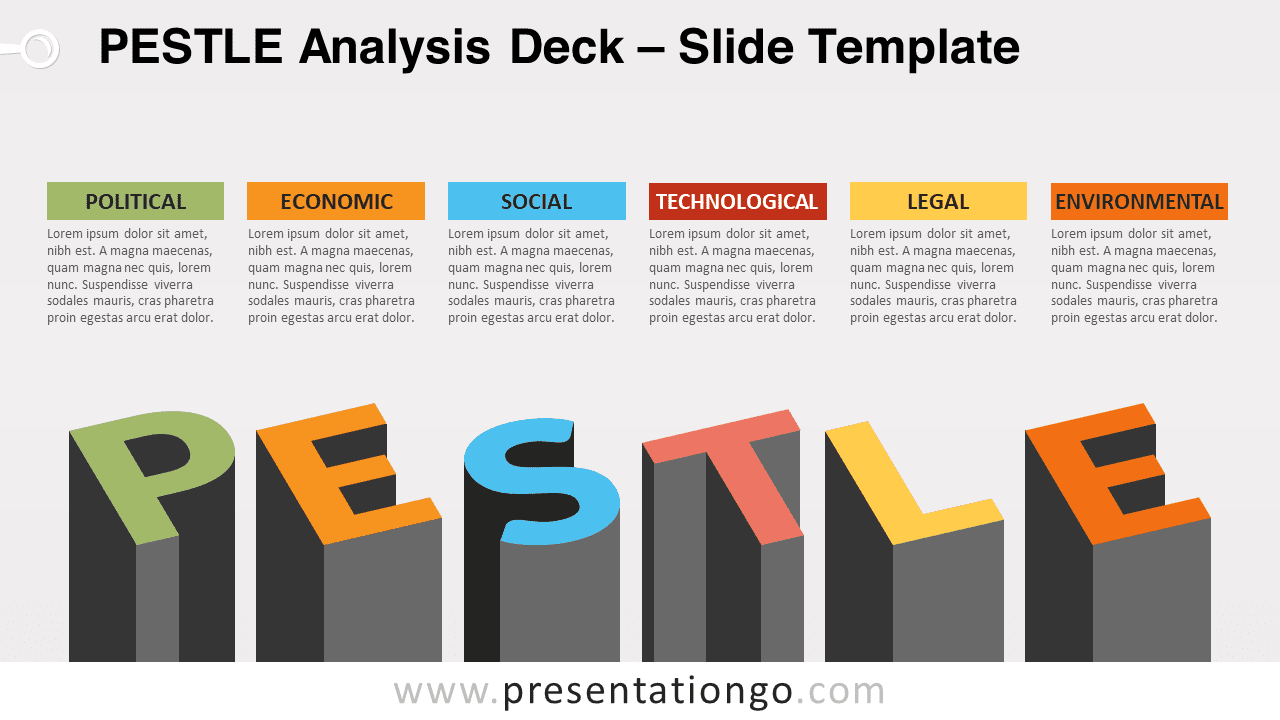
Elevate your presentation with the PESTLE Analysis Deck for PowerPoint and Google Slides. Dive into key strategic aspects seamlessly.
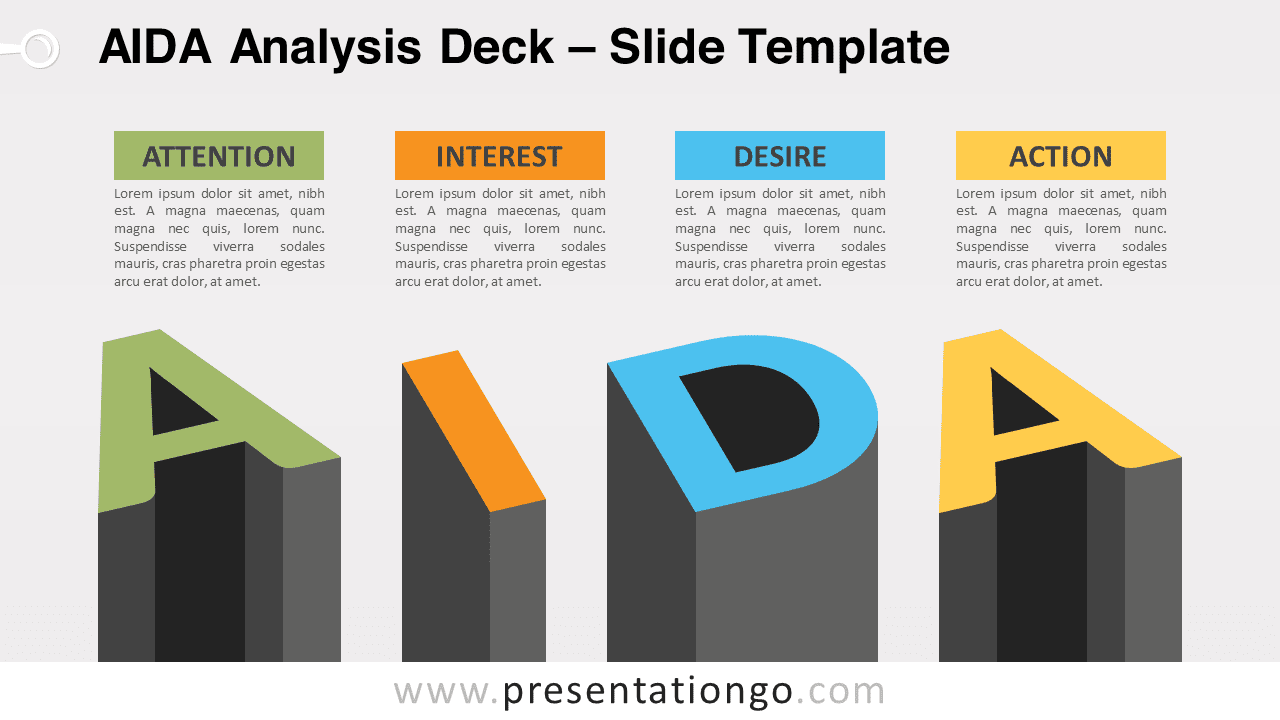
Discover the AIDA Analysis Deck for PowerPoint and Google Slides. Present the AIDA model with impactful visuals for standout presentations.
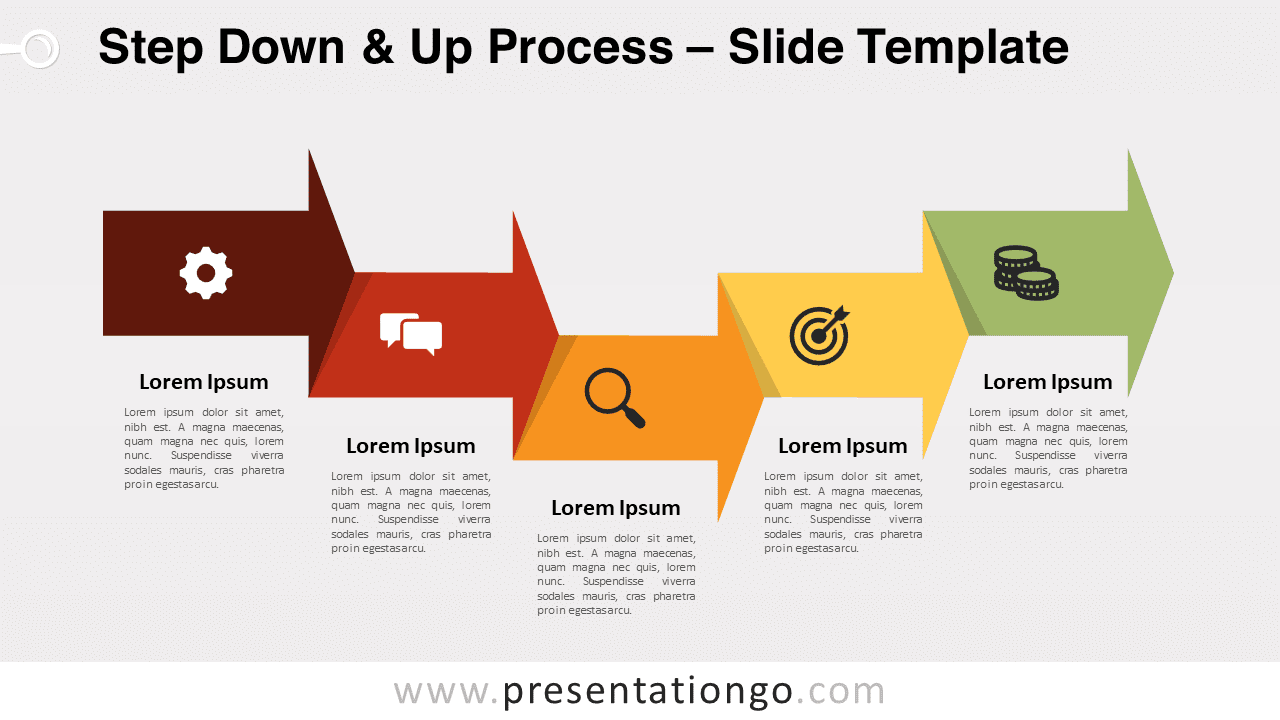
Discover the Step Down & Up Process for PowerPoint and Google Slides - a unique visual aid with five arrows to how descent & ascent effectively.
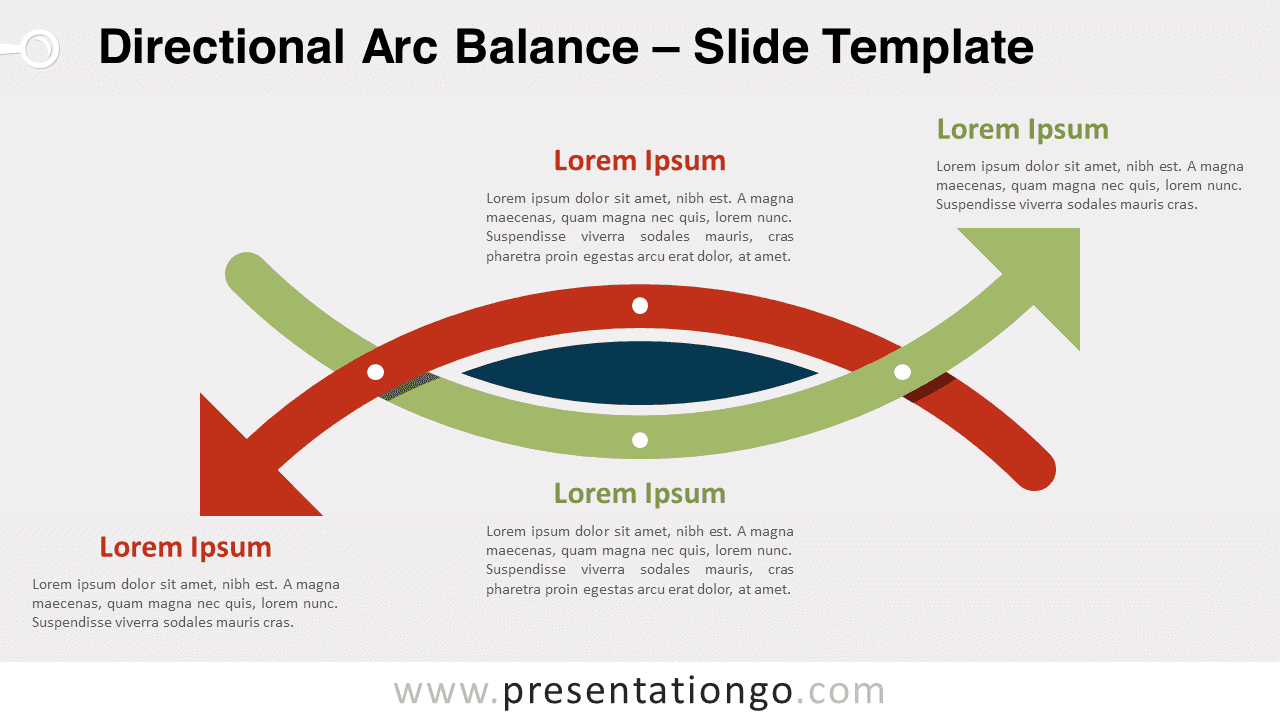
Enhance your presentations with 'Directional Arc Balance for PowerPoint'. A distinctive illustration for PowerPoint & Google Slides, perfect for contrasting ideas.