Loading resources…
Total 1760 resources
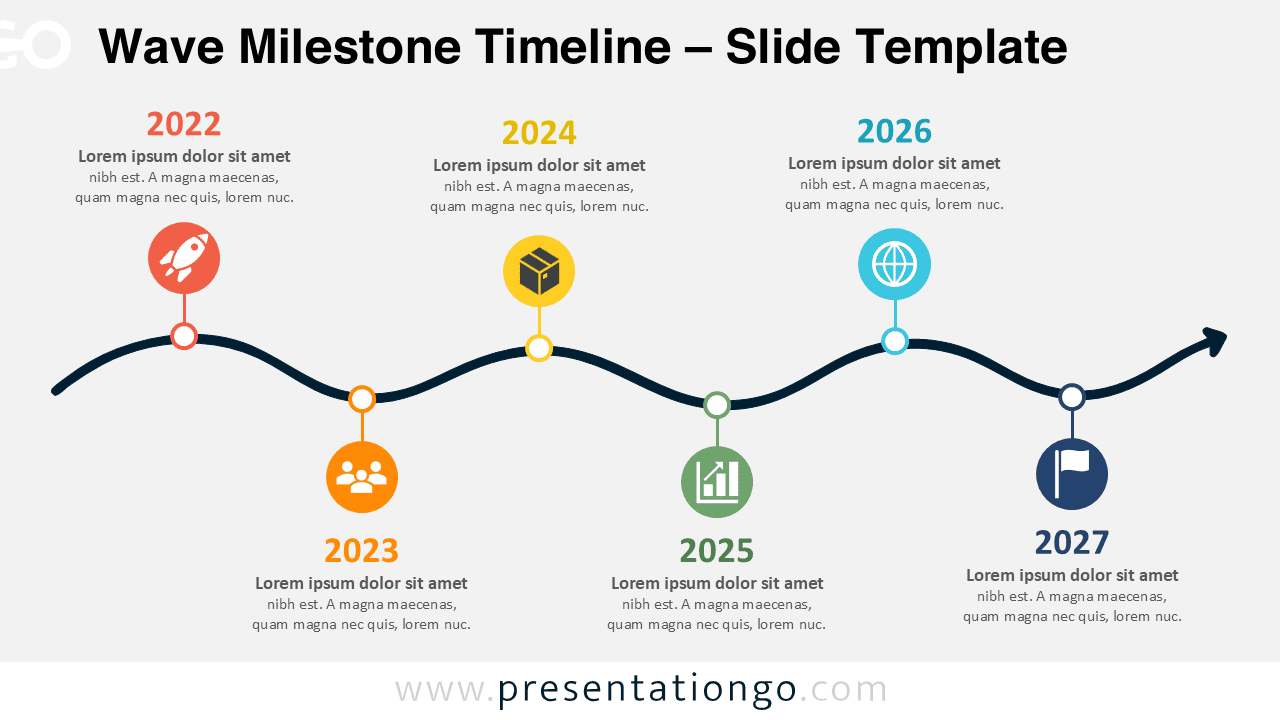
Download the Wave Milestone Timeline for PowerPoint and Google Slides. Present six milestones, dates, goals, or project stages along an editable curved path.
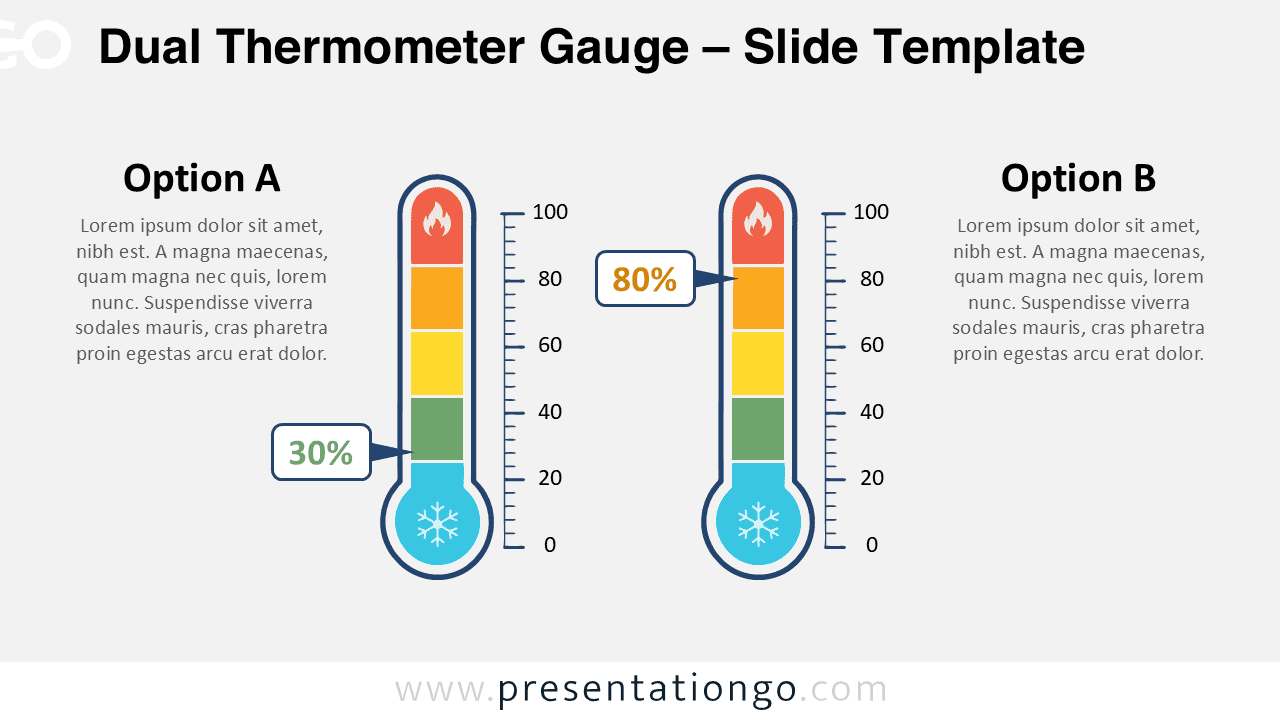
Download the Dual Thermometer Gauge for PowerPoint and Google Slides to compare two values, levels, ratings, or performance indicators visually.
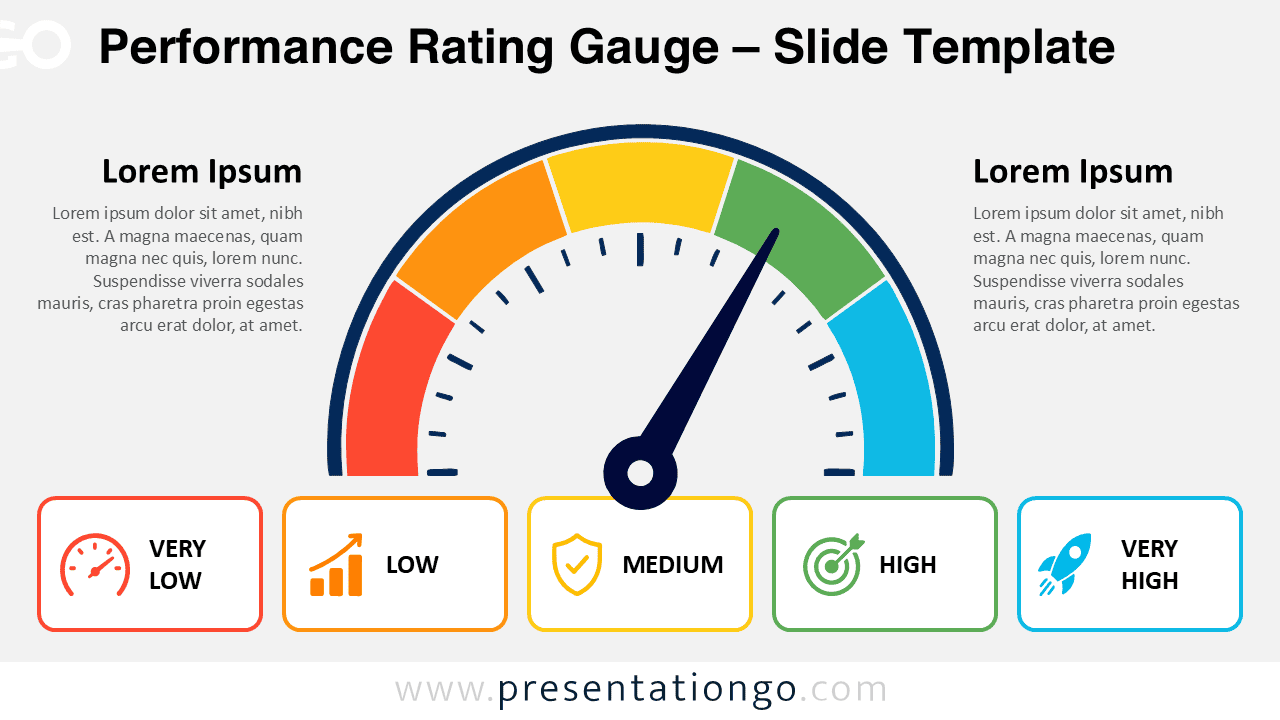
Download the Performance Rating Gauge for PowerPoint and Google Slides. Use this editable five-level gauge to show ratings, KPIs, risks, or progress.
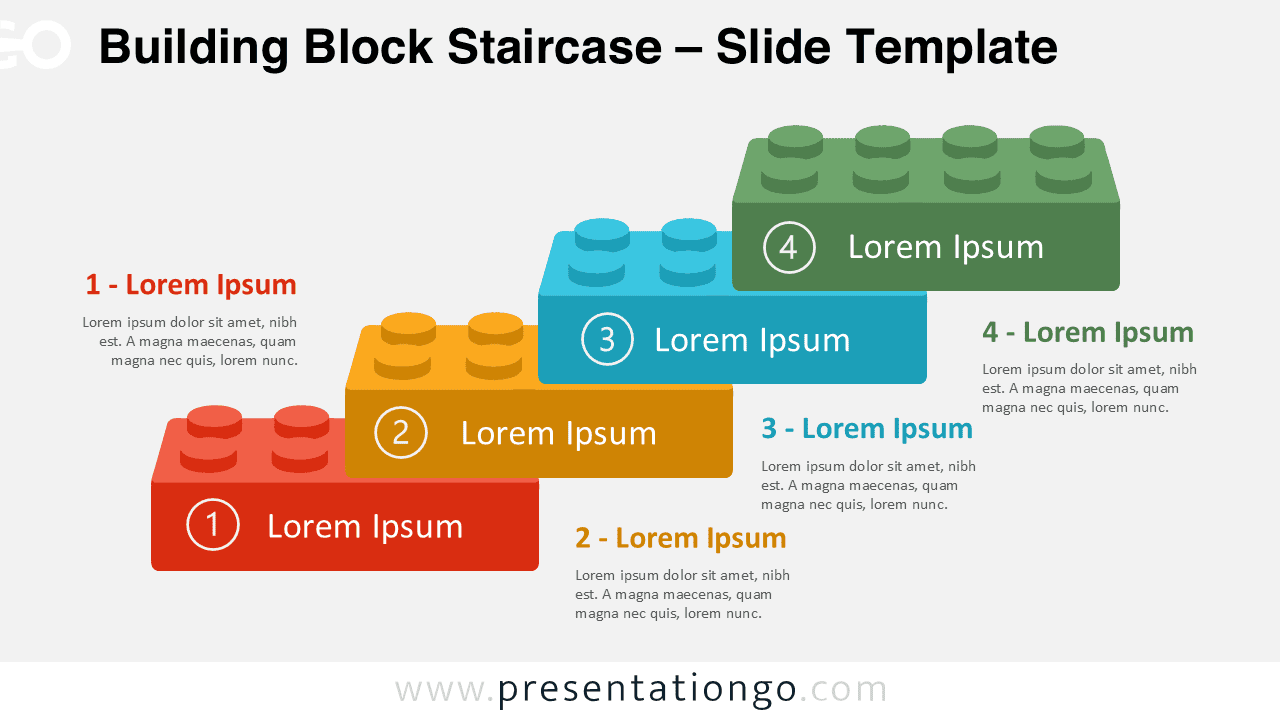
Download the Building Block Staircase PowerPoint diagram with four editable steps for processes, milestones, growth plans, and Google Slides presentations.
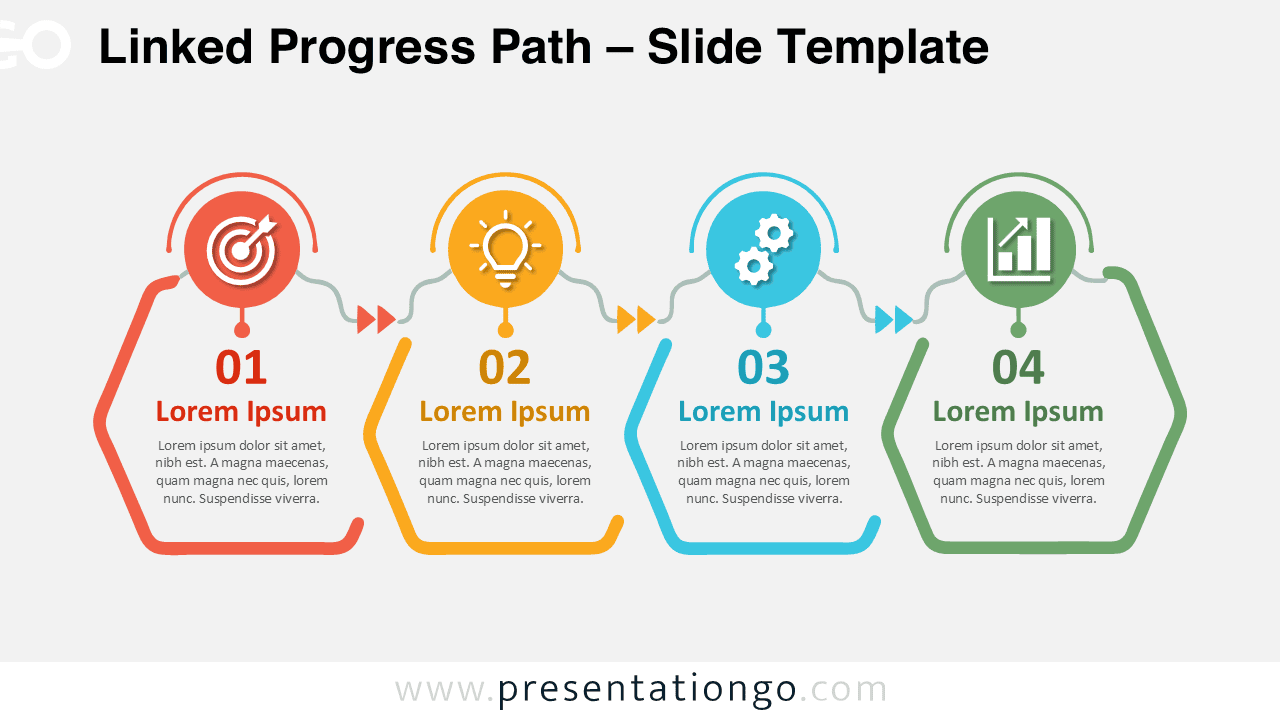
Download the Linked Progress Path diagram for PowerPoint and Google Slides. Present four connected stages with editable shapes, text, and icons.
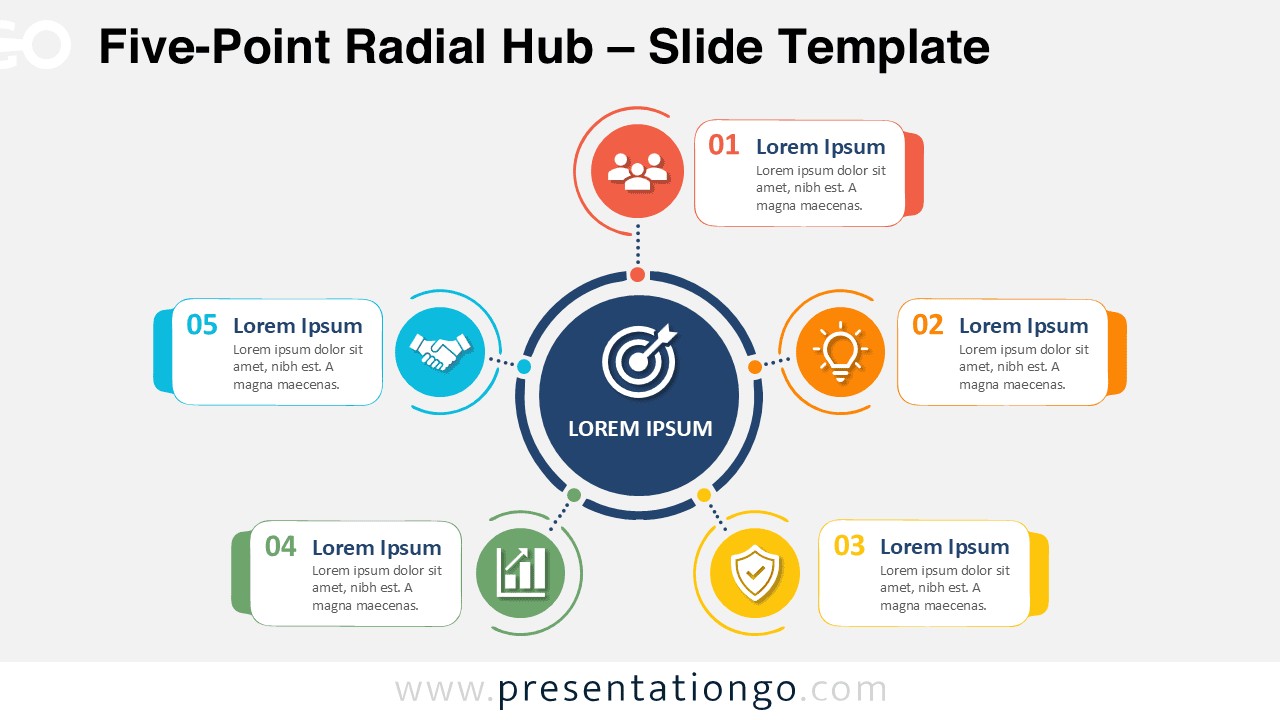
Download the Five-Point Radial Hub diagram for PowerPoint and Google Slides. Present five connected ideas with editable text, shapes, and Office icons.
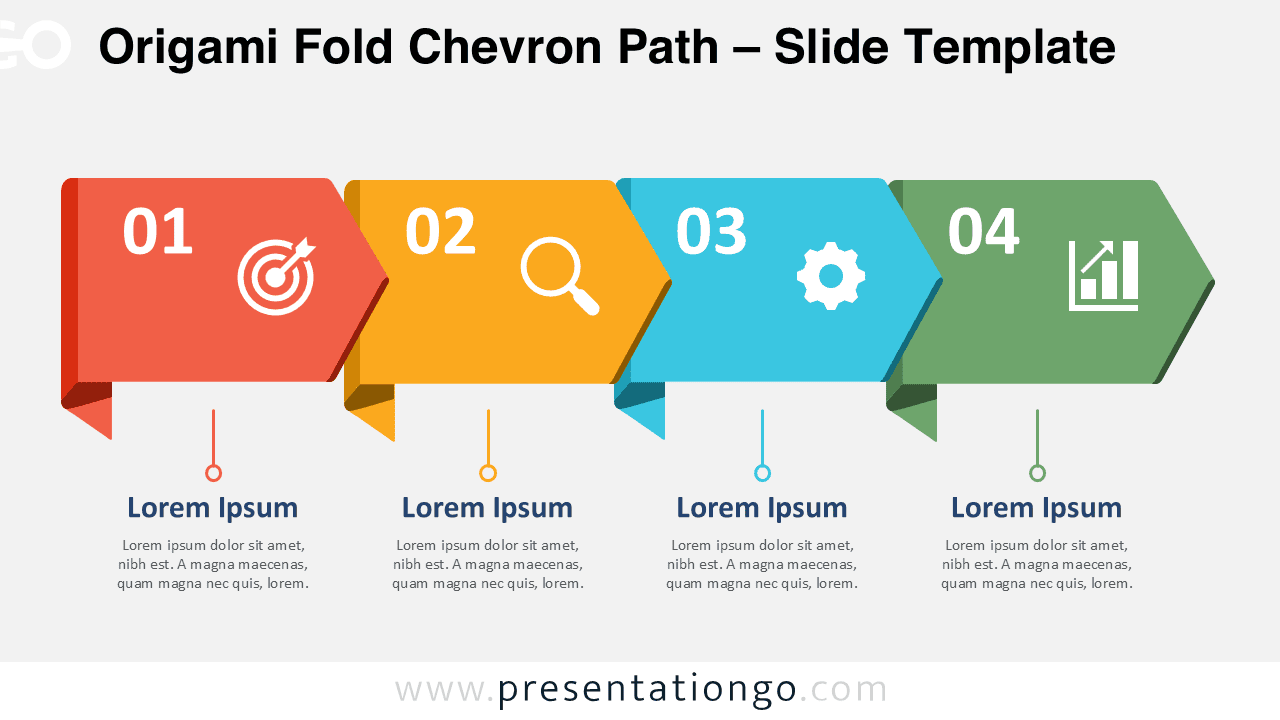
Download the Origami Fold Chevron Path for PowerPoint and Google Slides. Create clear four-step processes with editable shapes, text, and icon placeholders.
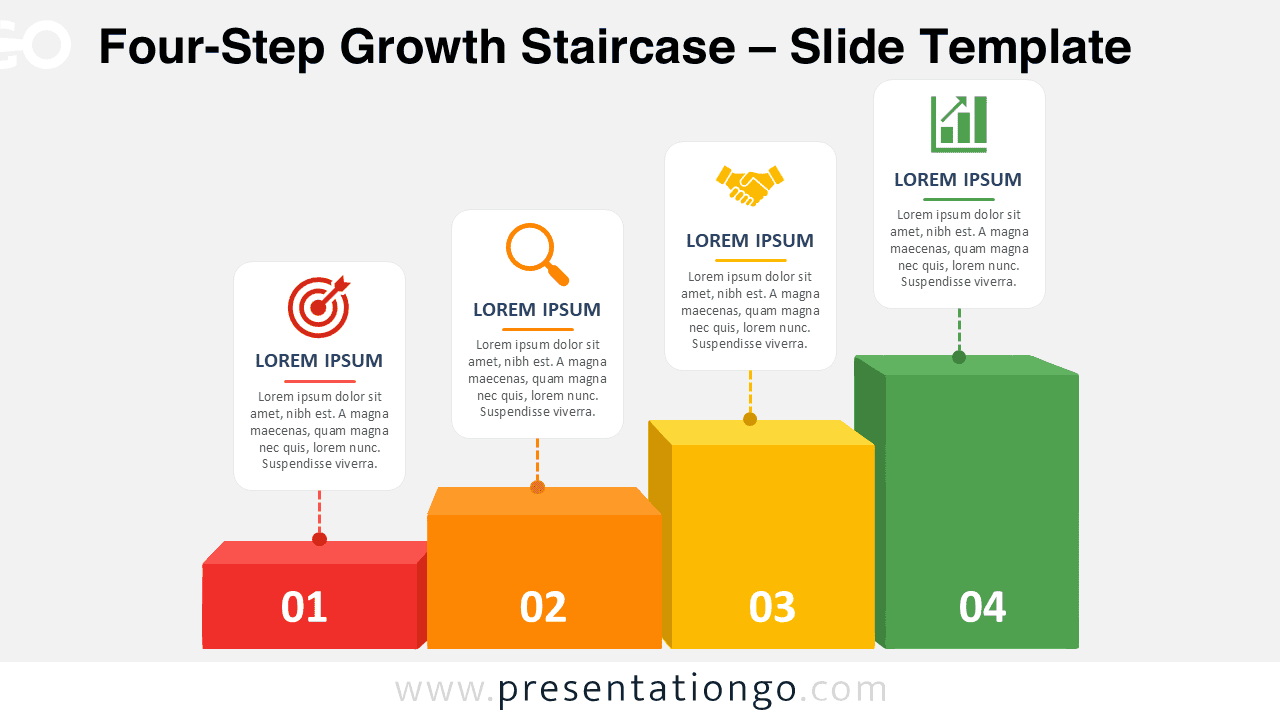
Download the Four-Step Growth Staircase for PowerPoint and Google Slides, featuring four editable stages for growth, funnels, maturity, and progress.
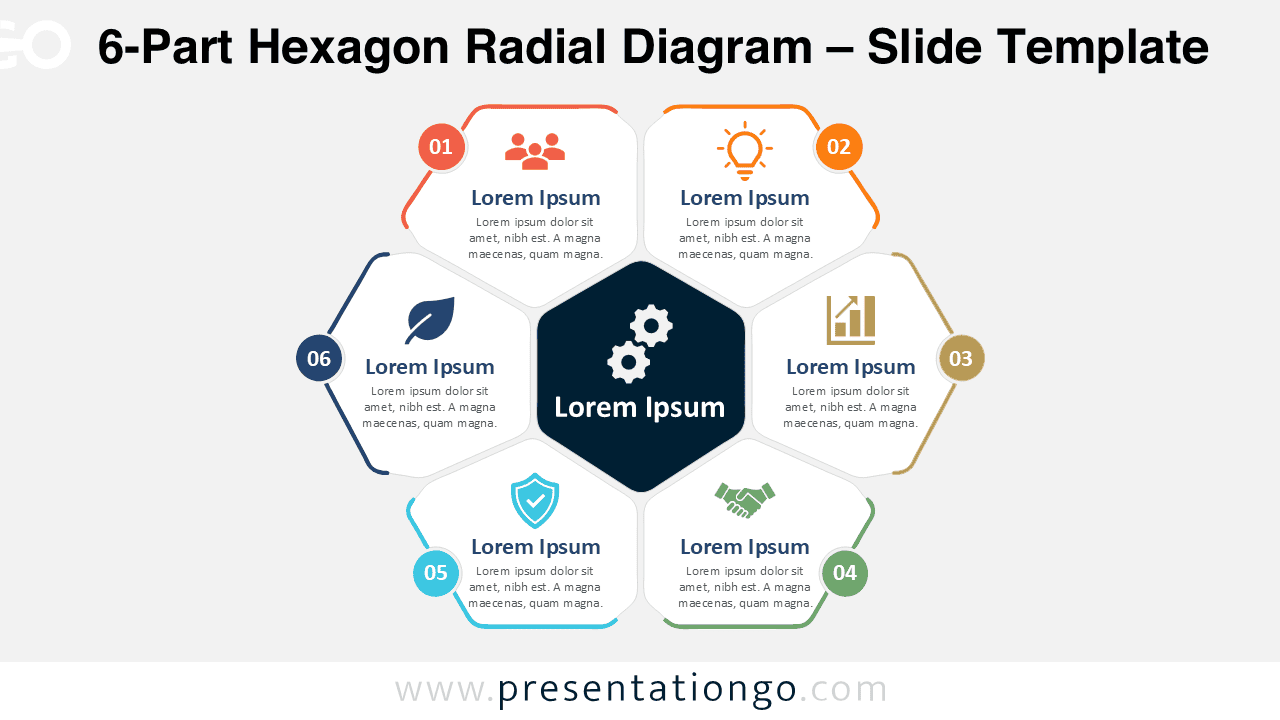
Meta Description 1:Download the 6-Part Hexagon Radial Diagram for PowerPoint and Google Slides. Present six connected ideas, stages, or priorities in an editable layout.
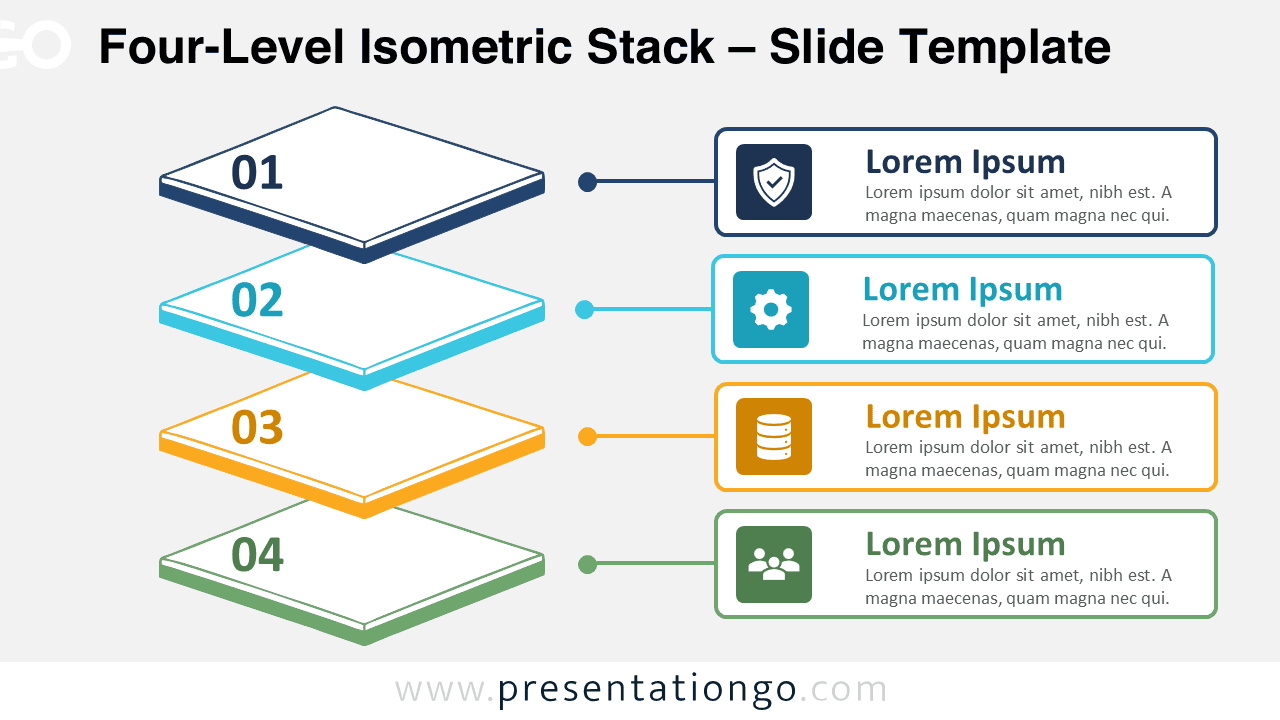
Download the Four-Level Isometric Stack diagram for PowerPoint and Google Slides. Present four hierarchical layers with editable text, shapes, and icons.
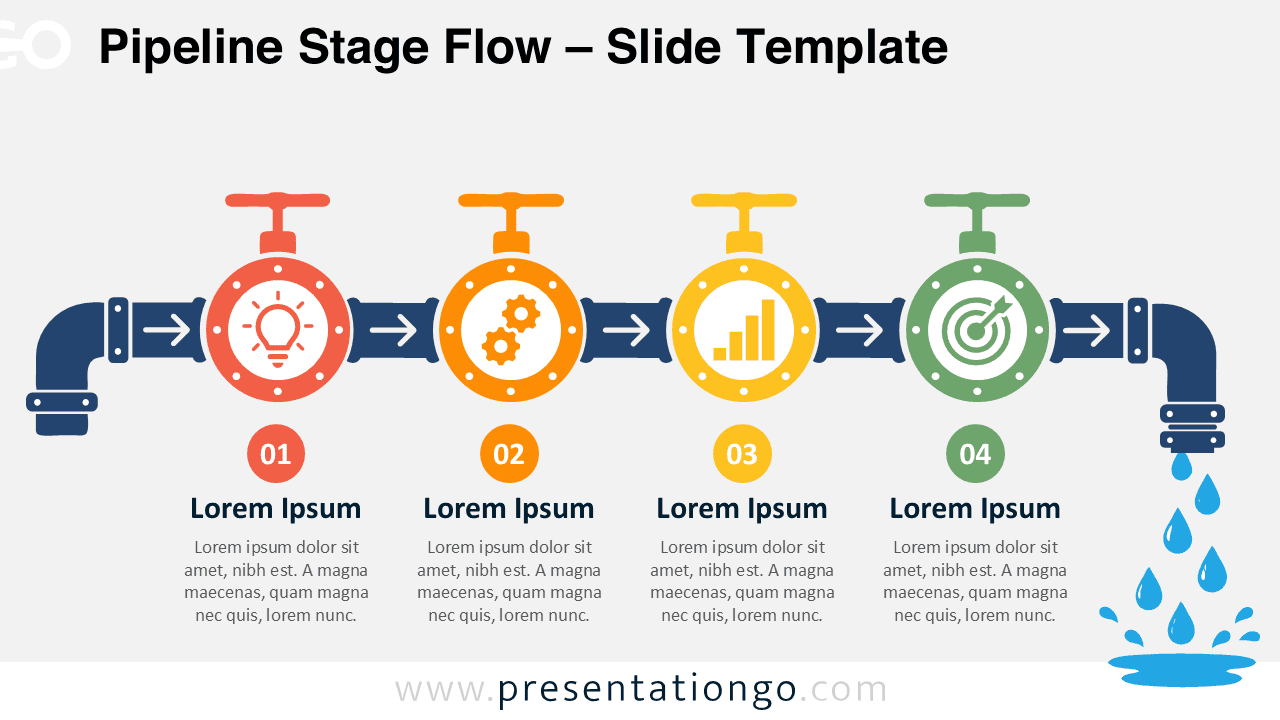
Use the Pipeline Stage Flow diagram to explain four checkpoints, decisions, or milestones with editable elements for PowerPoint and Google Slides presentations.
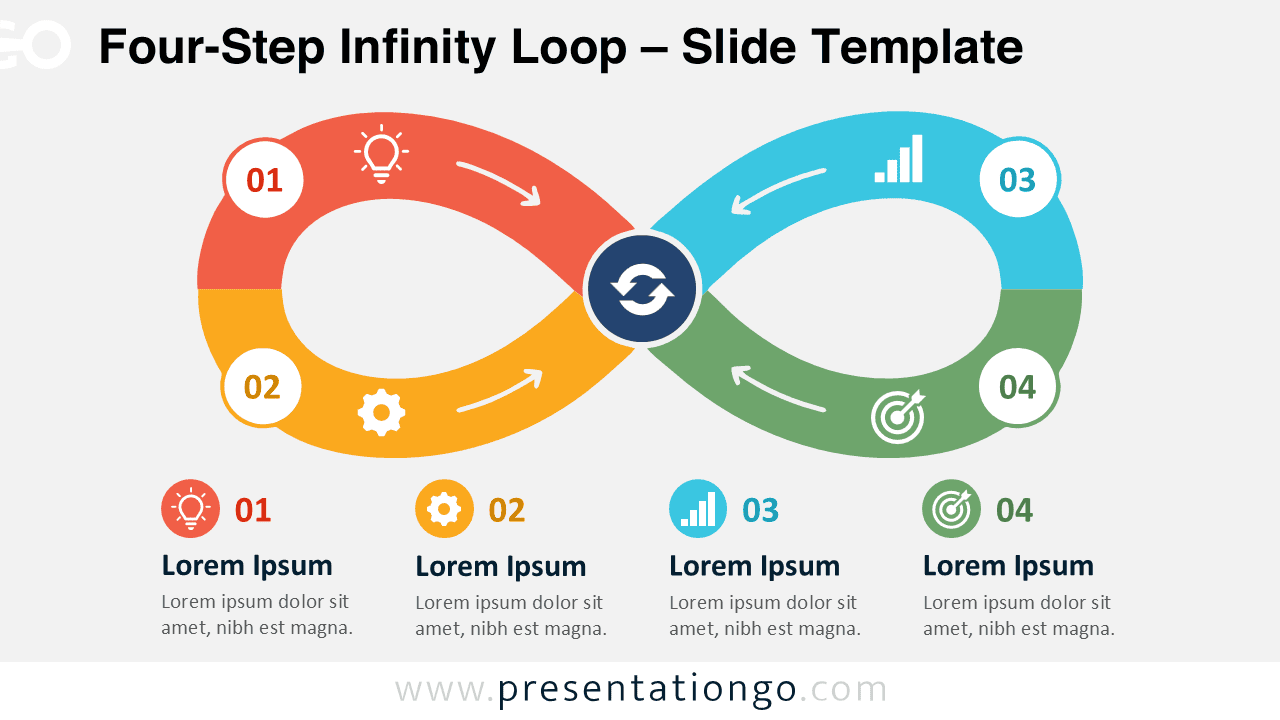
Download the Four-Step Infinity Loop diagram for PowerPoint and Google Slides to present recurring processes, feedback cycles, and continuous improvement.
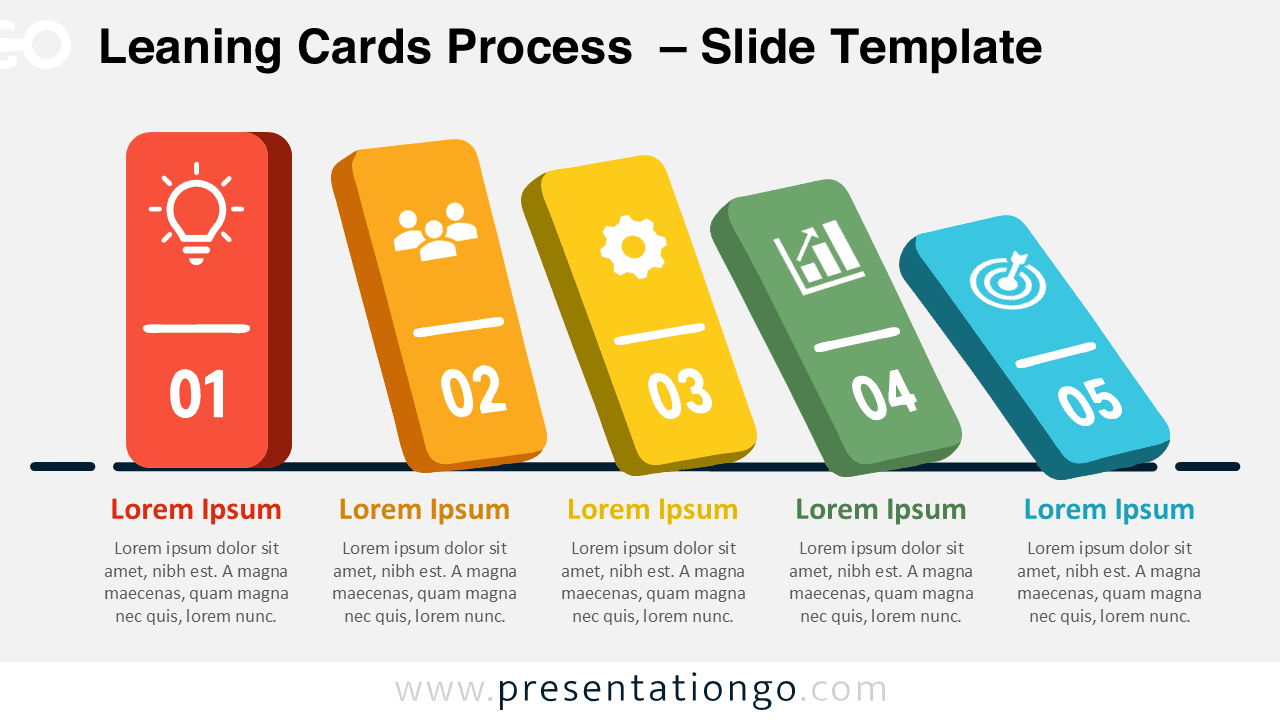
Show a five-step workflow with the Leaning Cards Process diagram for PowerPoint and Google Slides, including editable icons and text blocks.
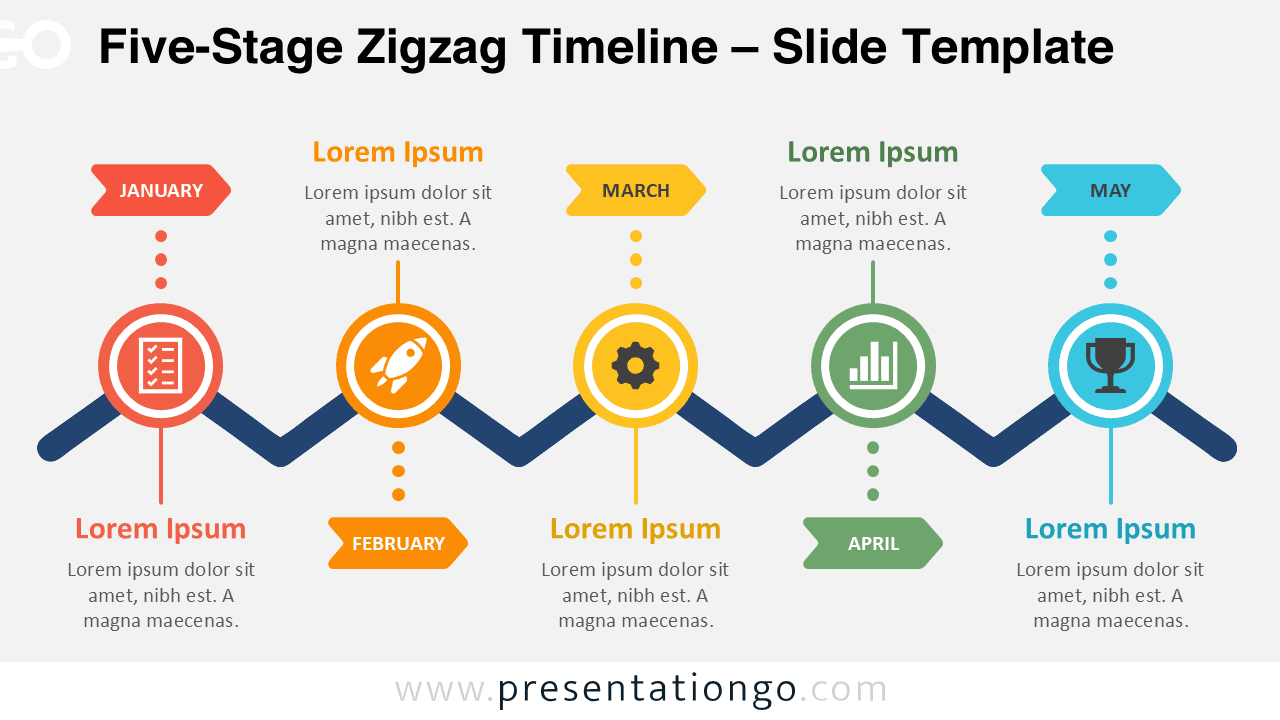
Download the Five-Stage Zigzag Timeline for PowerPoint and Google Slides. Ideal for milestones, roadmaps, and monthly plans.
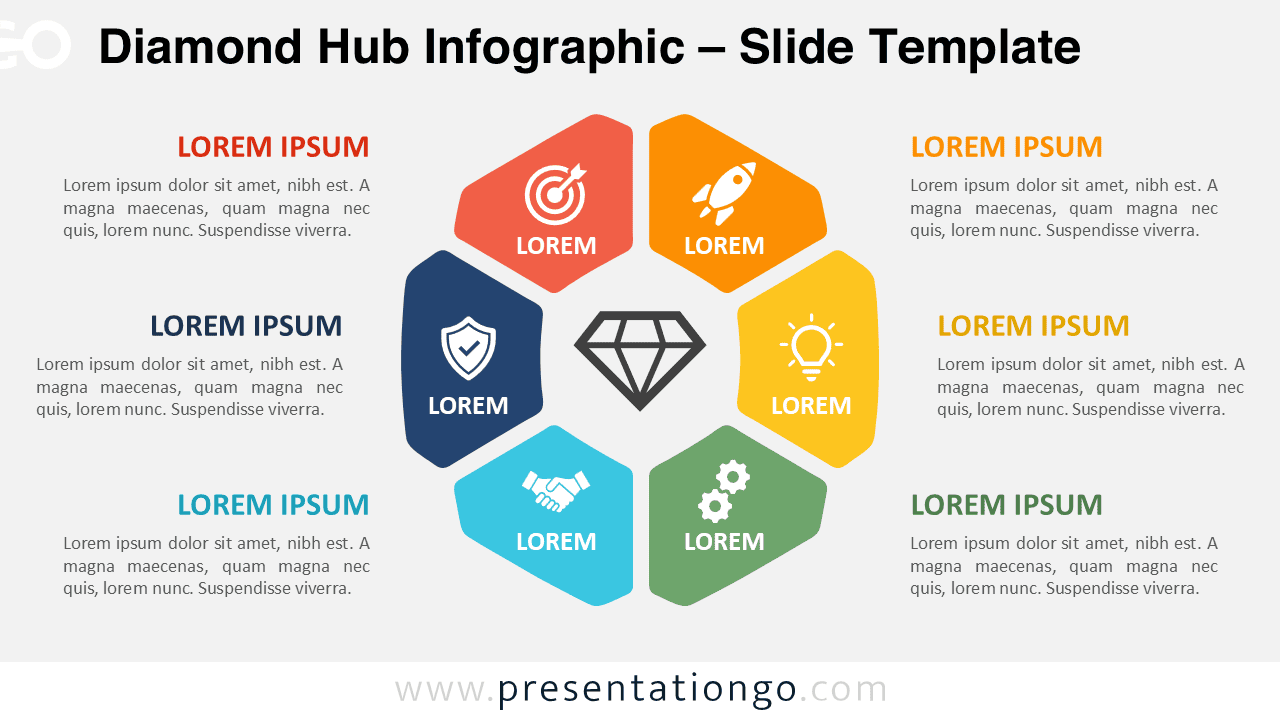
Present six connected priorities around one central idea with the editable Diamond Hub Infographic for PowerPoint and Google Slides.
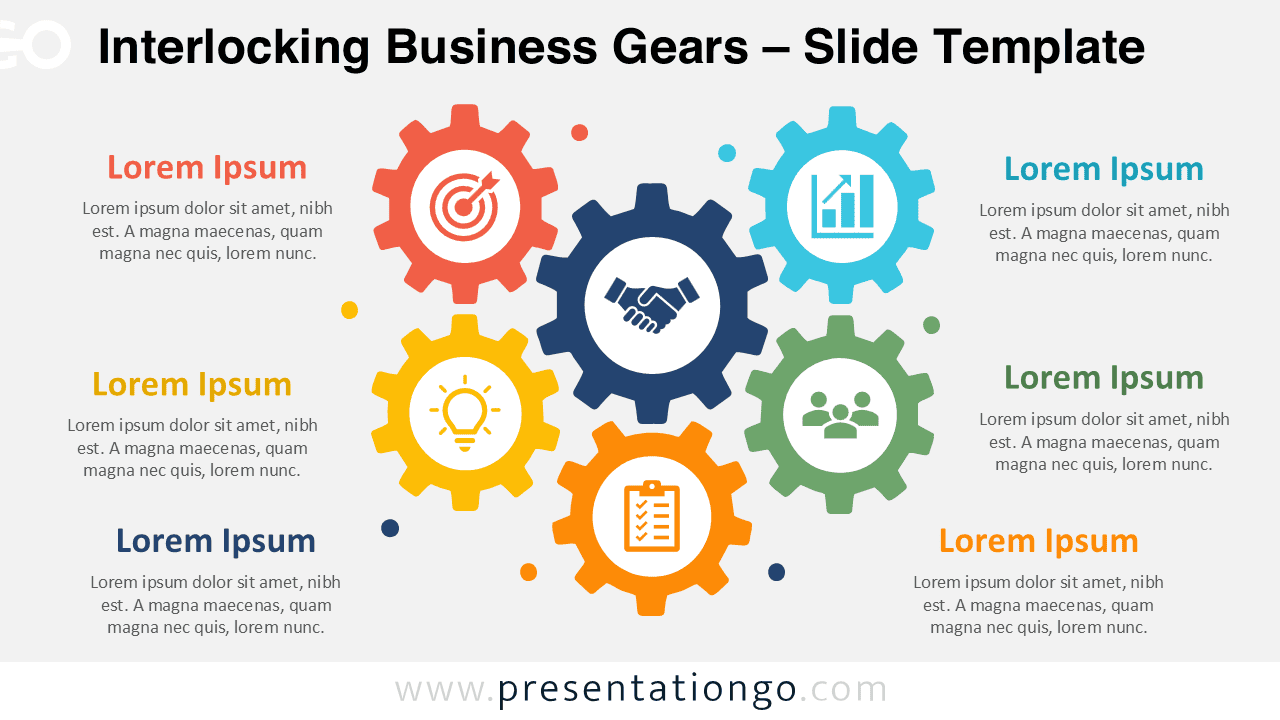
Present connected systems with the Interlocking Business Gears diagram for PowerPoint and Google Slides, featuring editable labels and shapes.
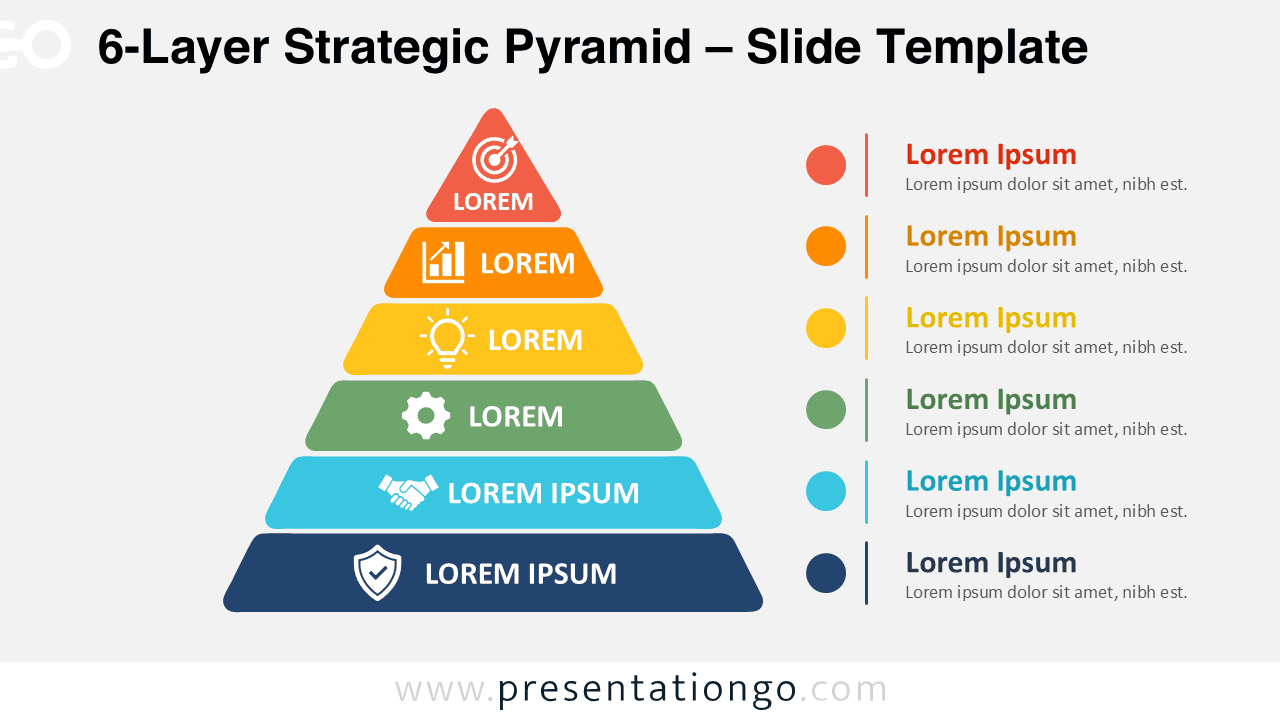
Download the 6-Layer Strategic Pyramid for PowerPoint and Google Slides. Edit six tiers, labels, shapes, and icons to explain complex hierarchies clearly.
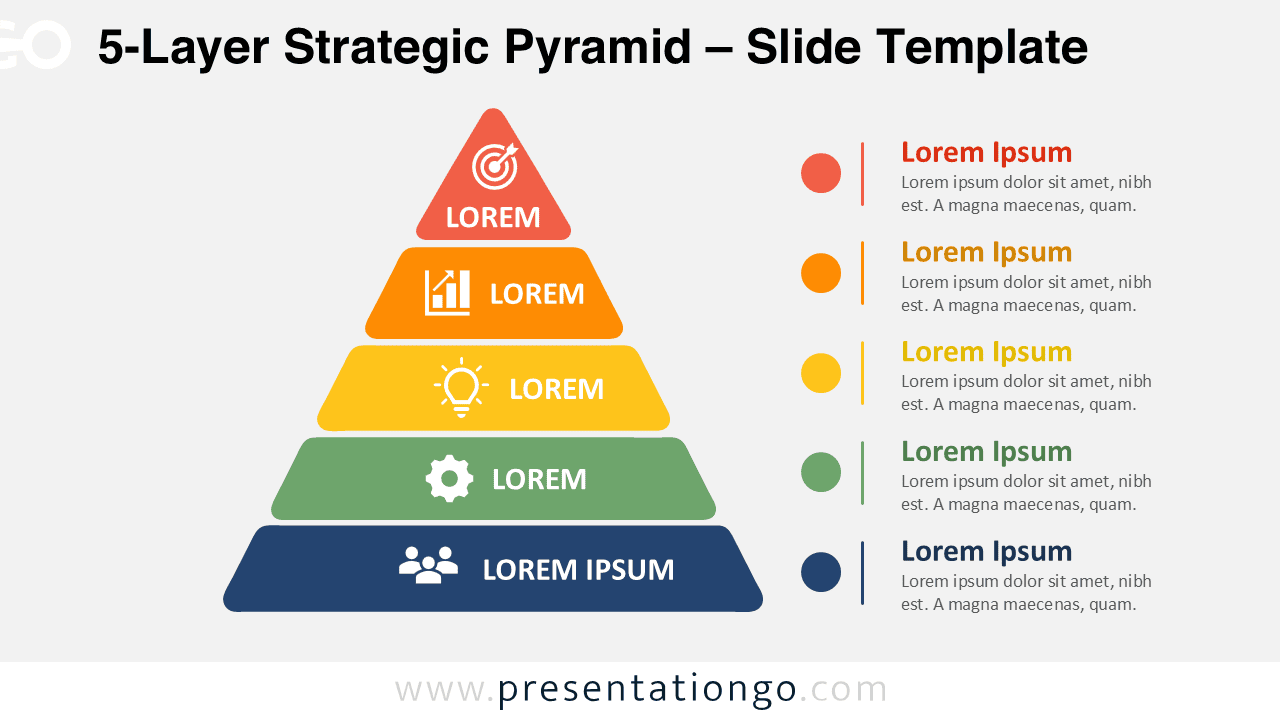
Download the 5-Layer Strategic Pyramid for PowerPoint and Google Slides. Edit every tier, label, shape, and icon to explain structured business hierarchies.
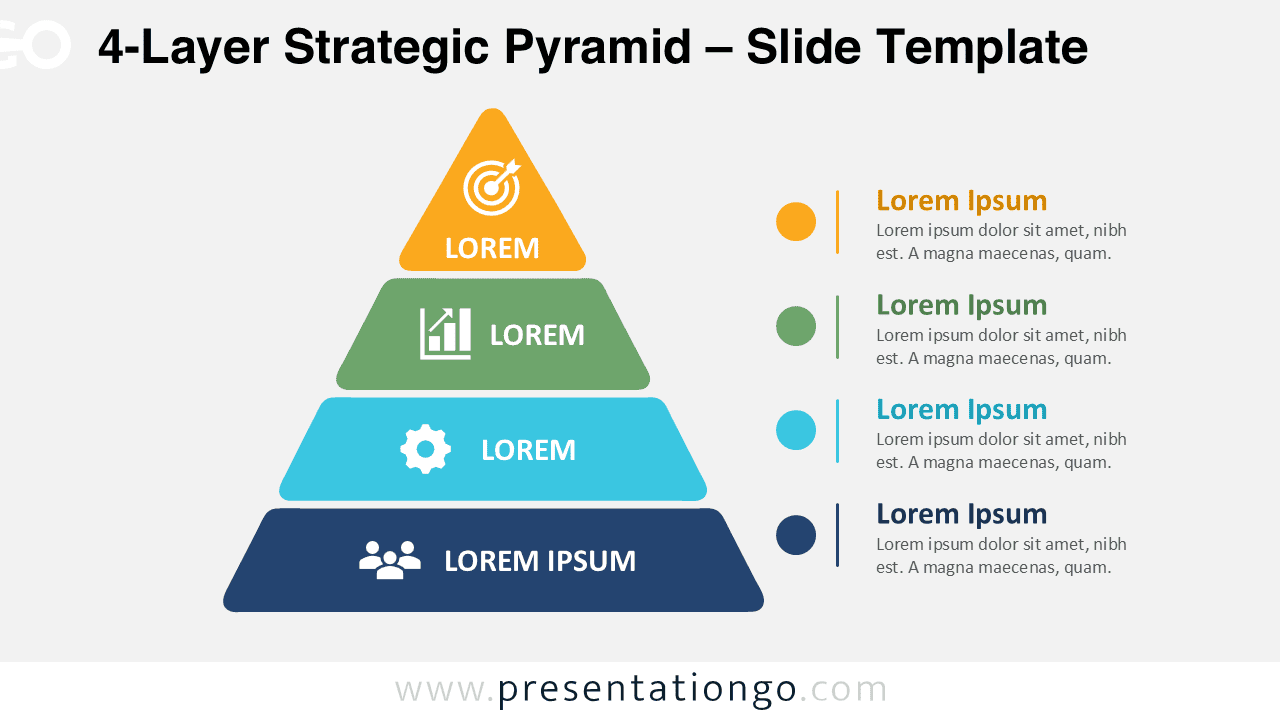
Download the 4-Layer Strategic Pyramid for PowerPoint and Google Slides. Edit each tier, label, shape, and icon to present clear hierarchies and levels.
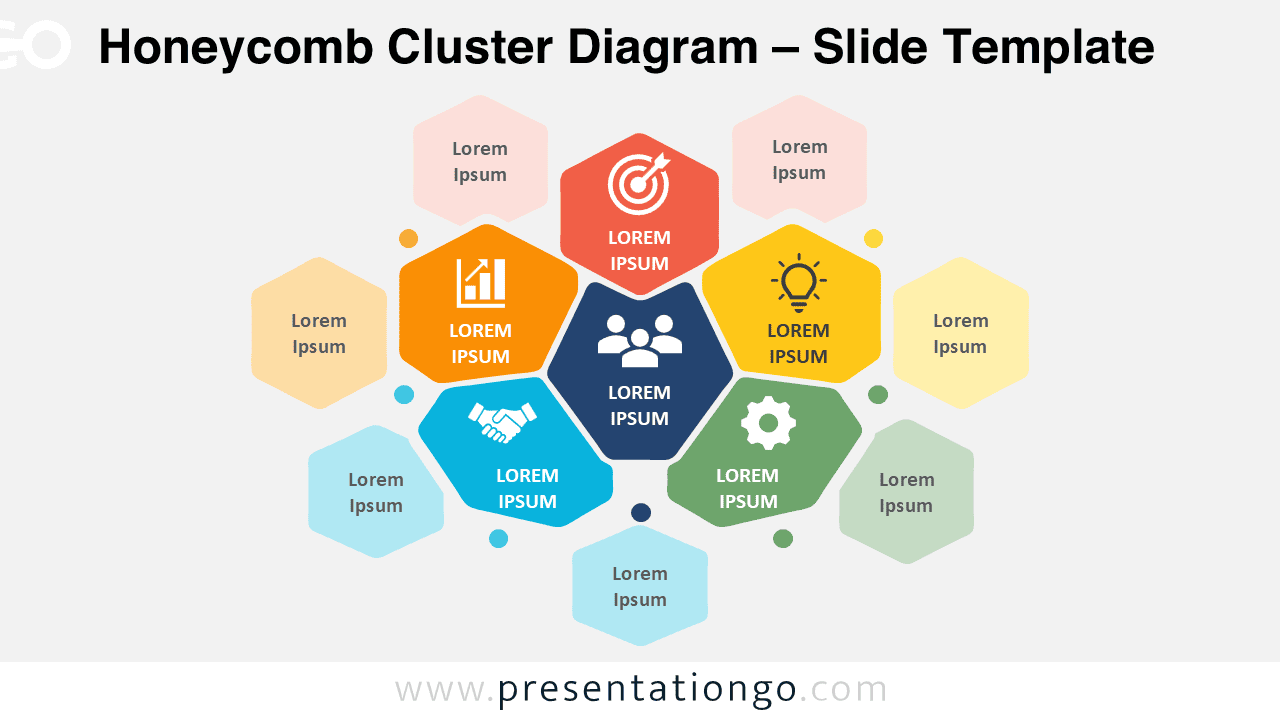
Download this Honeycomb Cluster Diagram for PowerPoint and Google Slides to present related ideas, business ecosystems, features, or strategic connections.
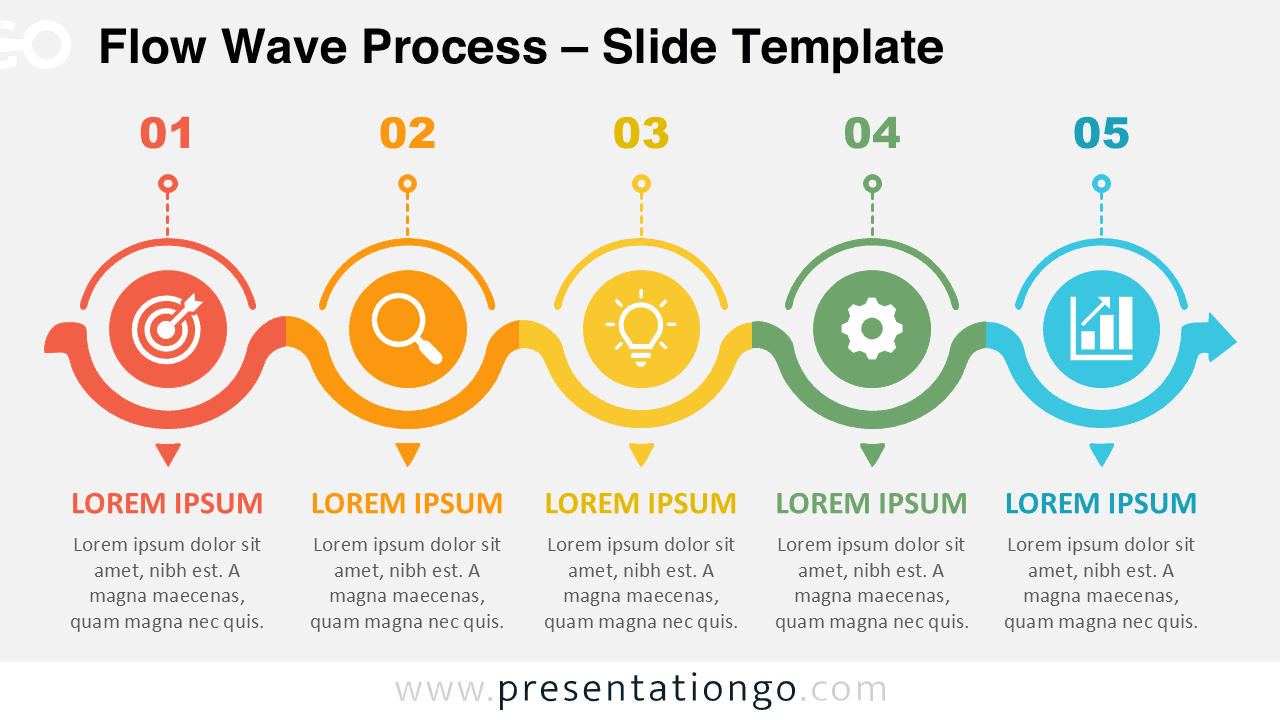
Download the Flow Wave Process diagram for PowerPoint and Google Slides. Present five connected stages with editable shapes, text, and icons.
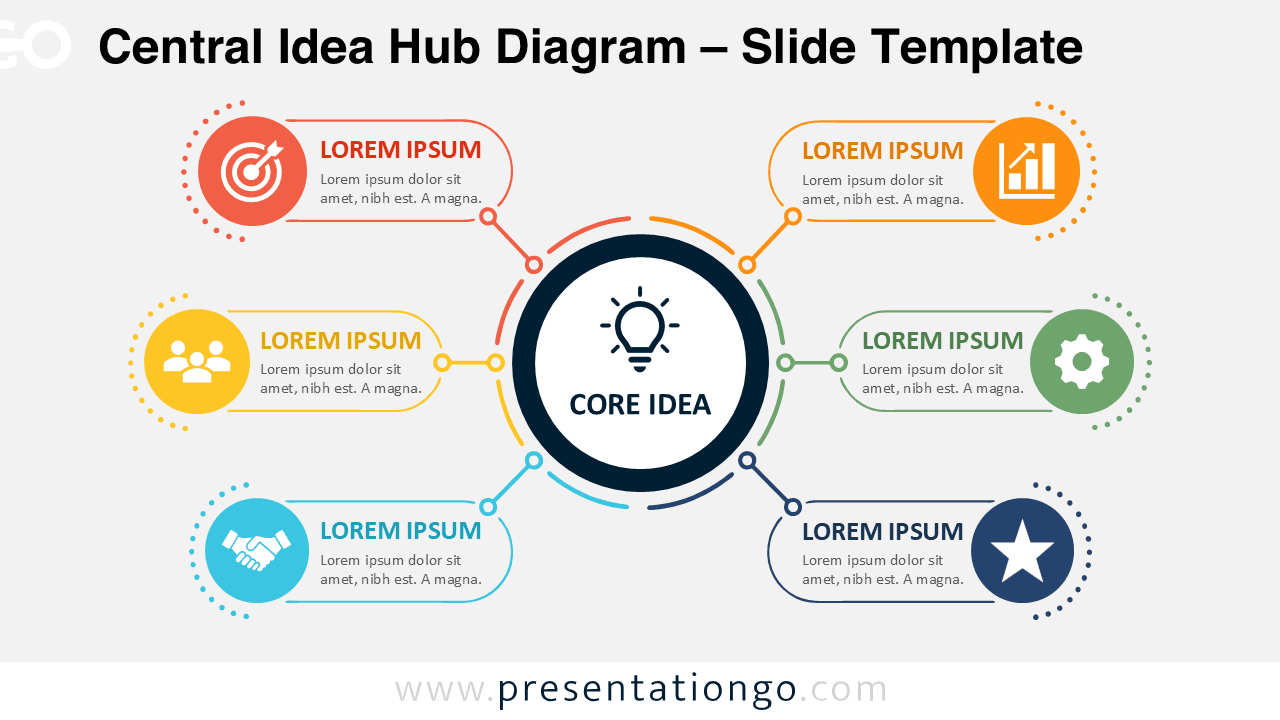
Download the Central Idea Hub Diagram for PowerPoint and Google Slides. Present six connected topics around one clear, editable central concept.
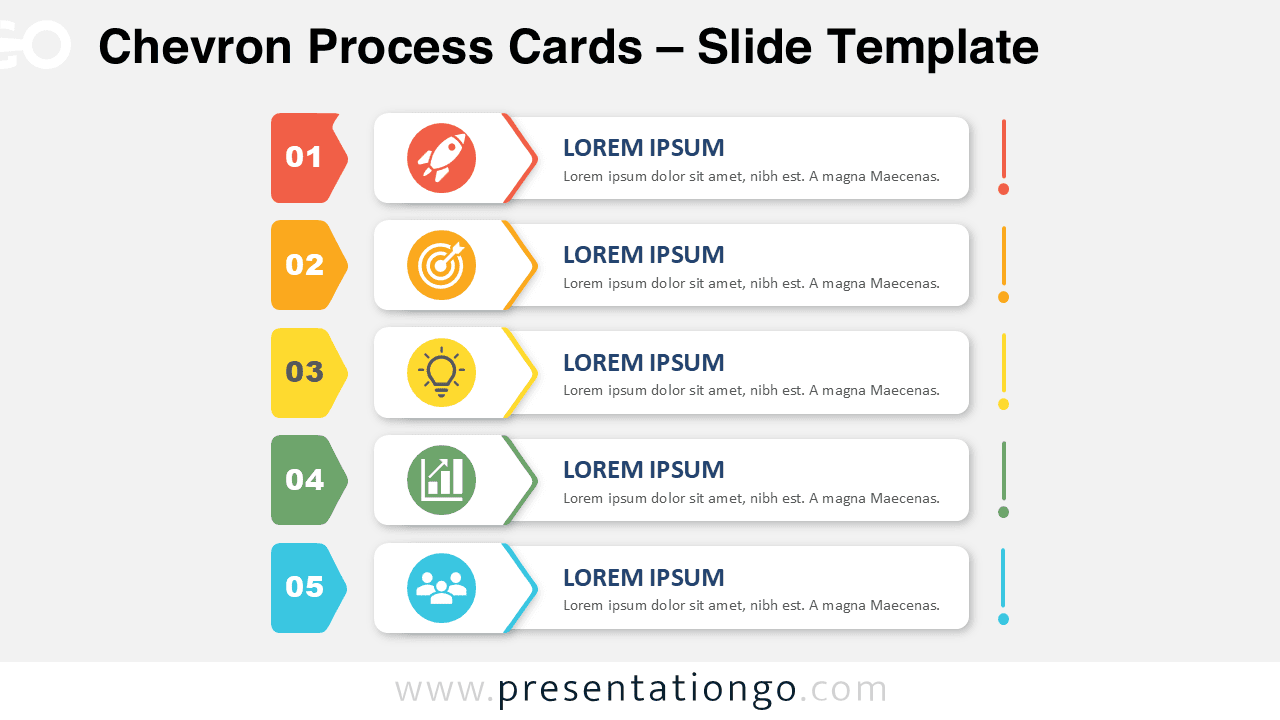
Download Chevron Process Cards for PowerPoint and Google Slides. Present five clear steps with editable text, shapes, and Office library icons.
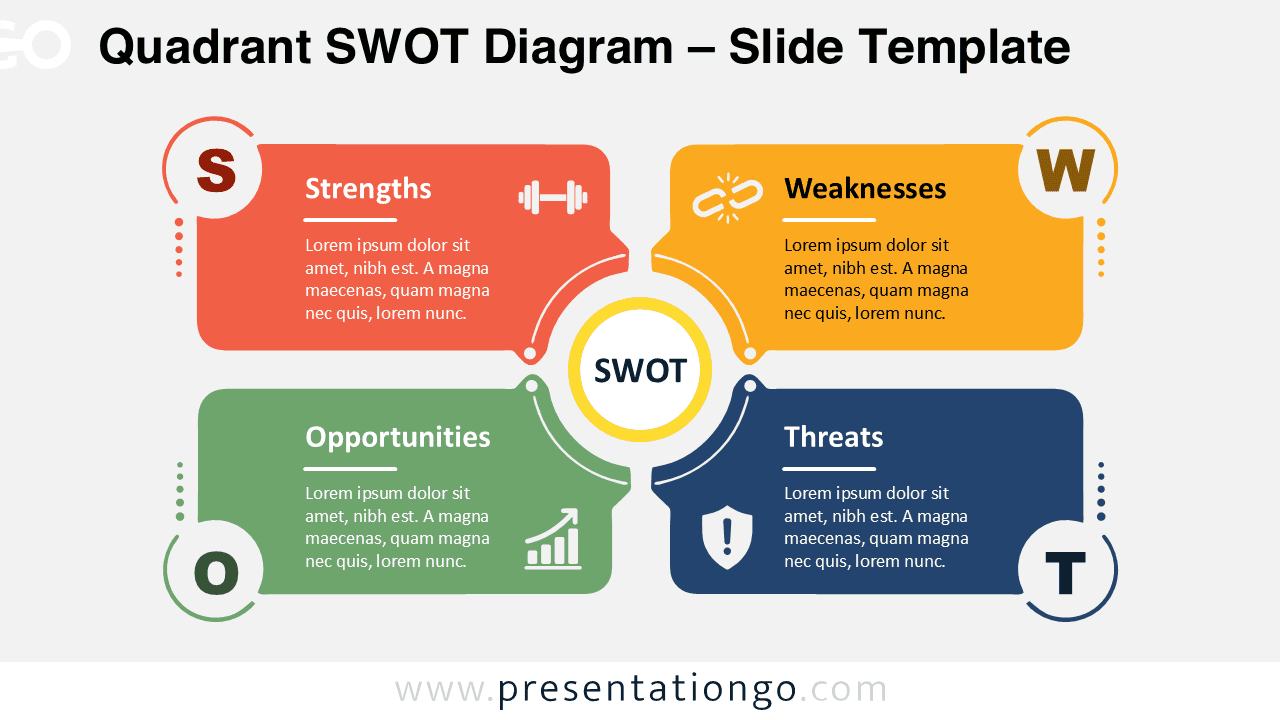
Download this Quadrant SWOT Diagram for PowerPoint and Google Slides. Present strengths, weaknesses, opportunities, and threats in a clear layout.