Loading resources…
Total 1760 resources
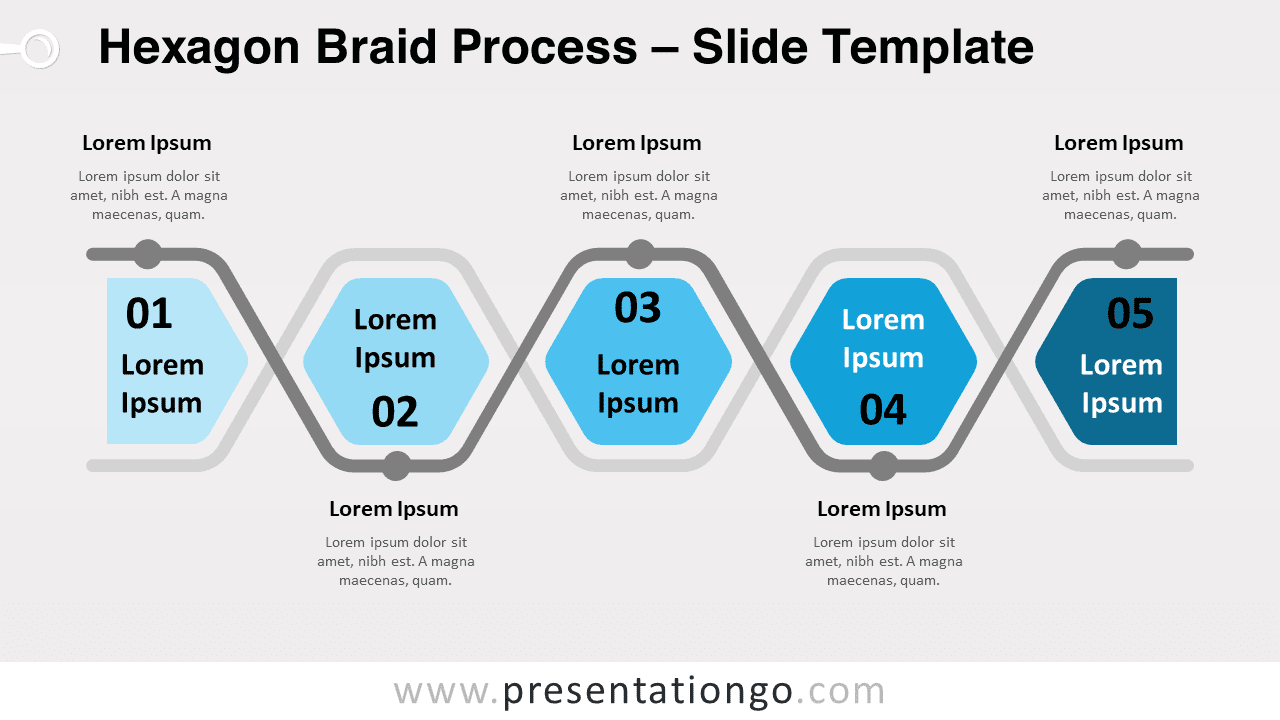
Free hexagon braid process for PowerPoint and Google Slides. Two horizontal lines interlacing and forming a series of hexagons.
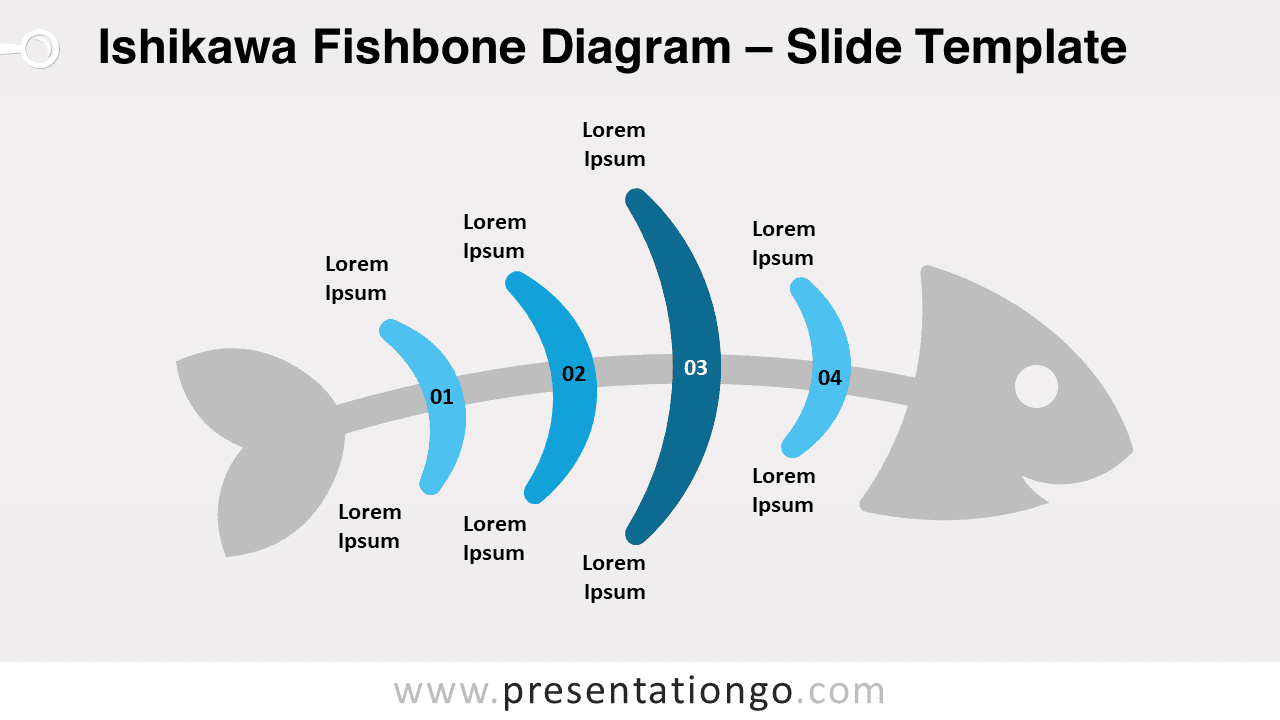
Free Ishikawa fishbone diagram for PowerPoint and Google Slides. A visual metaphor for cause and effect analysis. Editable graphics.
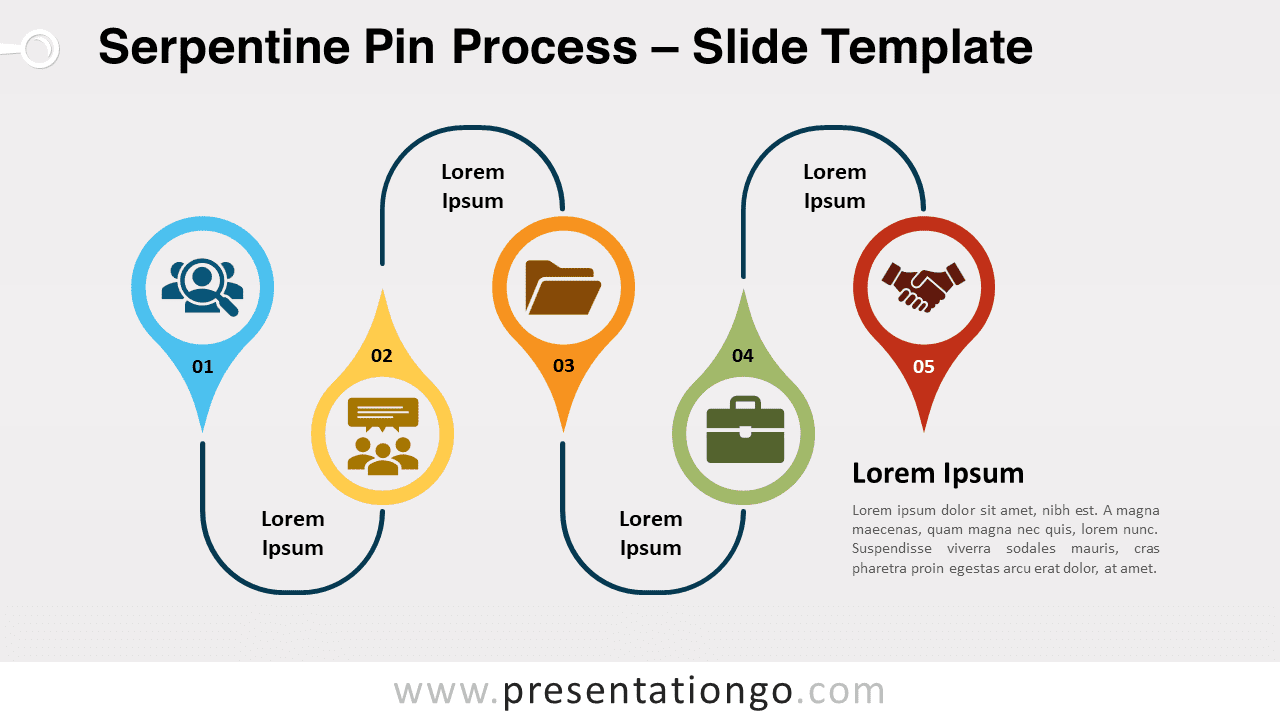
Free serpentine pin process for PowerPoint and Google Slides. A serpentine line connecting a series of up-and-down pins. Editable graphics.
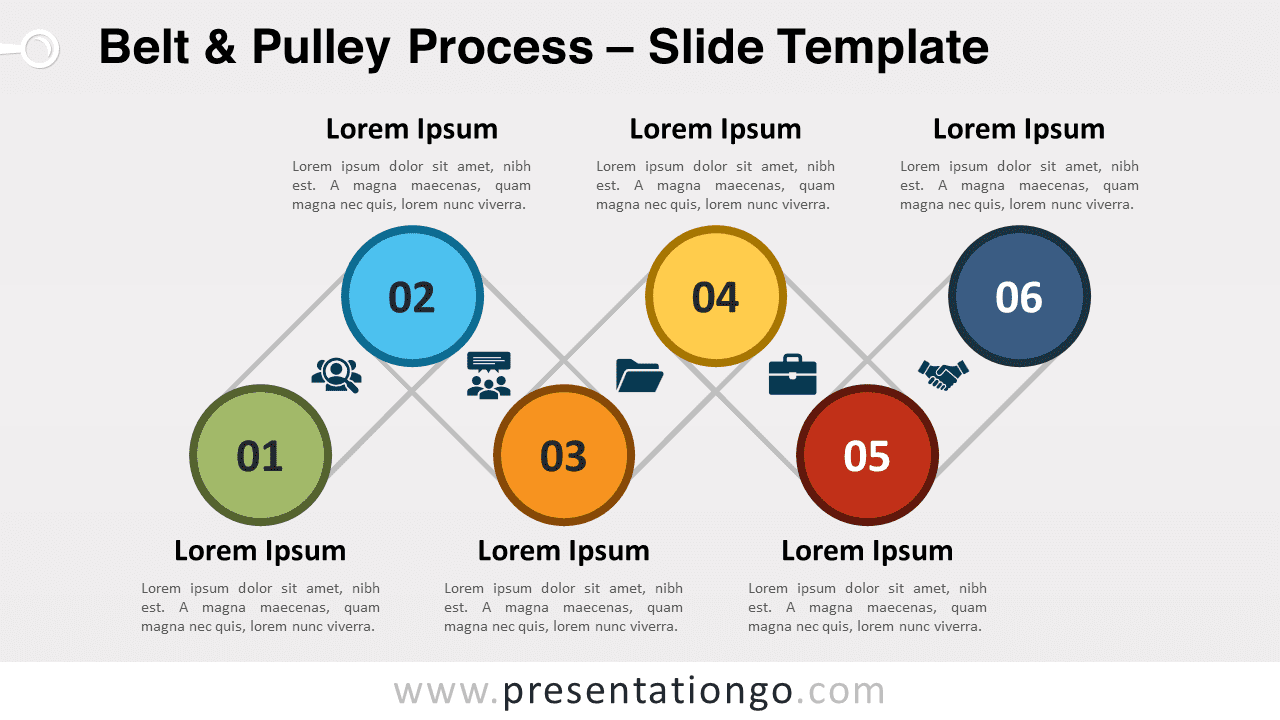
Free belt and pulley process for PowerPoint and Google Slides. An original 6-step alternating process diagram. Editable graphics.
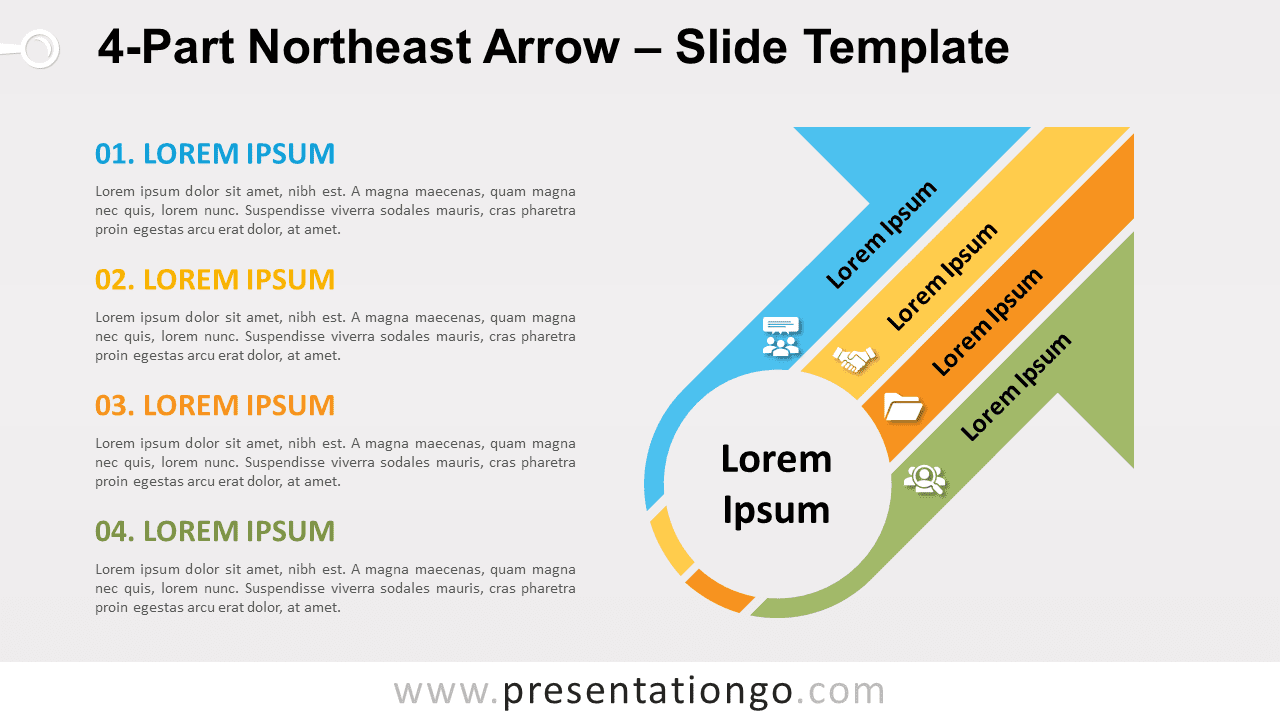
Free 4-part Northeast arrow for PowerPoint and Google Slides. An up-right arrow with 4 bands or stripes. Completely editable graphics.
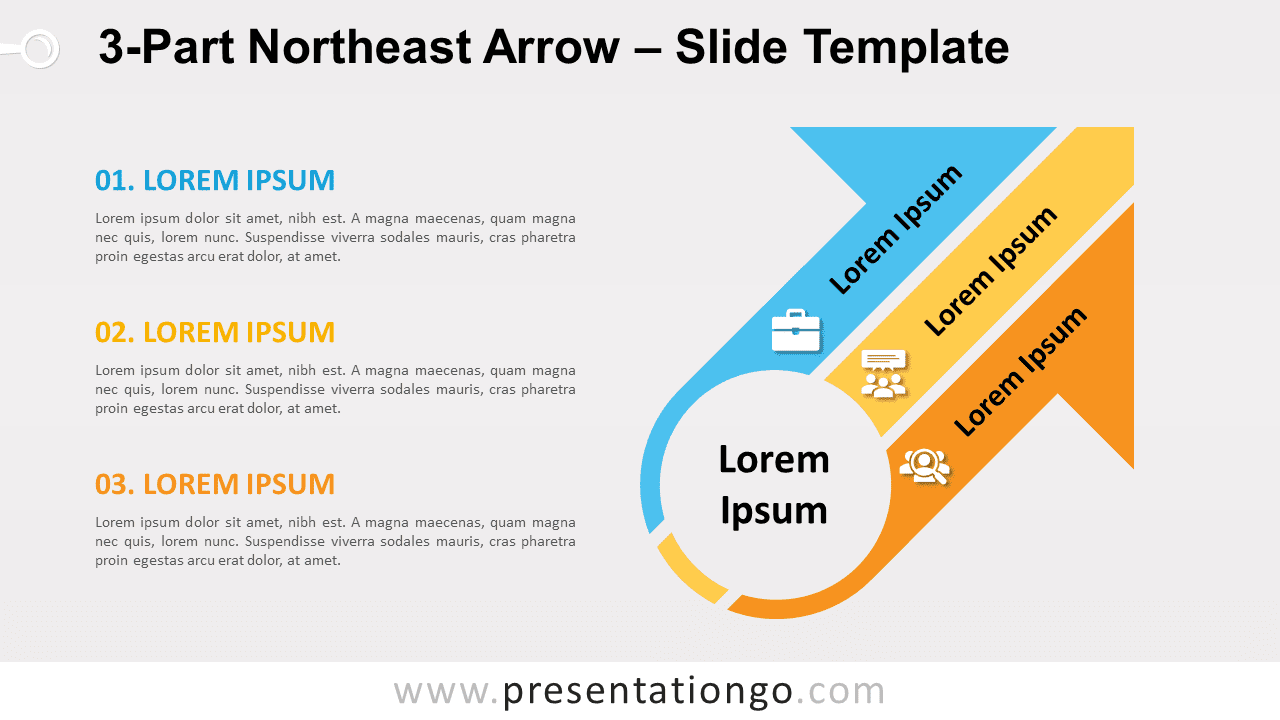
Free 3-part Northeast arrow for PowerPoint and Google Slides. An up-right arrow with 3 bands or stripes. Completely editable graphics.
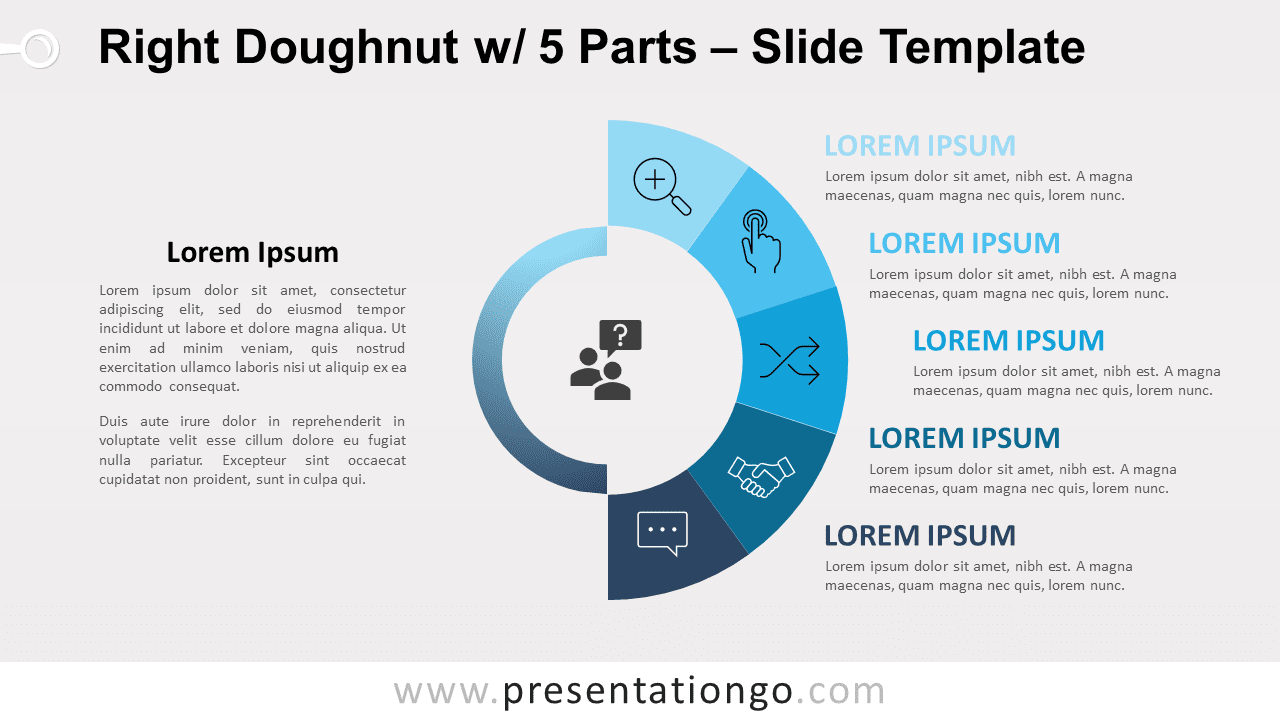
Free right doughnut with 5 parts for PowerPoint and Google Slides. A semicircular pie chart with 5 equal parts. Editable graphics.
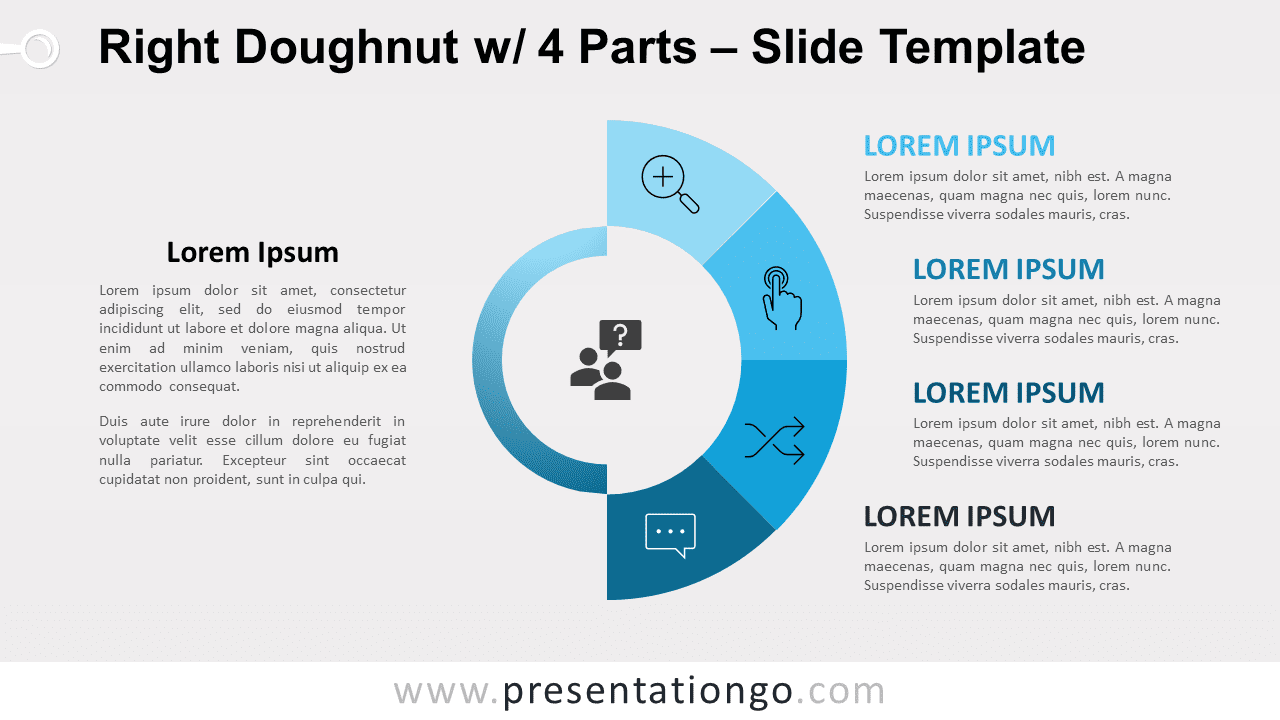
Free right doughnut with 4 parts for PowerPoint and Google Slides. A semicircular pie chart with 4 equal parts. Editable graphics.
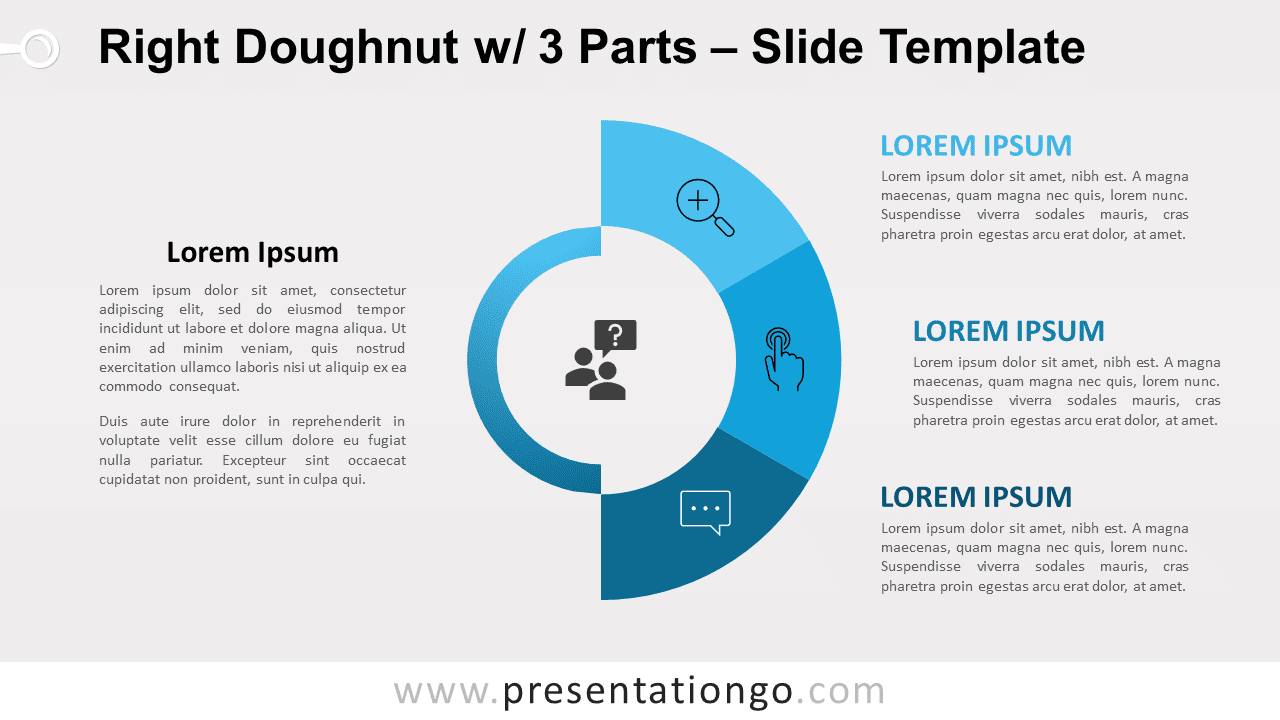
Free right doughnut with 3 parts for PowerPoint and Google Slides. A semicircular pie chart with 3 equal parts. Editable graphics.
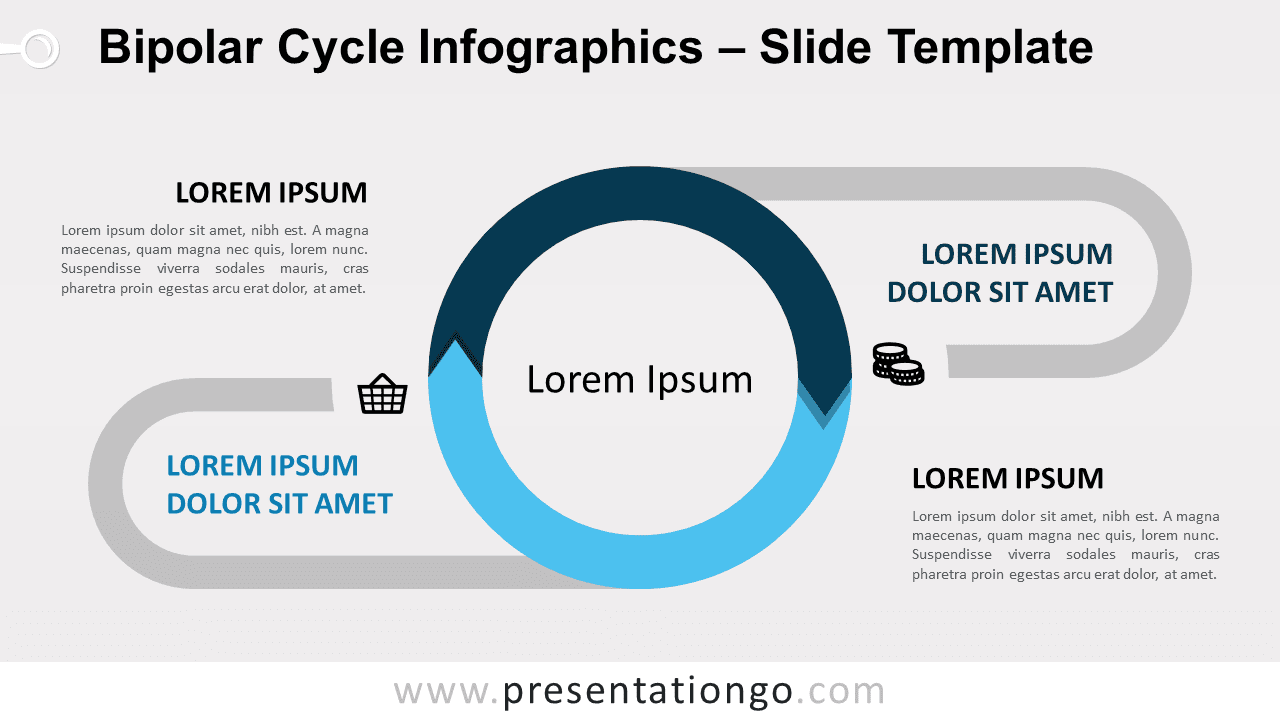
Free bipolar cycle infographics for PowerPoint and Google Slides. A stylish cycle graphic to showcase 2 ideas. Editable graphics.
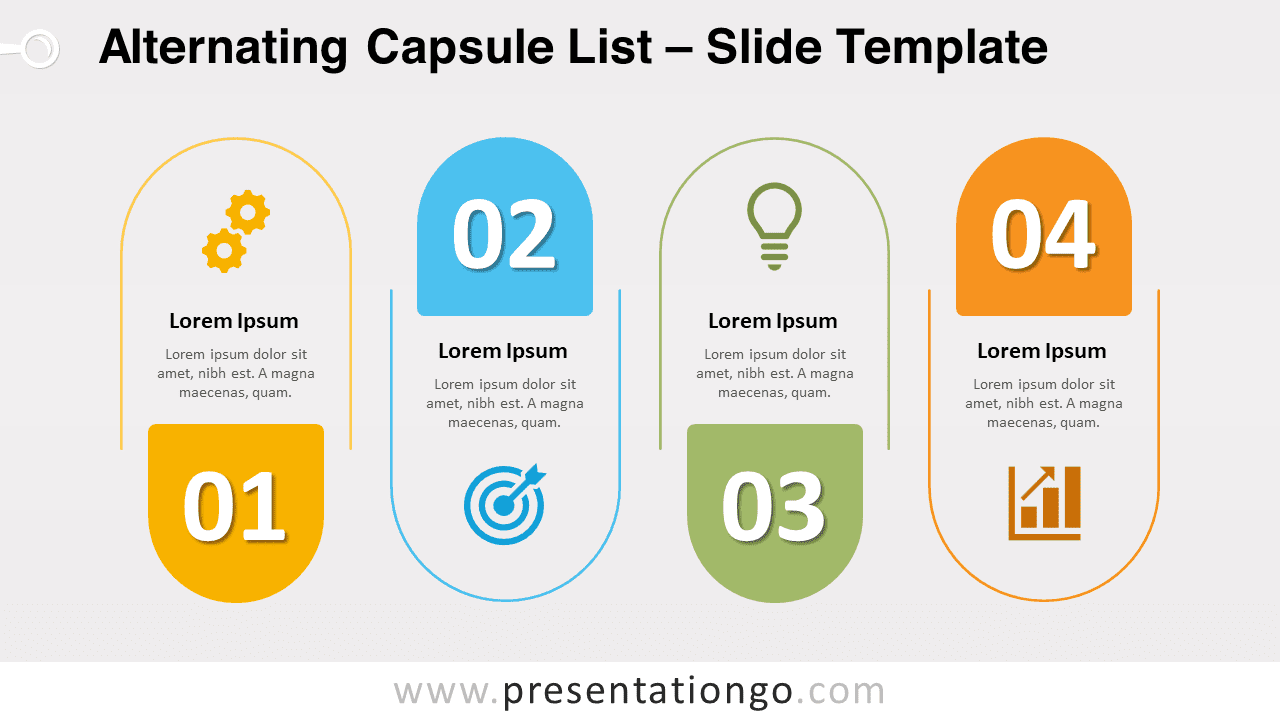
Free alternating capsule list for PowerPoint and Google Slides. An up and down series of pill-shape elements with numbers and icons.
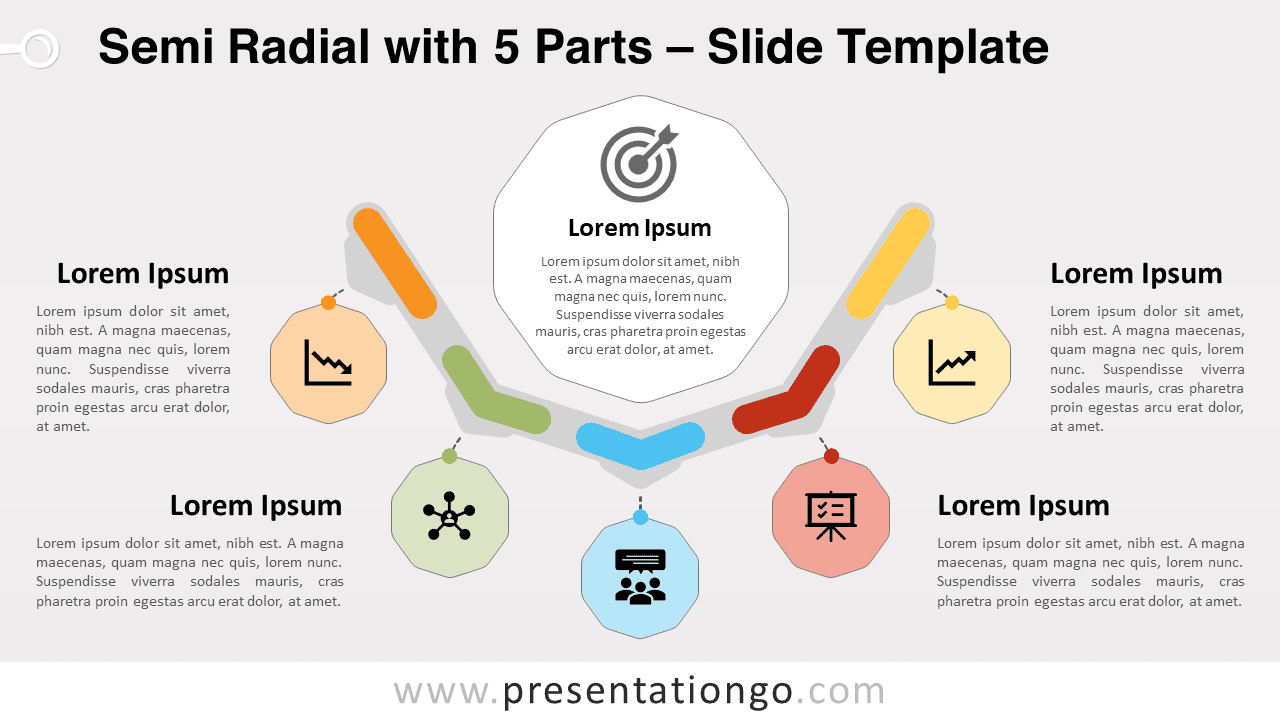
Free semi radial with 5 Parts for PowerPoint and Google Slides. Five elements that relate to a central idea. Editable graphics.
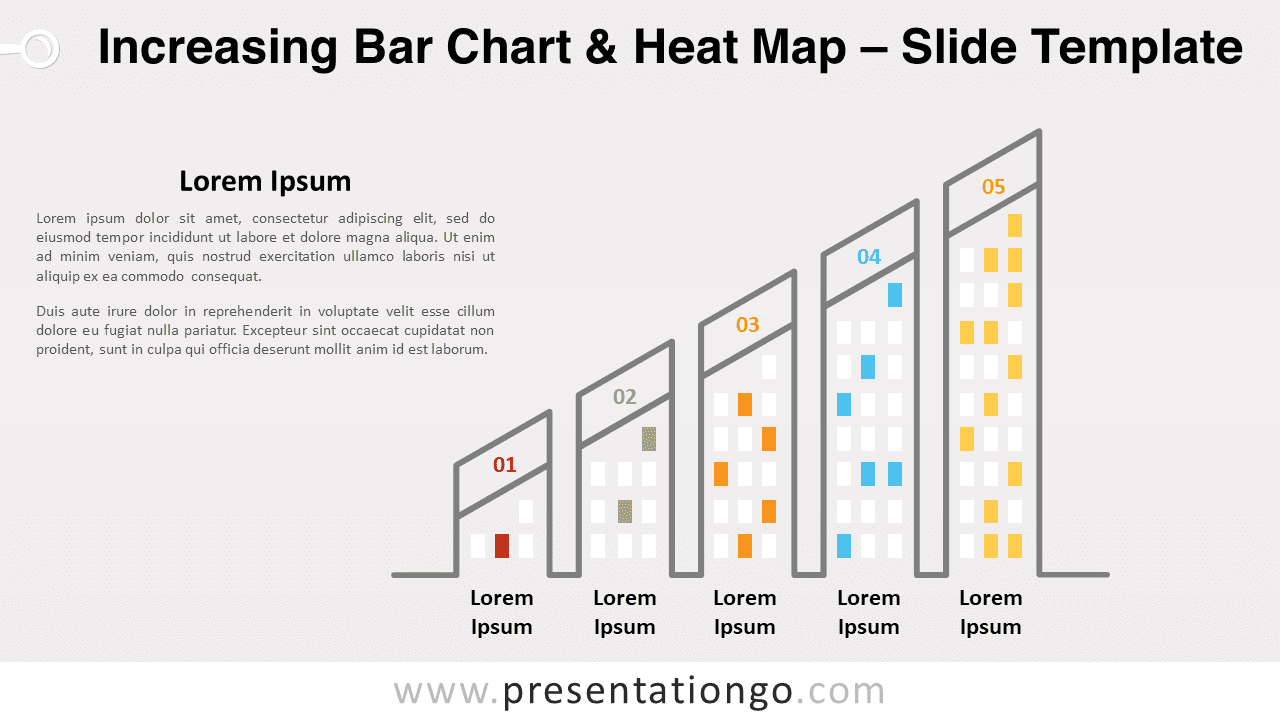
Free increasing bar chart and heat map for PowerPoint and Google Slides. An editable graphic combining a column chart with heatmap.
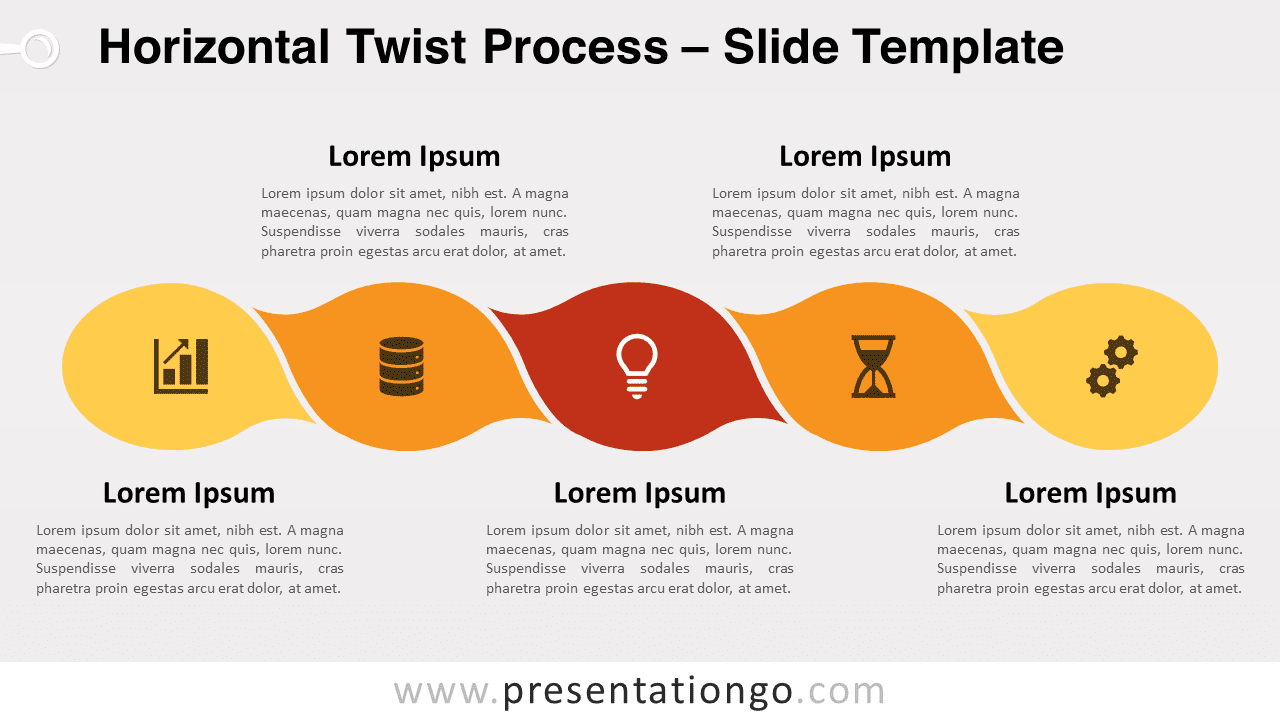
Free horizontal twist process for PowerPoint and Google Slides. A twisted rope look-alike process diagram. Editable graphics.
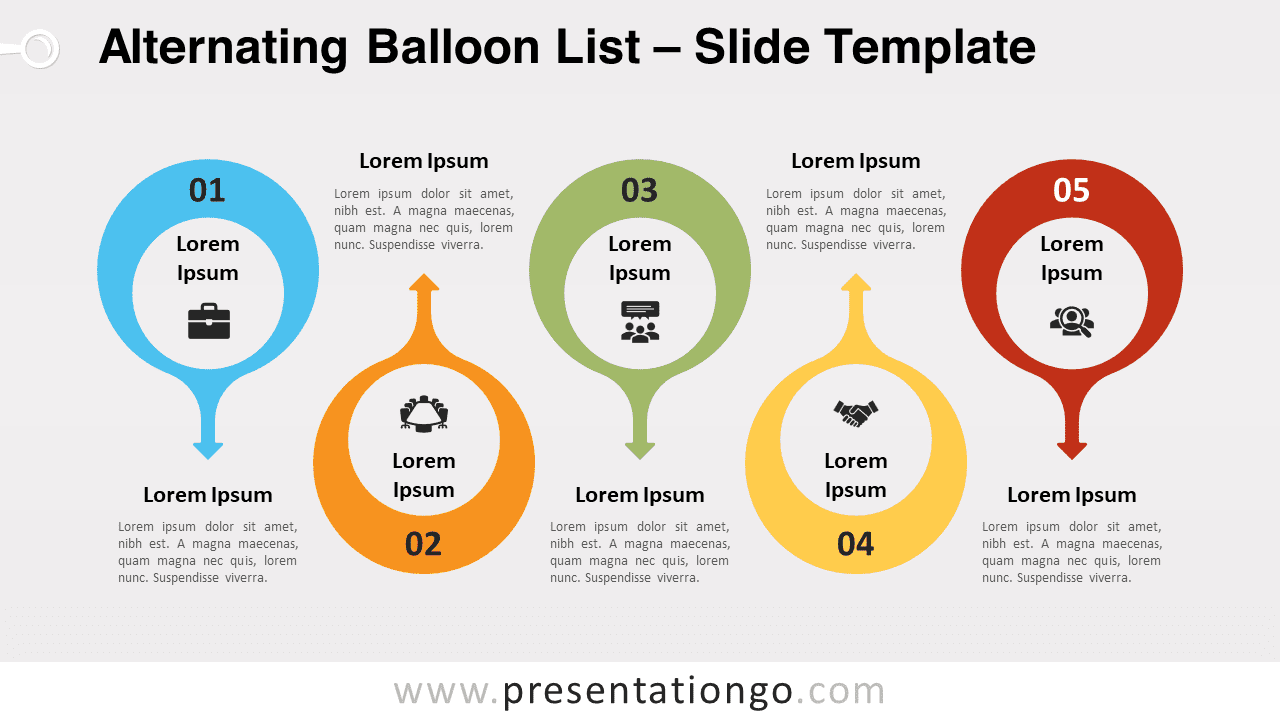
Free alternating balloon list for PowerPoint and Google Slides. An up and down series of round shapes. Use as a process or a numbered list.
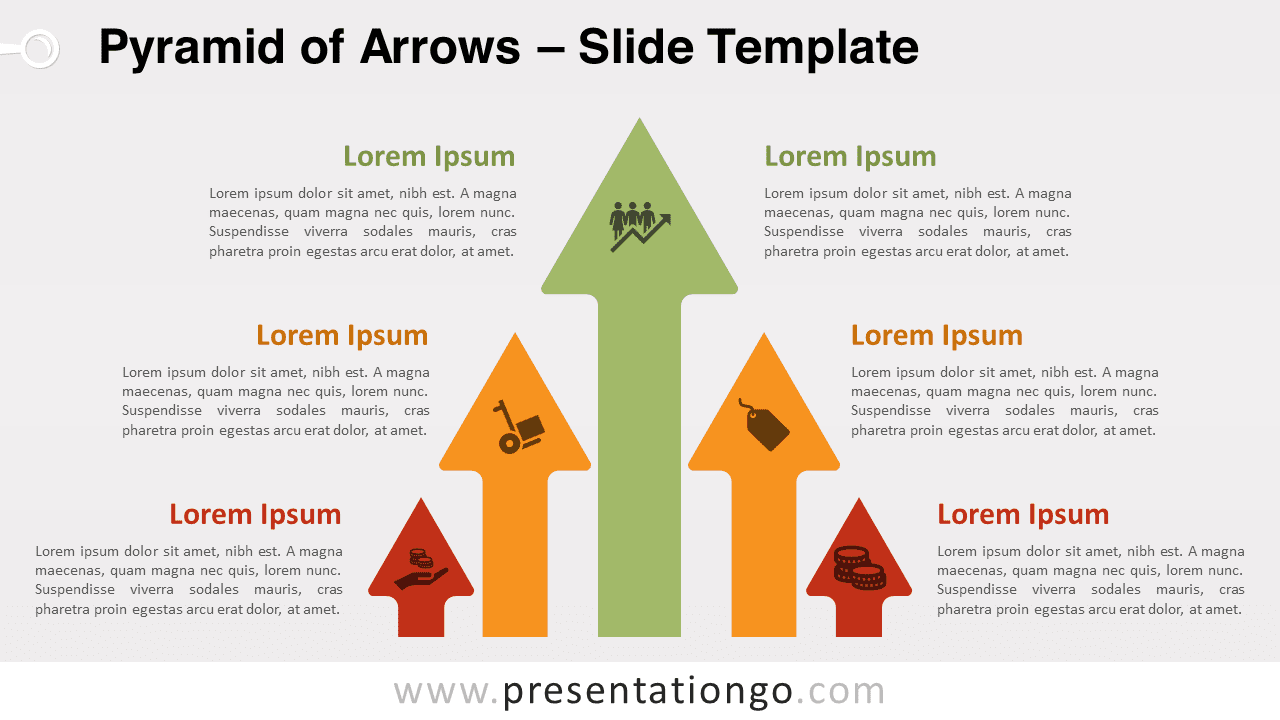
Free pyramid arrows for PowerPoint and Google Slides. A series of increasing and decreasing upward arrows forming a pyramid.
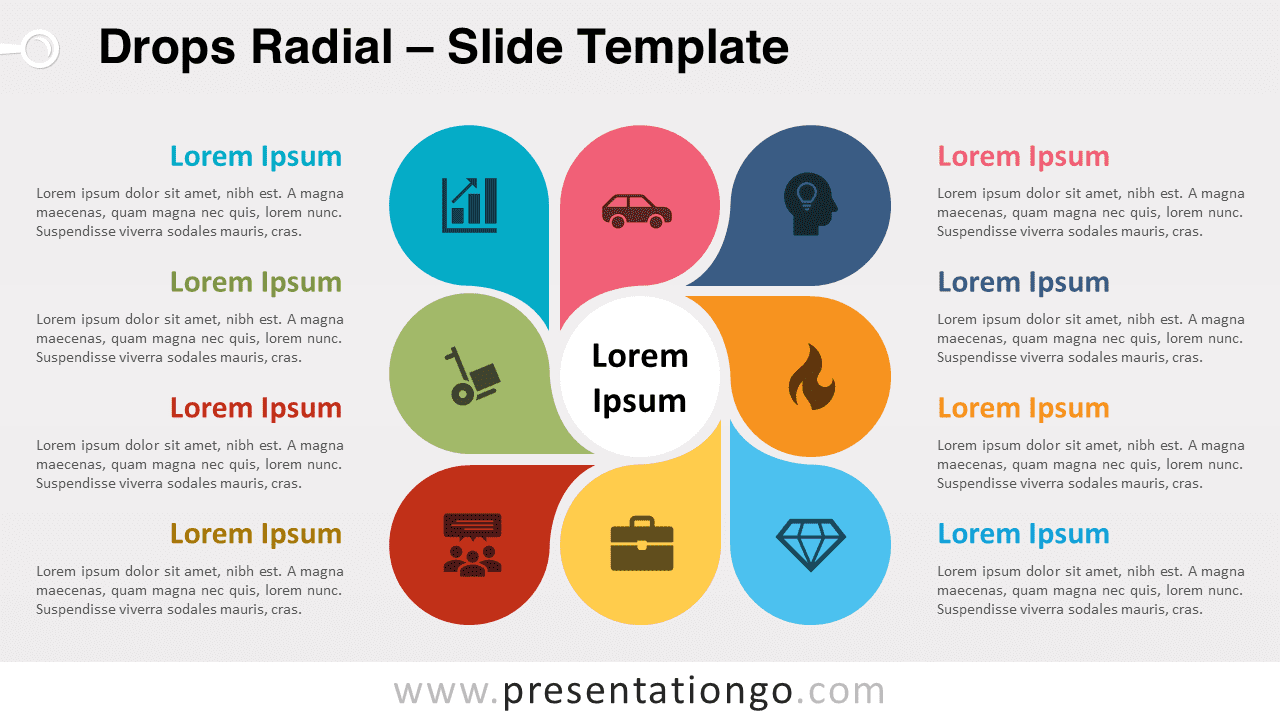
Free drops radial for PowerPoint and Google Slides. A sequential process of 8 drop-shape elements around a central idea. Editable graphics.
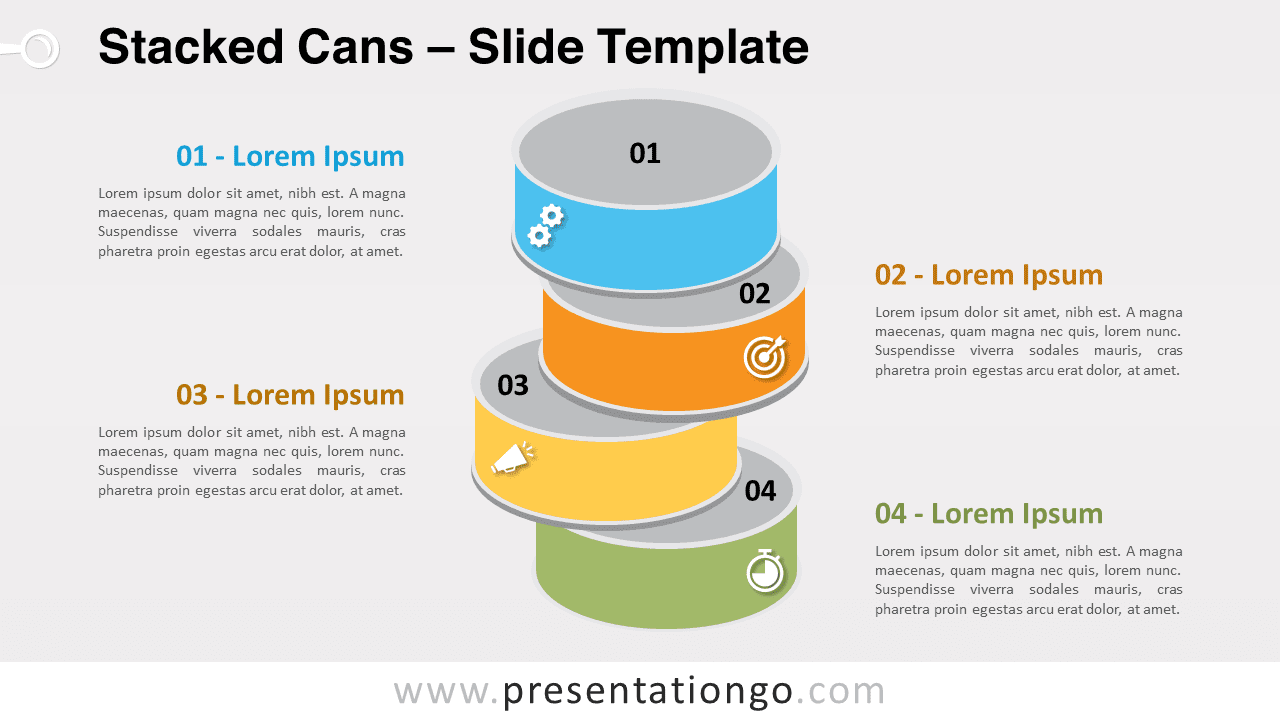
Free stacked cans for PowerPoint and Google Slides. A vertical and random pile of tin cans. Completely editable graphics.
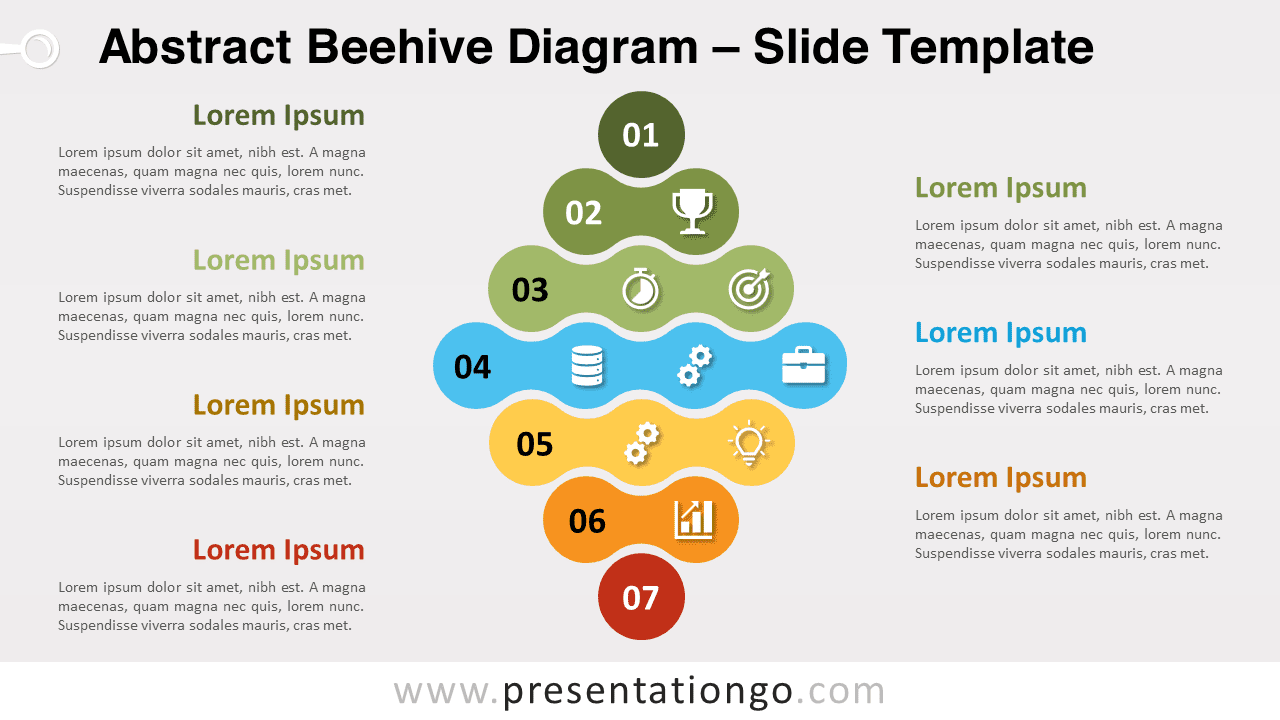
Free abstract beehive diagram for PowerPoint and Google Slides. An original and colorful infographic for your presentation slides.
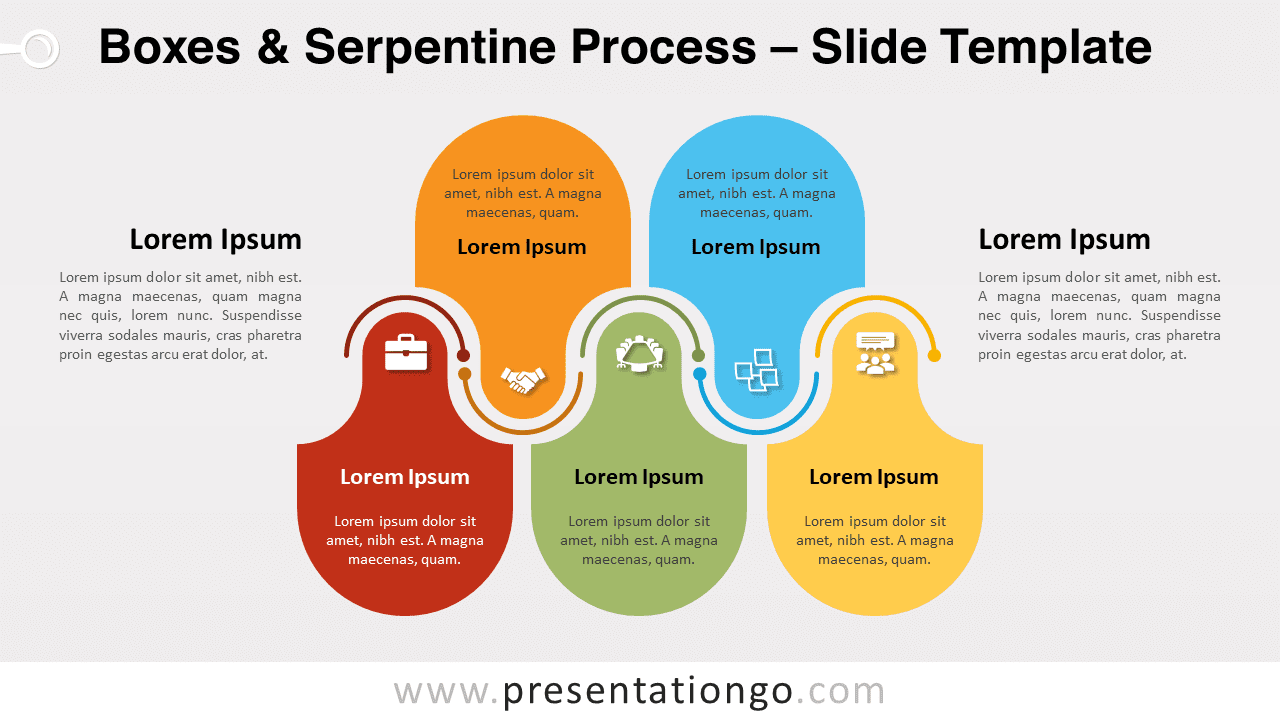
Free boxes and serpentine process for PowerPoint and Google Slides. An alternating series of rounded textboxes around a serpentine line.
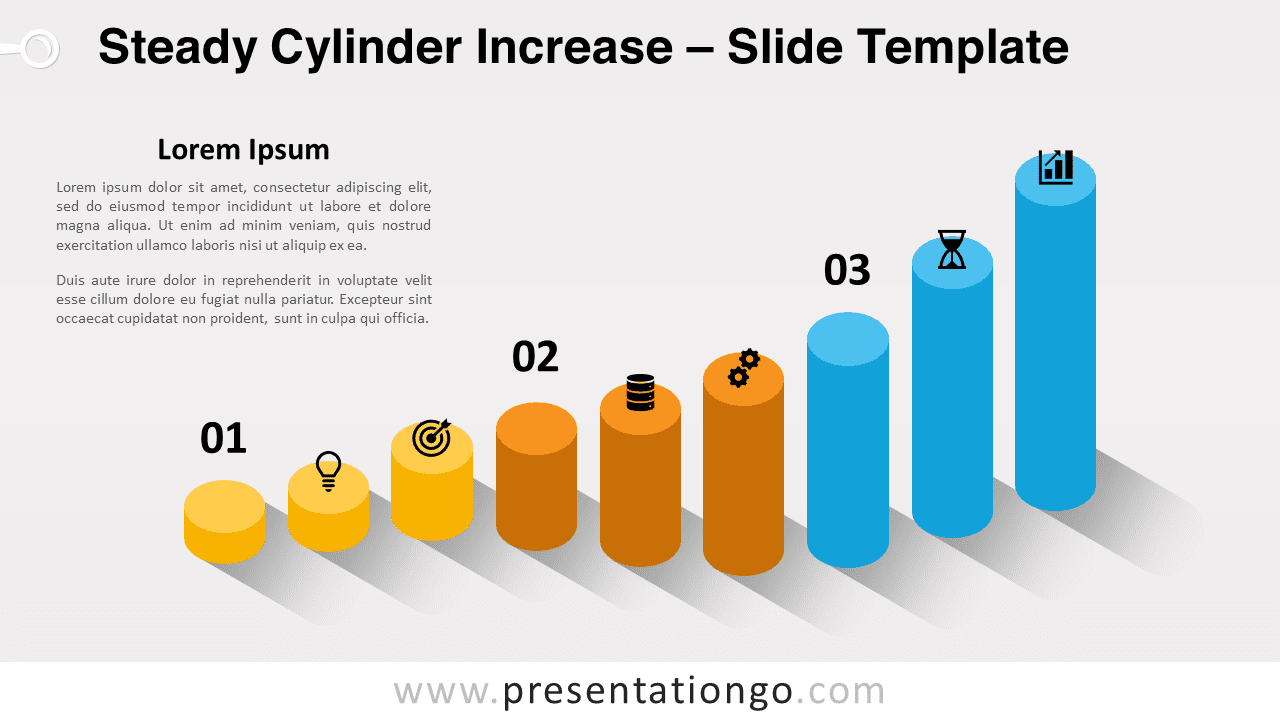
Free steady cylinder increase for PowerPoint and Google Slides. An increasing series of 3D cylinders. Editable graphics.
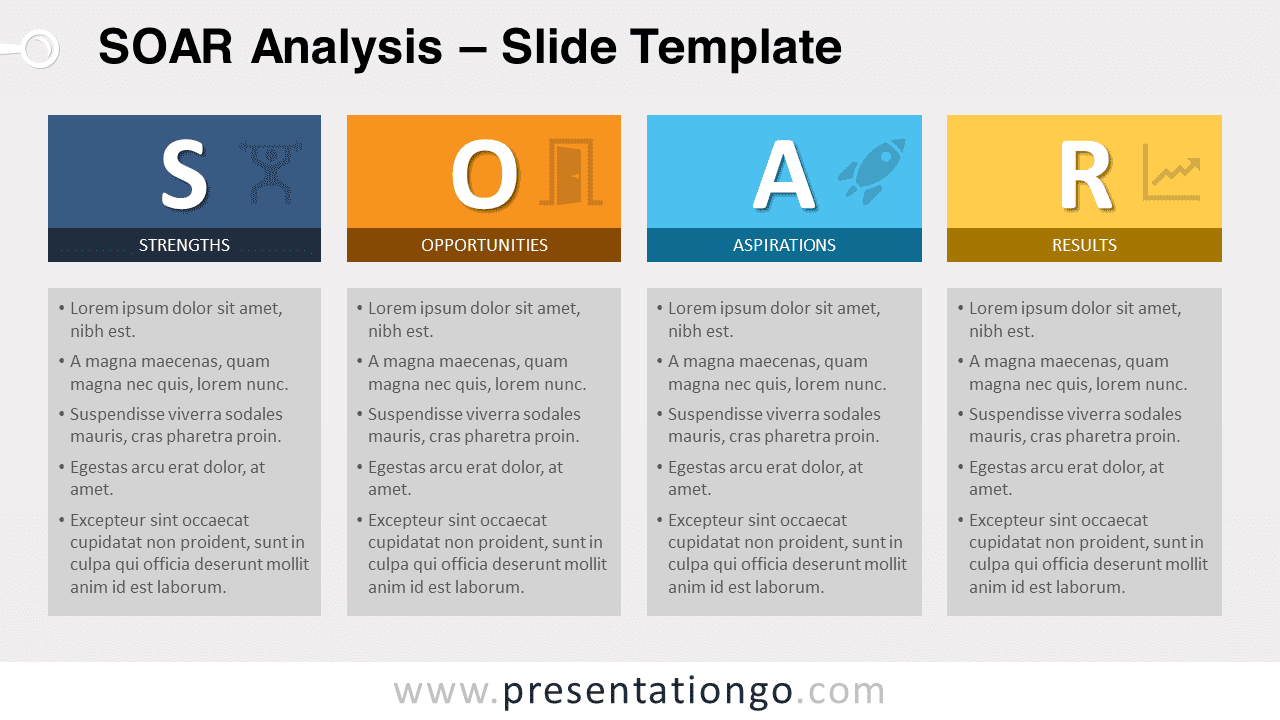
Free SOAR analysis for PowerPoint and Google Slides. Slide template to list and describe Strengths, Opportunities, Aspirations, and Results.
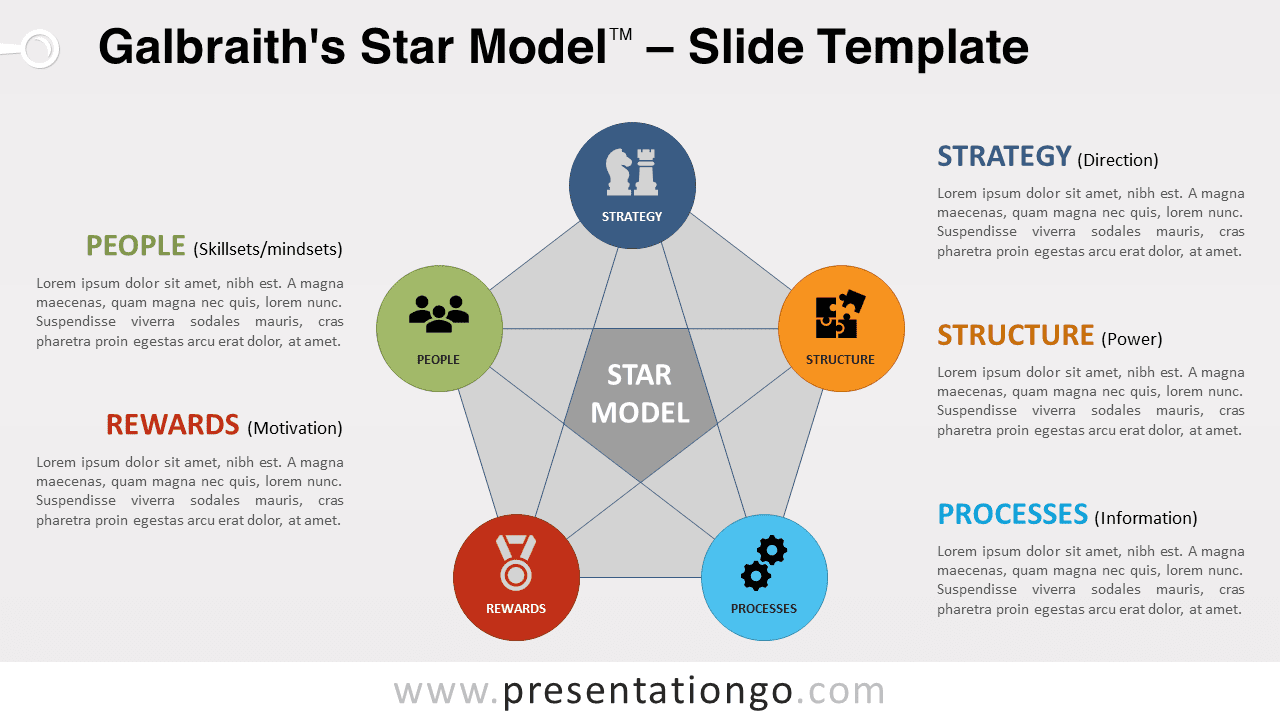
Free Galbraith's star model for PowerPoint and Google Slides. Slide template of the organizational design. Editable graphics.
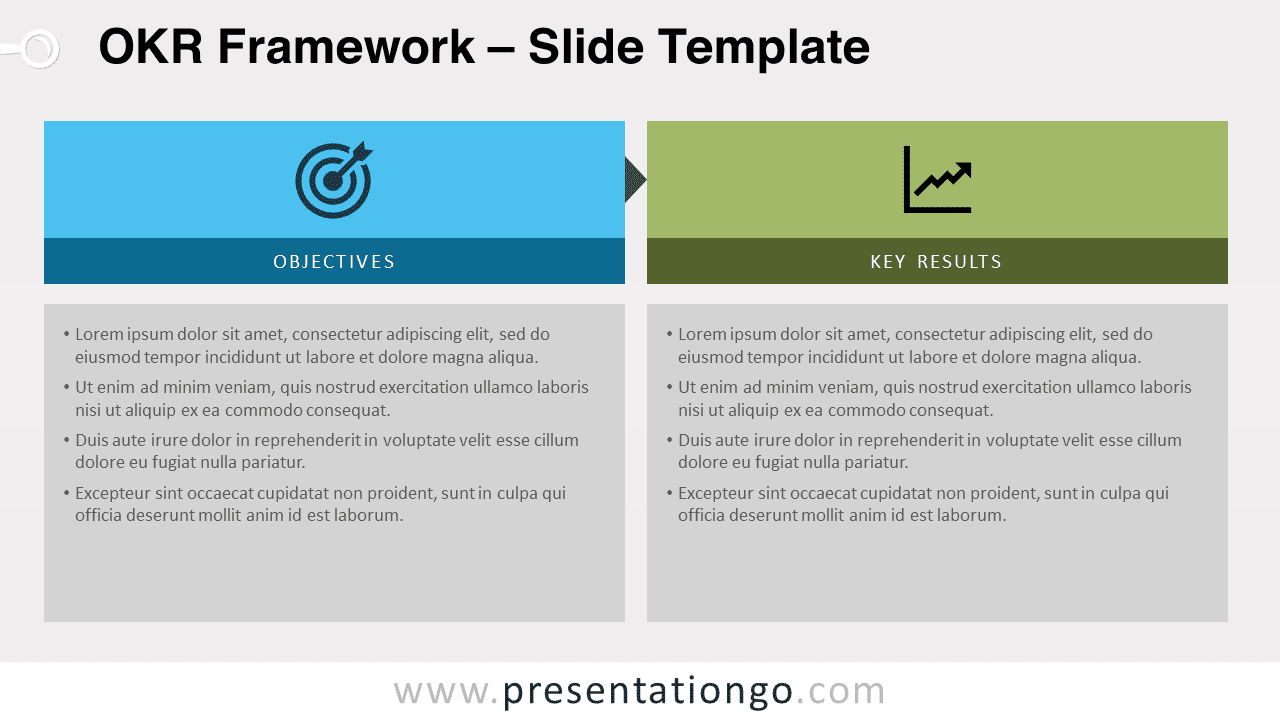
Free OKR framework for PowerPoint and Google Slides. Objectives and Key Results slide template, a collaborative goal-setting model.