Loading resources…
Total 1760 resources
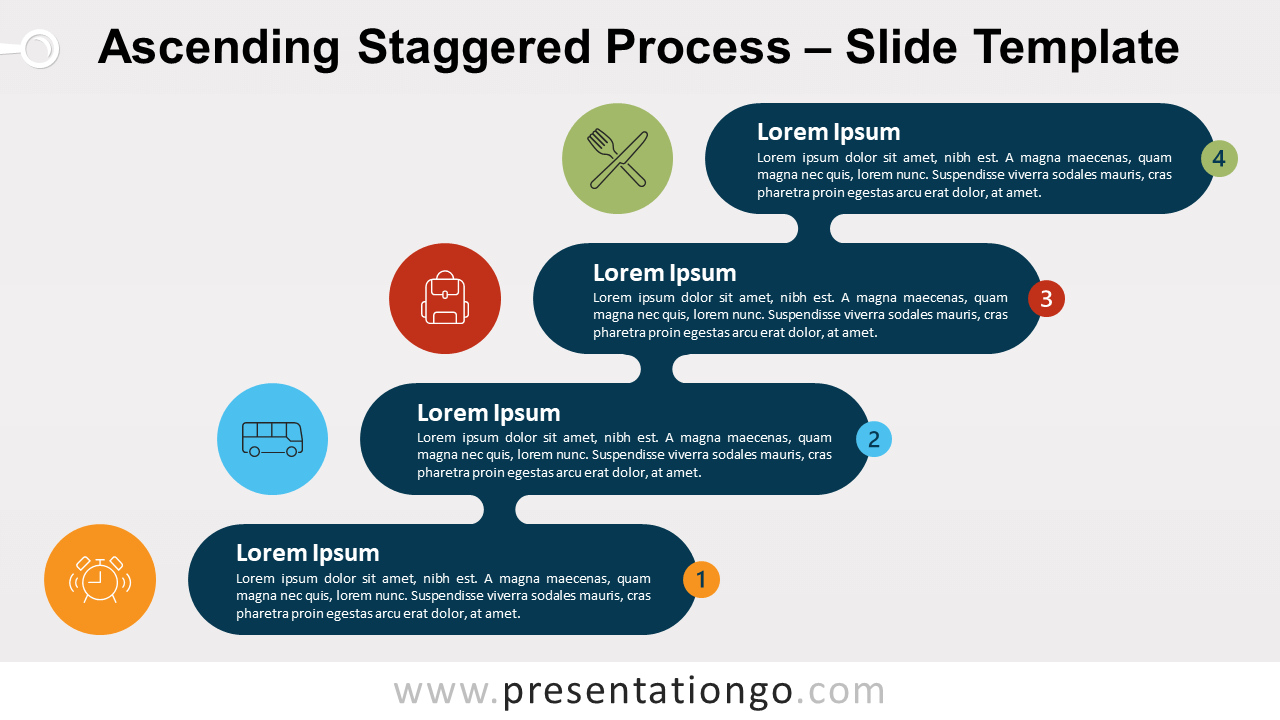
Free ascending & descending staggered process for PowerPoint and Google Slides. Two design options of a process diagram with a step-up or a step-down flow.
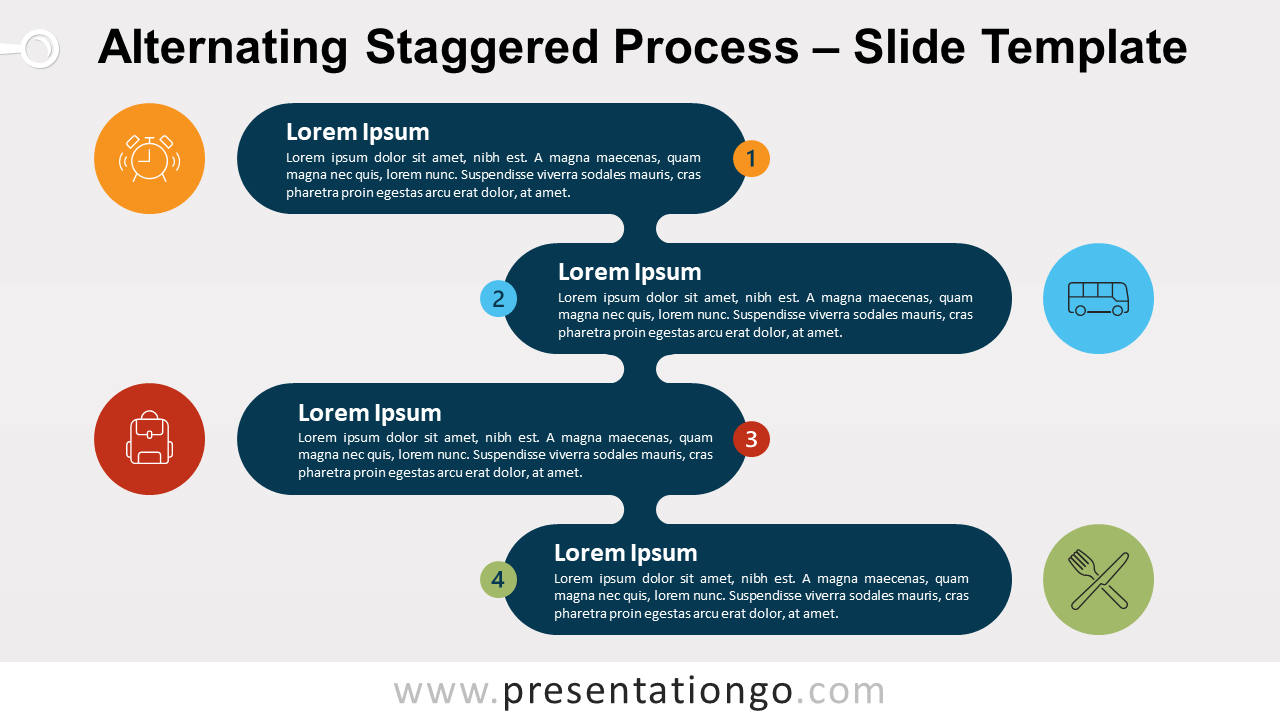
Free alternating staggered process for PowerPoint and Google Slides. A vertical process diagram made of stadium elements and alternating arrangements.
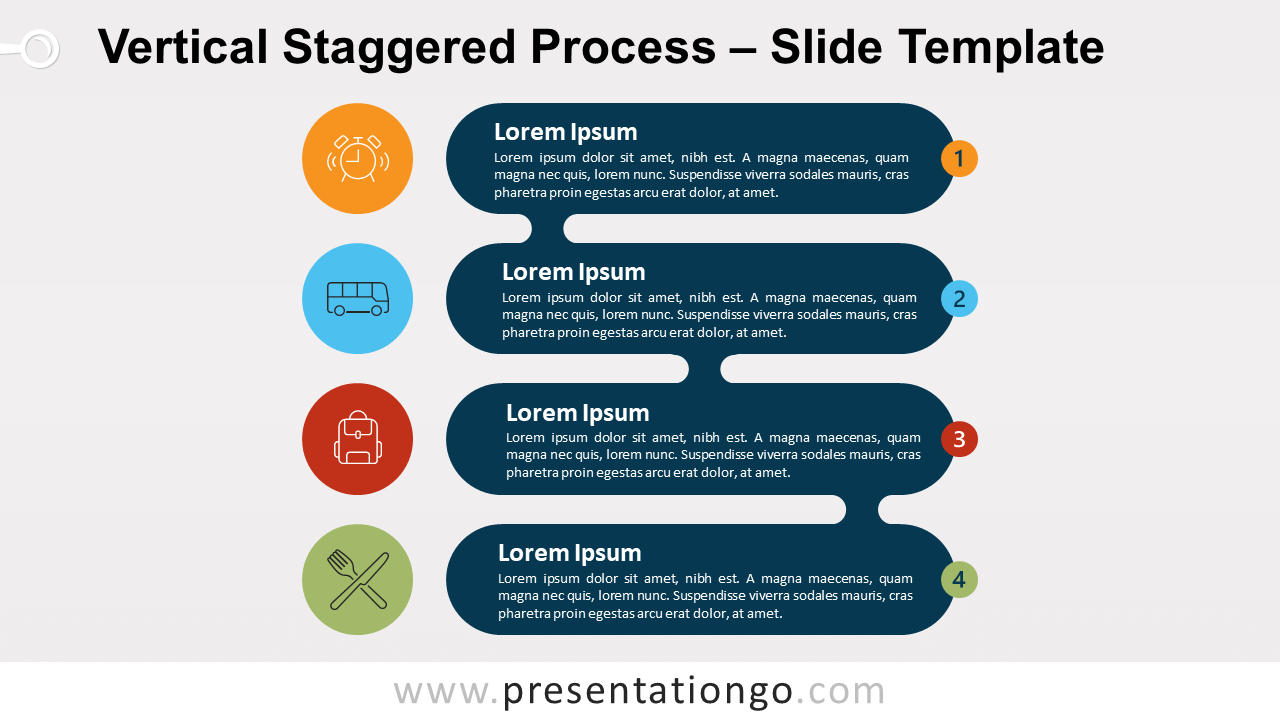
Free vertical staggered process for PowerPoint and Google Slides. A vertical process diagram designed with center-aligned stadium shapes.
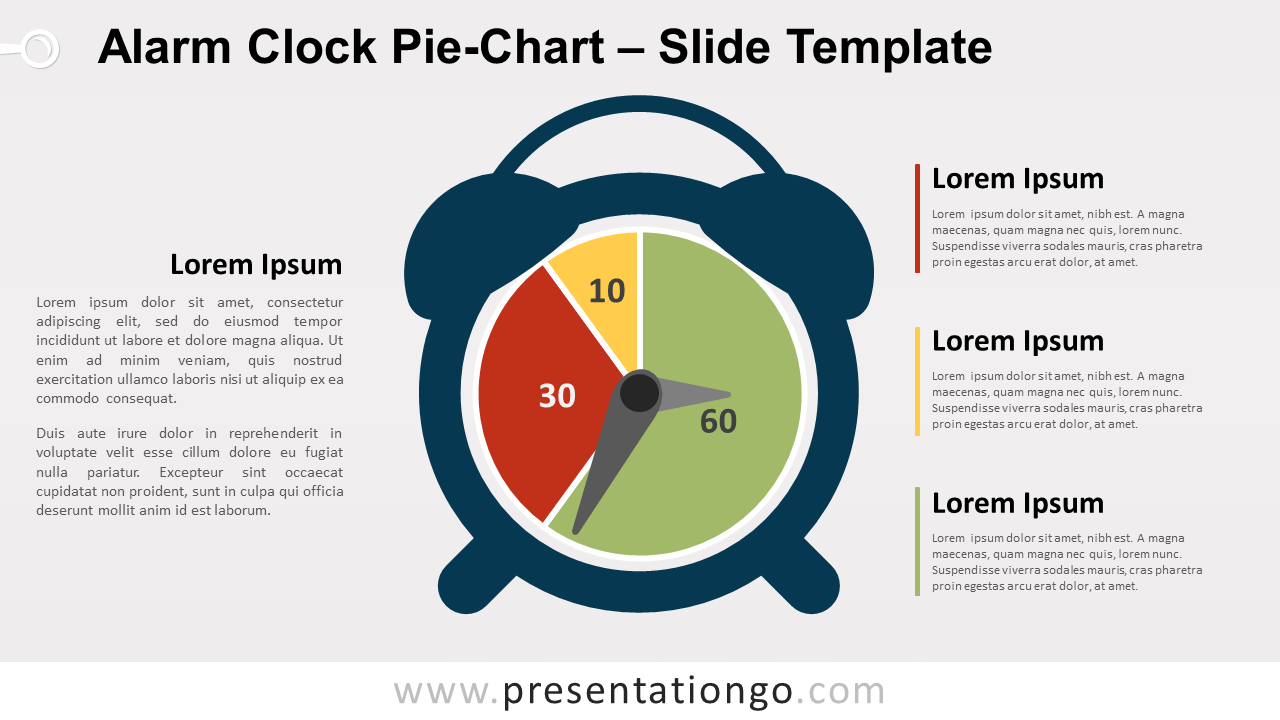
Free alarm clock pie-chart for PowerPoint and Google Slides. Illustration of a classic twin bell alarm clock with a data-driven pie chart.
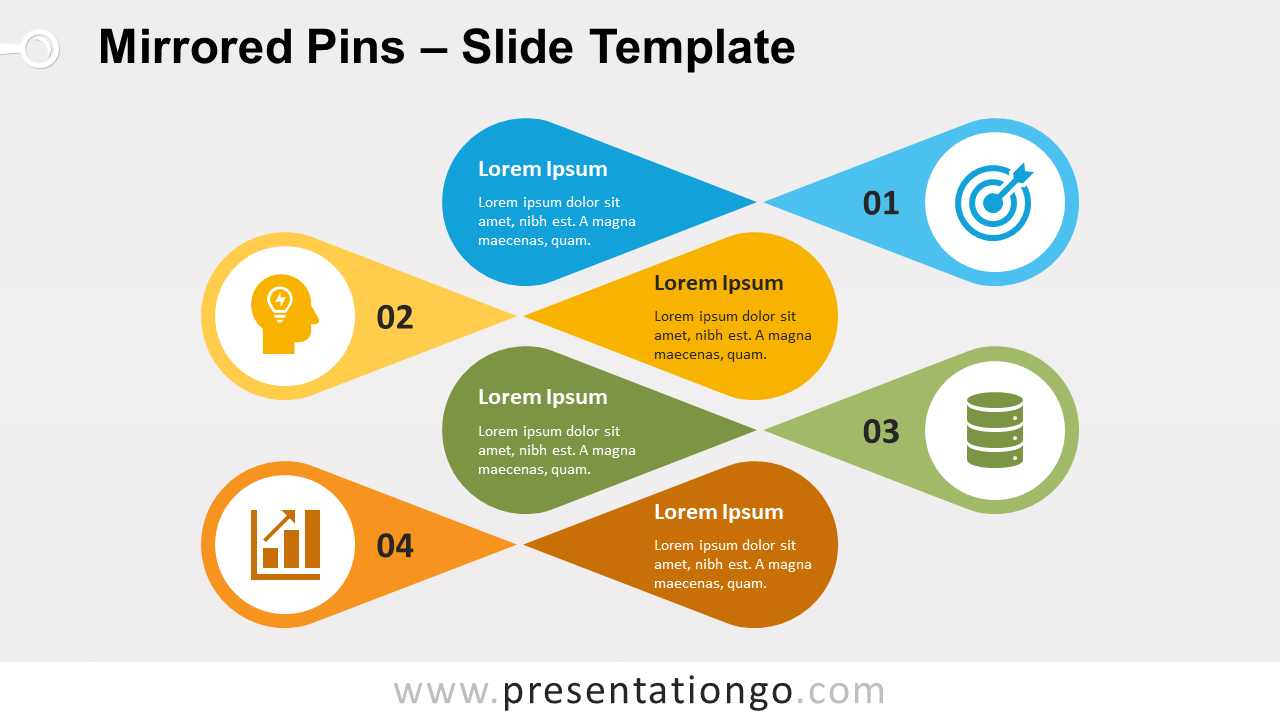
Free mirrored pins for PowerPoint and Google Slides. A series of horizontal colorful pin shapes. Editable graphics with icons and text placeholders.
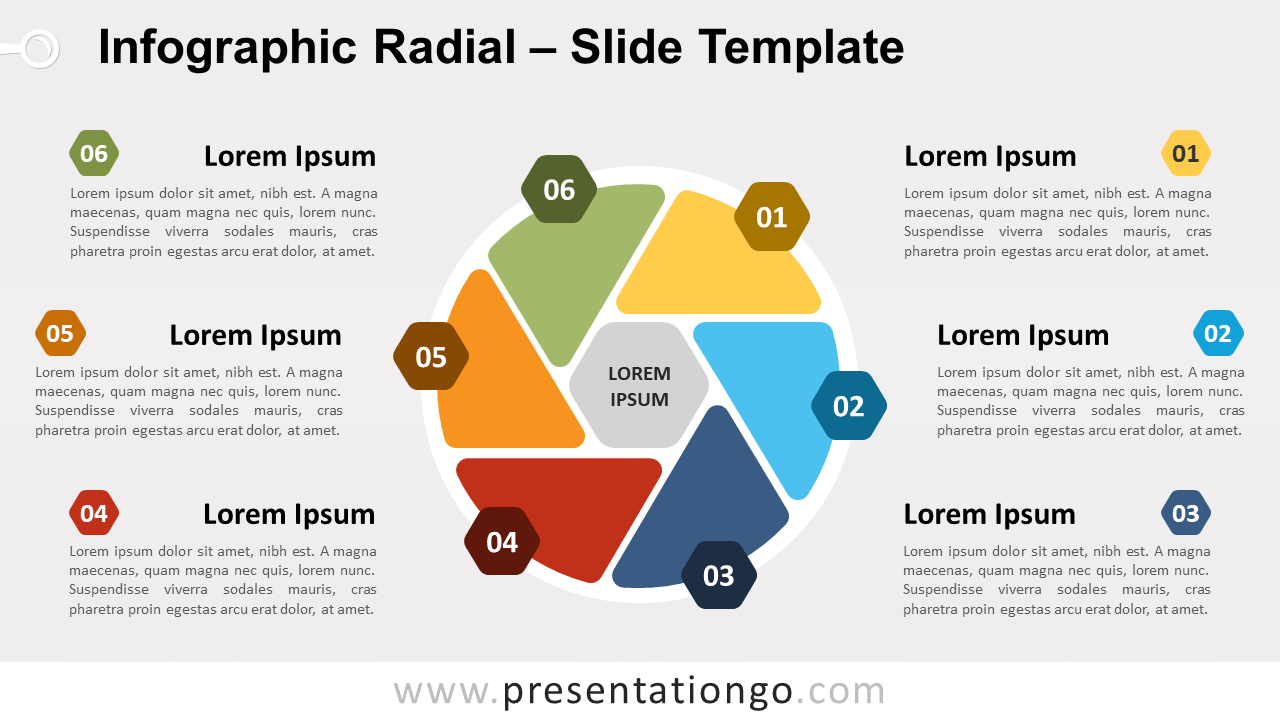
Free infographic radial for PowerPoint and Google Slides. Editable cycle radial diagram with 4 or 8 surrounding circles and rounded rectangle shapes.
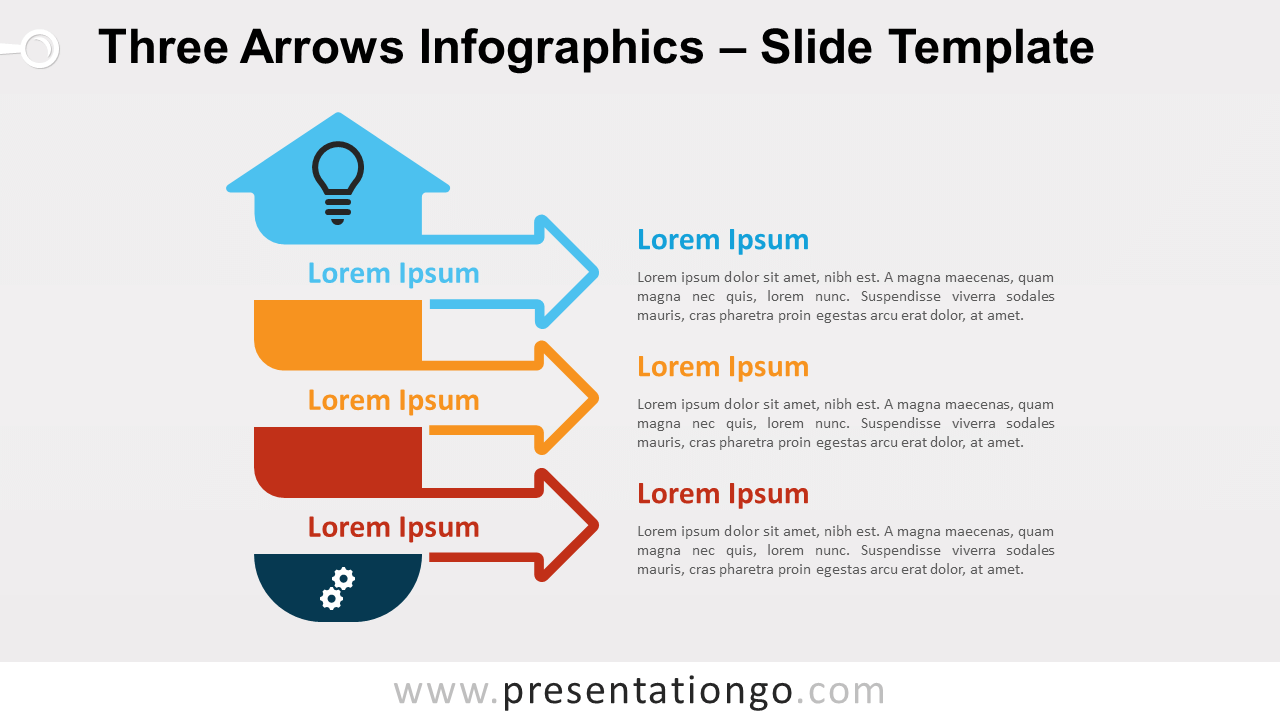
Free three arrows infographics for PowerPoint and Google Slides. A series of three right outline arrows distributed on an upward arrow. Editable graphics.
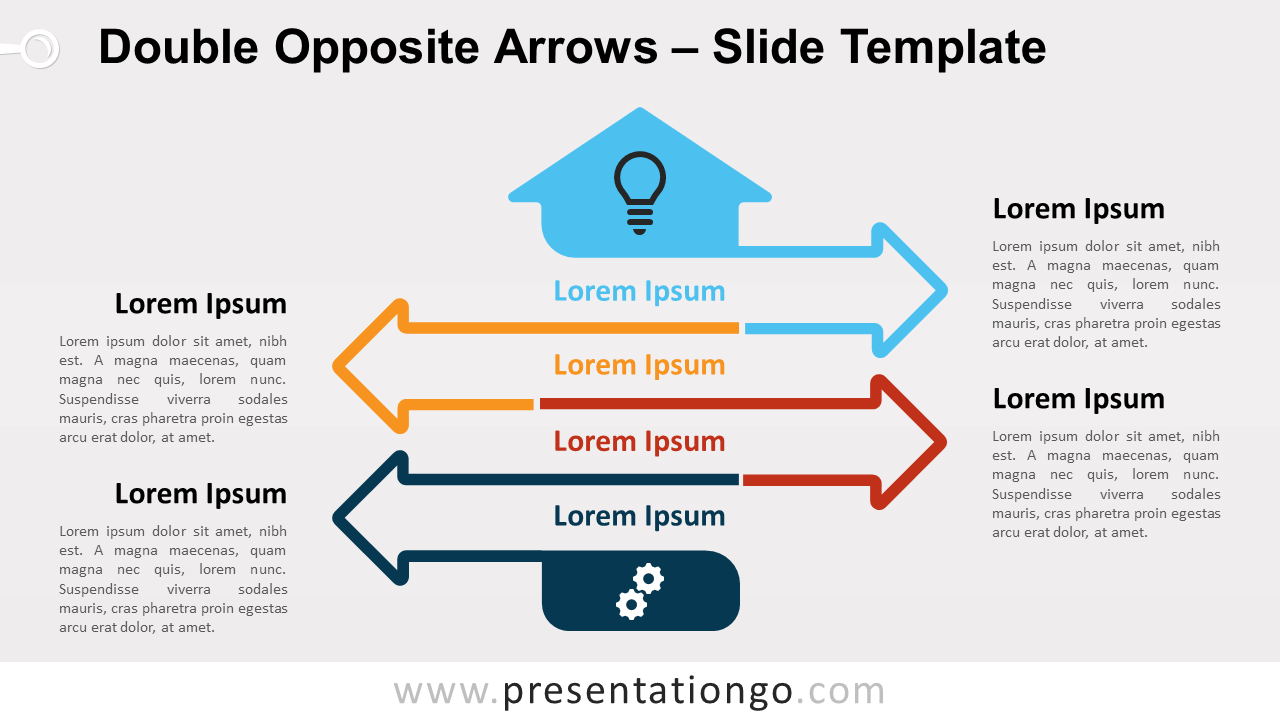
Free double opposite arrows infographics for PowerPoint and Google Slides. Four arrows vertically distributed and diverging from an upward arrow.
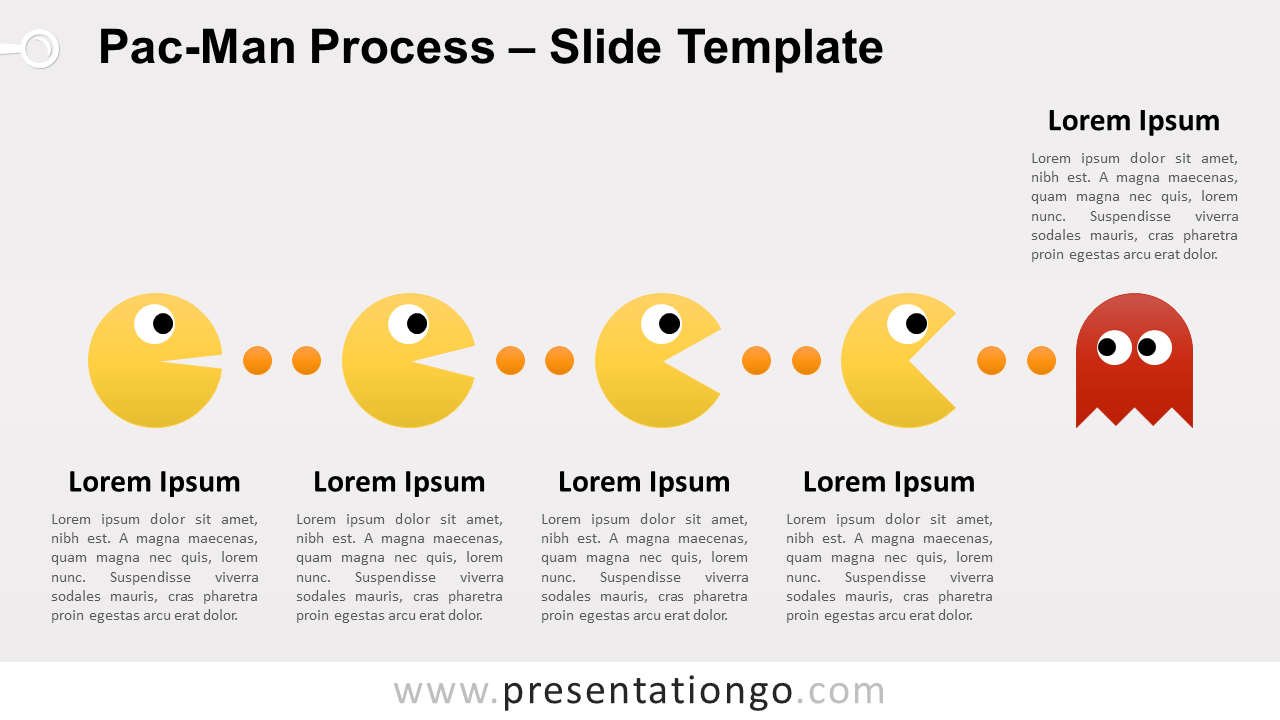
Free Pac-Man process for PowerPoint and Google Slides. A fun and creative horizontal process diagram featuring the famous video game character.
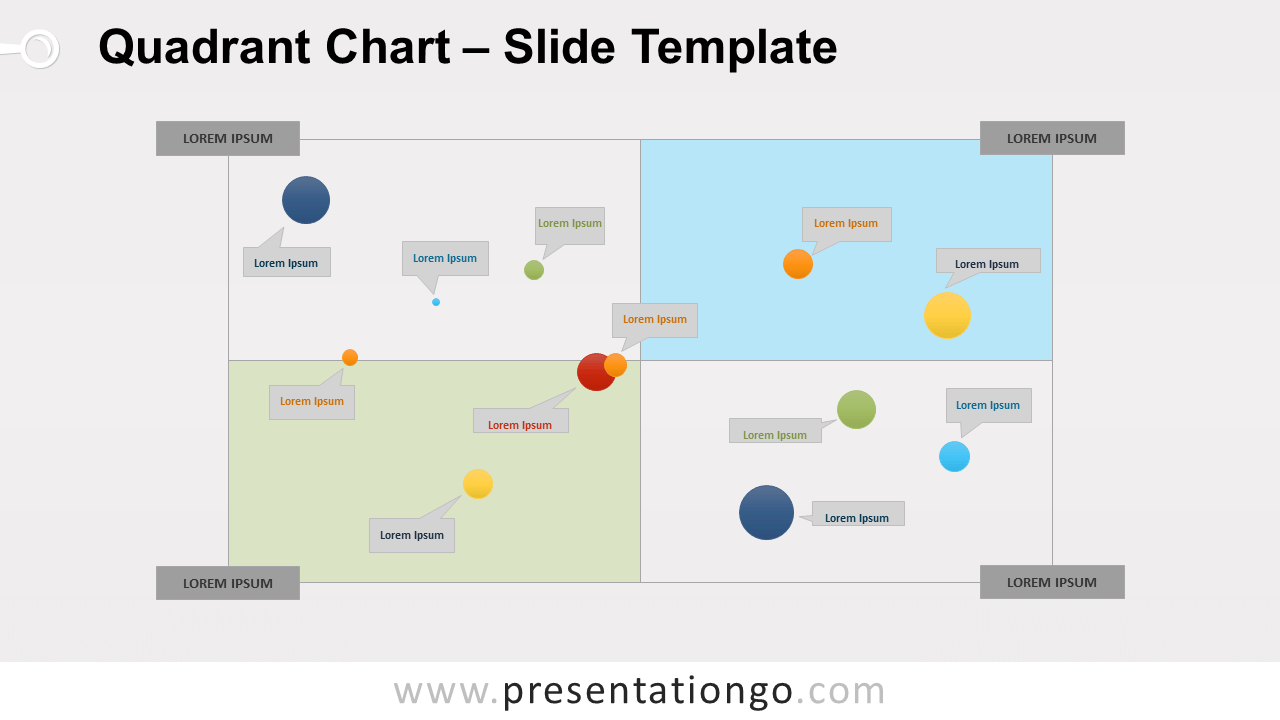
Free quadrant chart for PowerPoint and Google Slides. Scatter chart with 4 equal sections (quarters). Non-data-driven alternative, great data visualization.
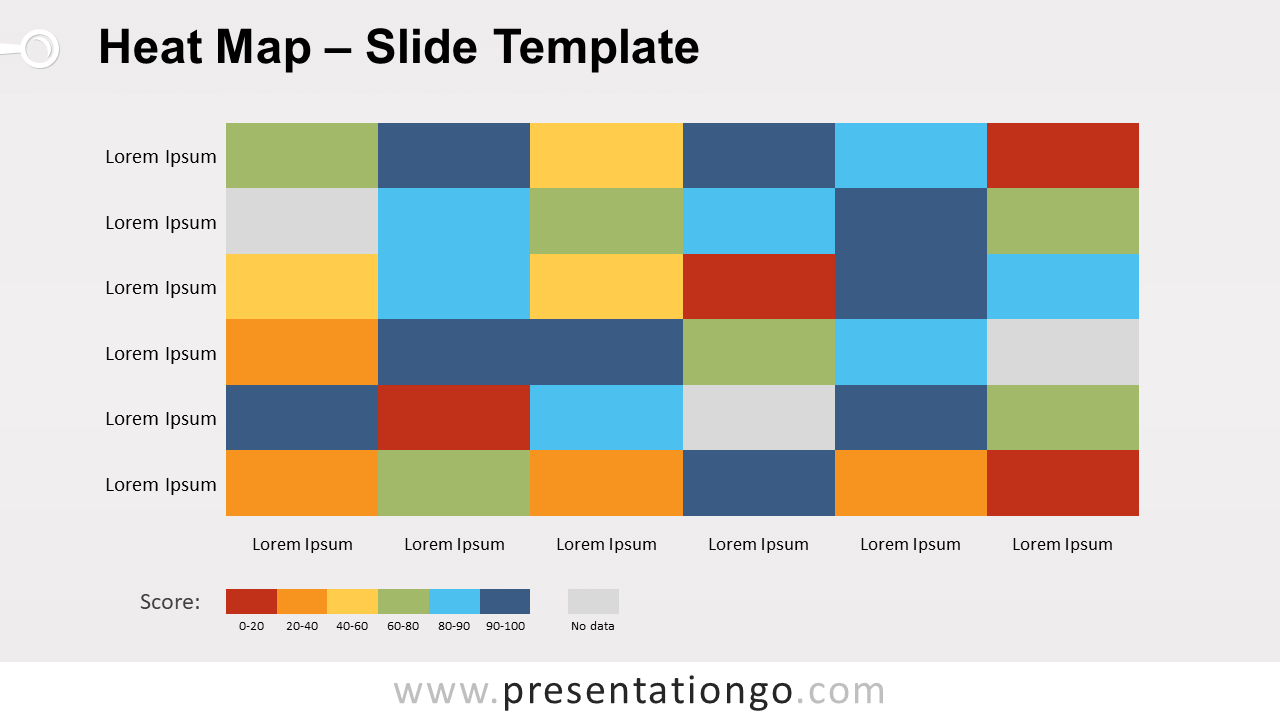
Free heat map for PowerPoint and Google Slides. A two-dimensional data visualization chart with 2 color scheme options: by hue or intensity.
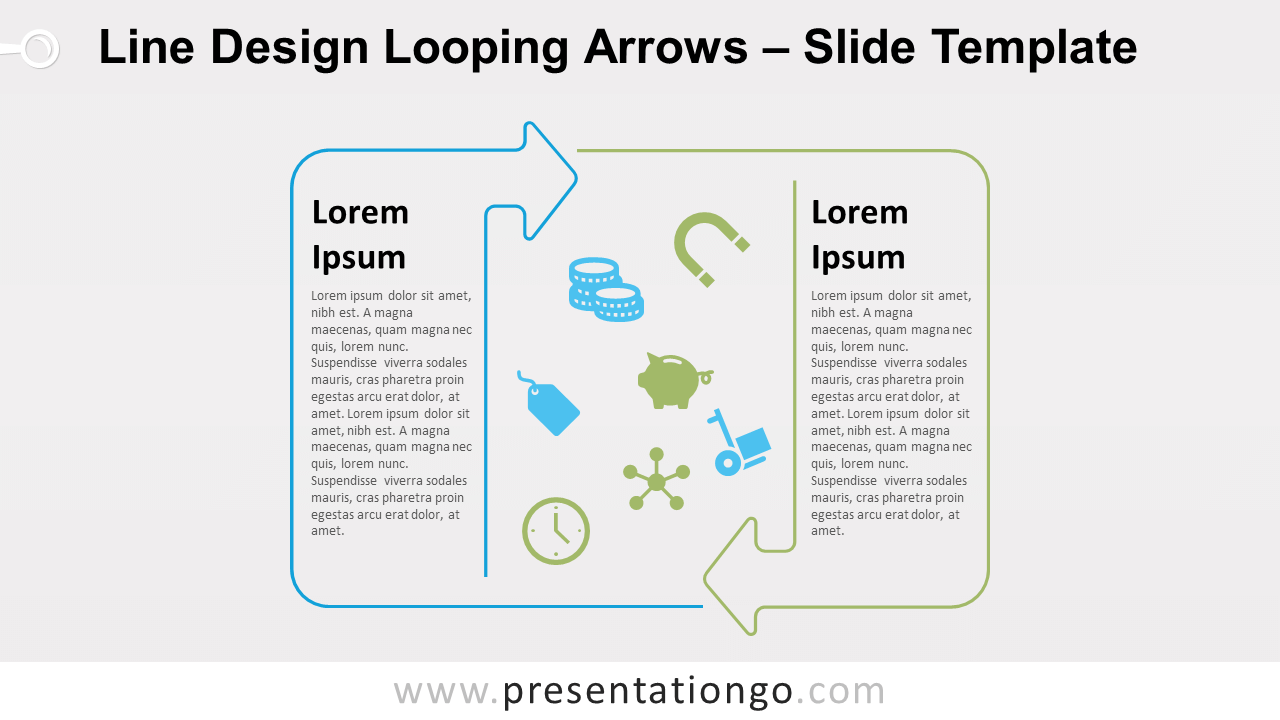
Free line design looping arrows for PowerPoint and Google Slides. A rounded-corner circular diagram with 2 opposing arrows. Editable graphics.
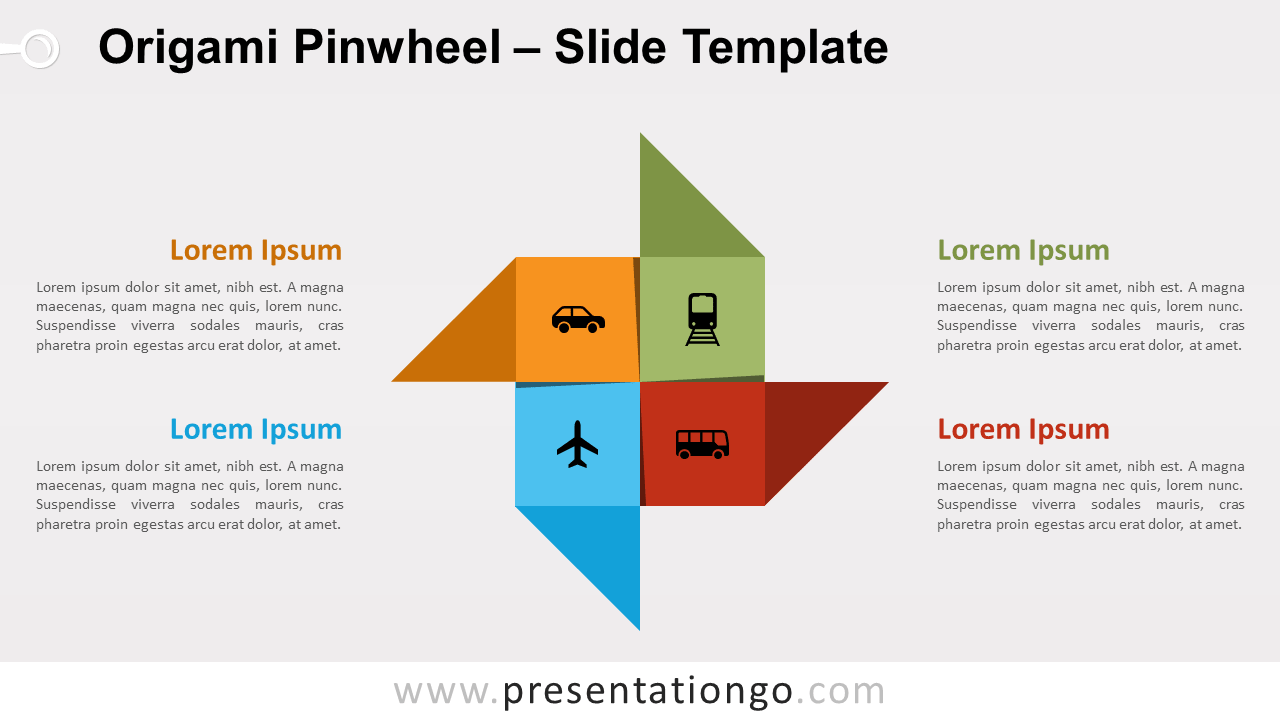
Free origami pinwheel for PowerPoint and Google Slides. A four-pointed origami star diagram inspired by the paper pinwheel. Editable graphics.
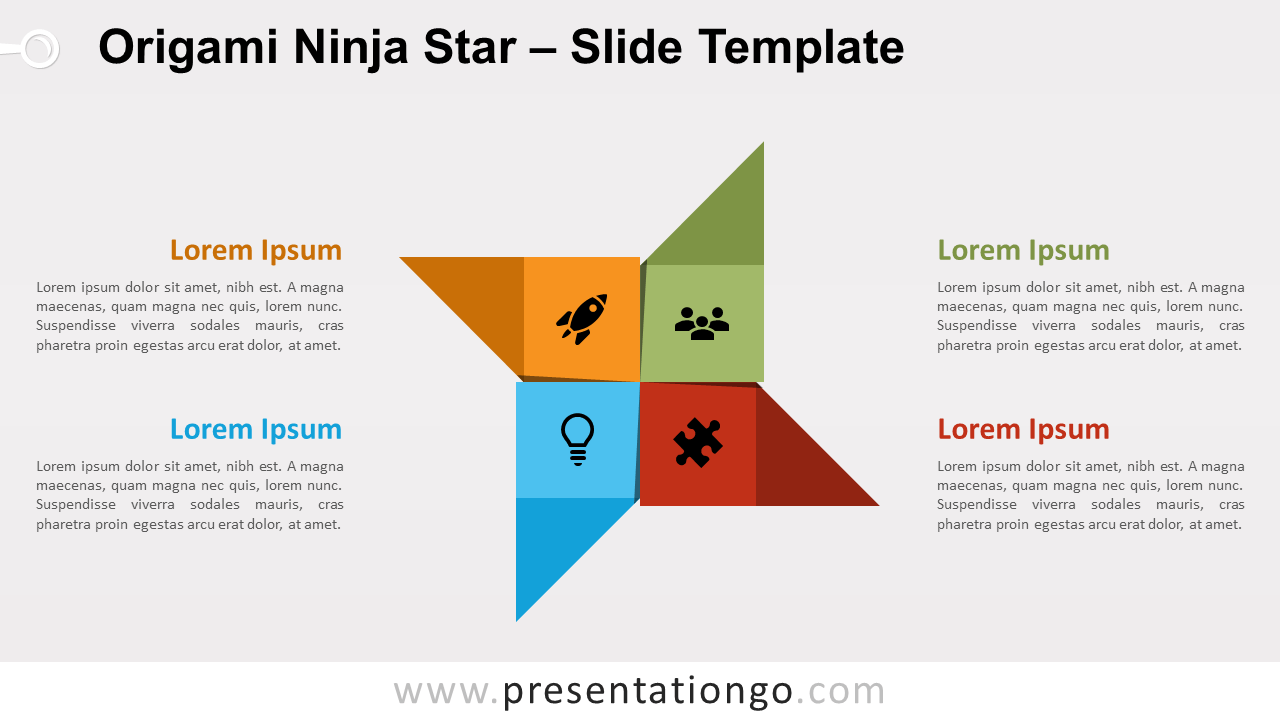
Free origami ninja star for PowerPoint and Google Slides. A four-pointed star diagram inspired by the ninja star (Shuriken). Great as a cycle or a matrix.
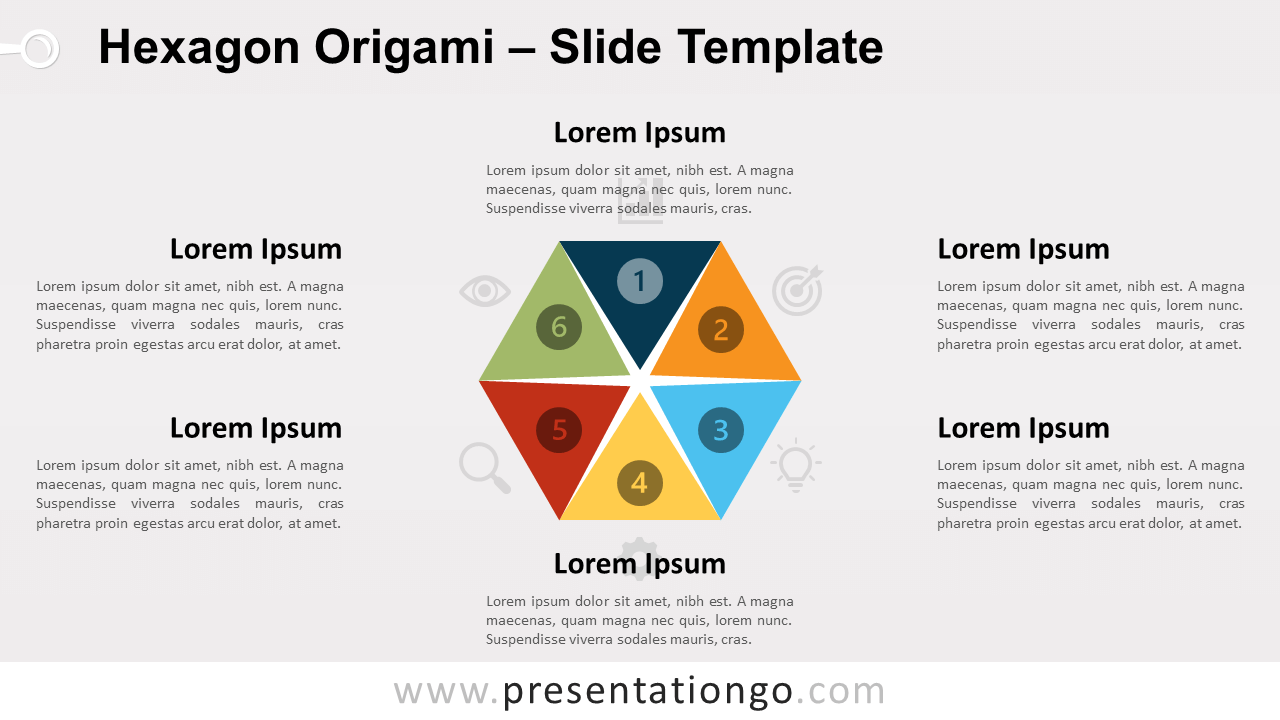
Free hexagon origami for PowerPoint and Google Slides. A series of hexagon graphics inspired by the famous fortune-teller origami game. Editable graphics.
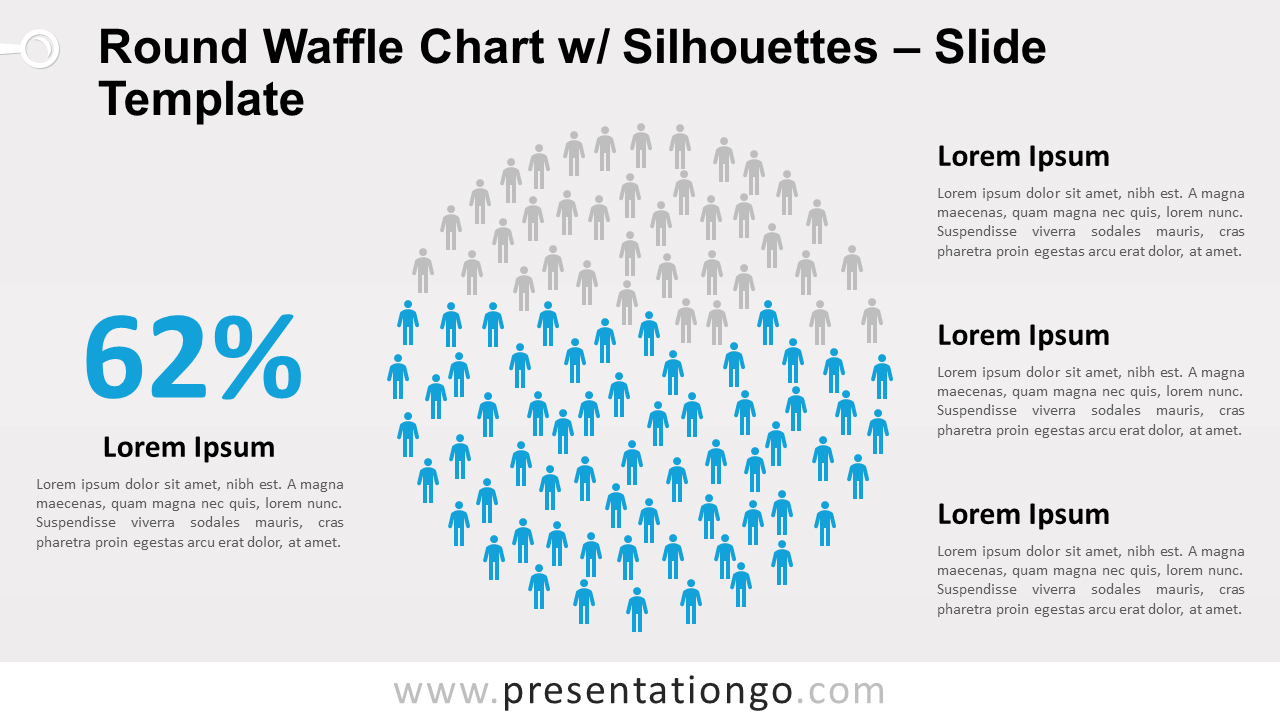
Free round waffle chart for PowerPoint and Google Slides. 100 silhouettes forming a circle with colored ones for the data. Great for data visualization.
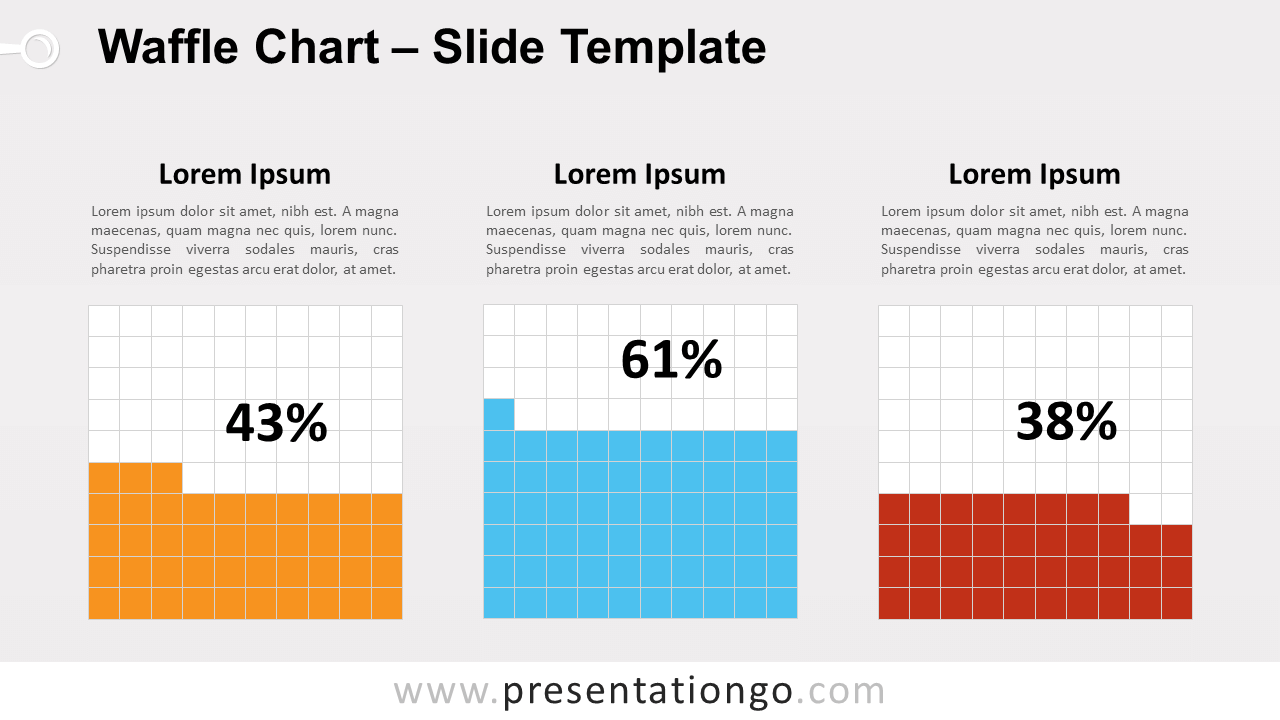
Free waffle chart for PowerPoint and Google Slides. Grids of 10x10 small cells with colored ones. Great to visualize and compare quantitative data.
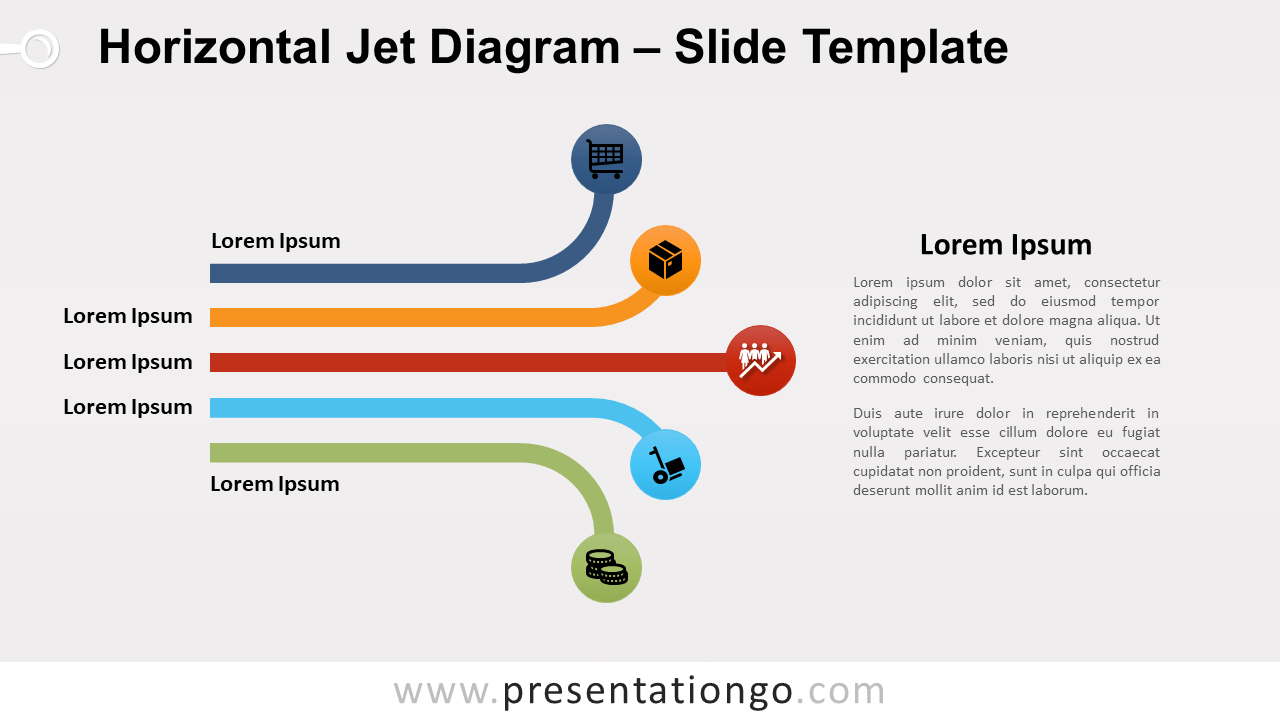
Free horizontal jet diagram for PowerPoint and Google Slides. A horizontal projection of curved and straight thick lines ending with a circle.
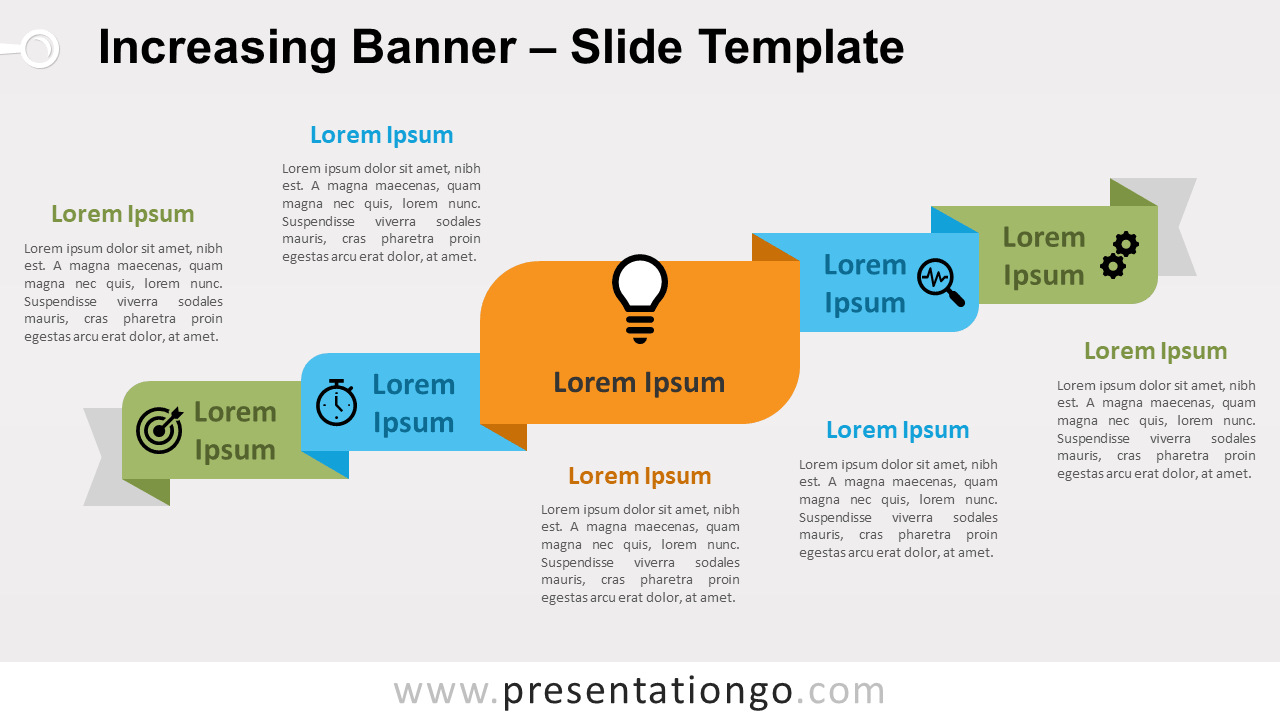
Free increasing banner for PowerPoint and Google Slides. A folded banner ribbon with 5 increasing levels. Great to show an ascending series of 5 steps.
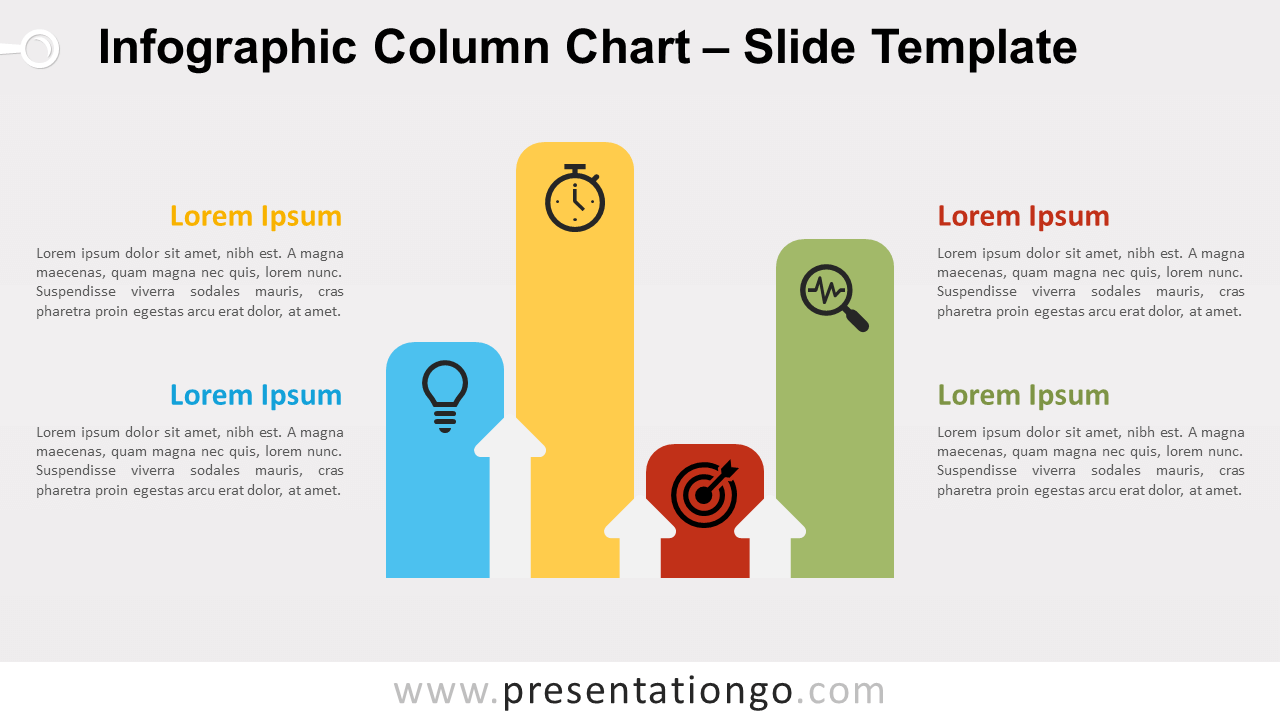
Free infographic column chart for PowerPoint and Google Slides. Vertical rounded bars with arrows to visualize and compare data. Editable graphics.
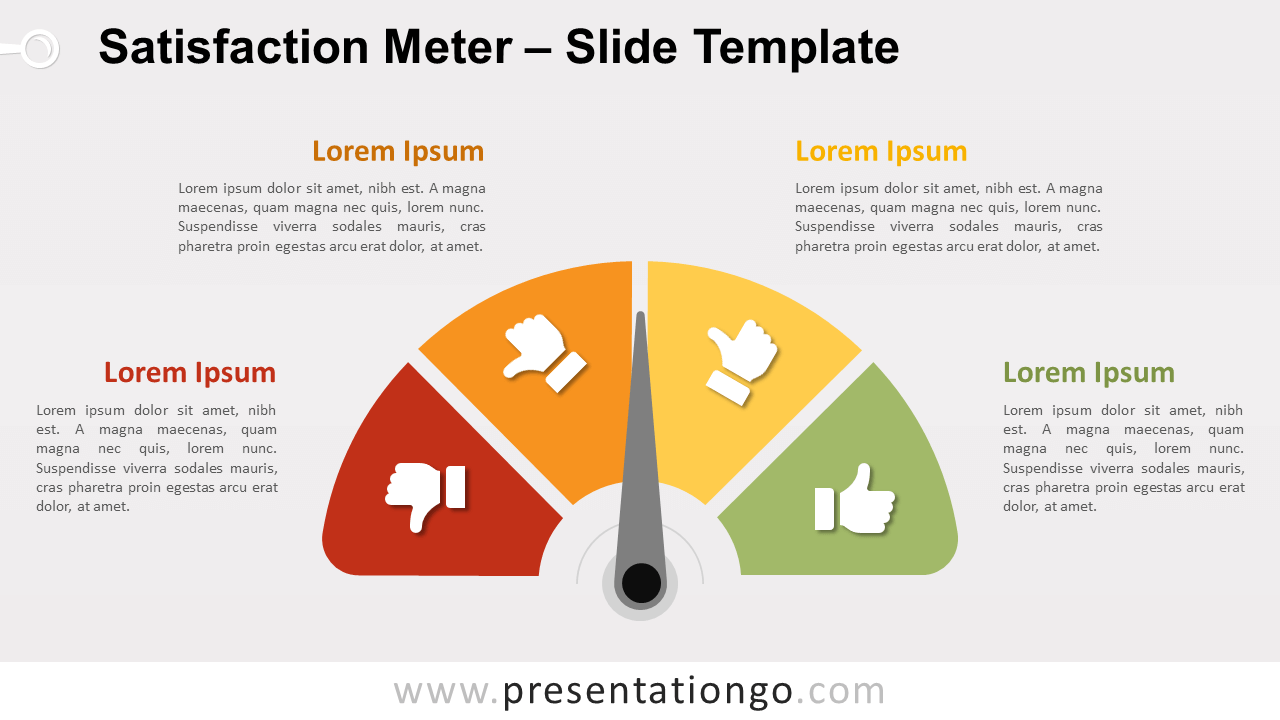
Free satisfaction meter for PowerPoint and Google Slides. Half a doughnut chart with 4 colorful sections and a needle to indicate the value.
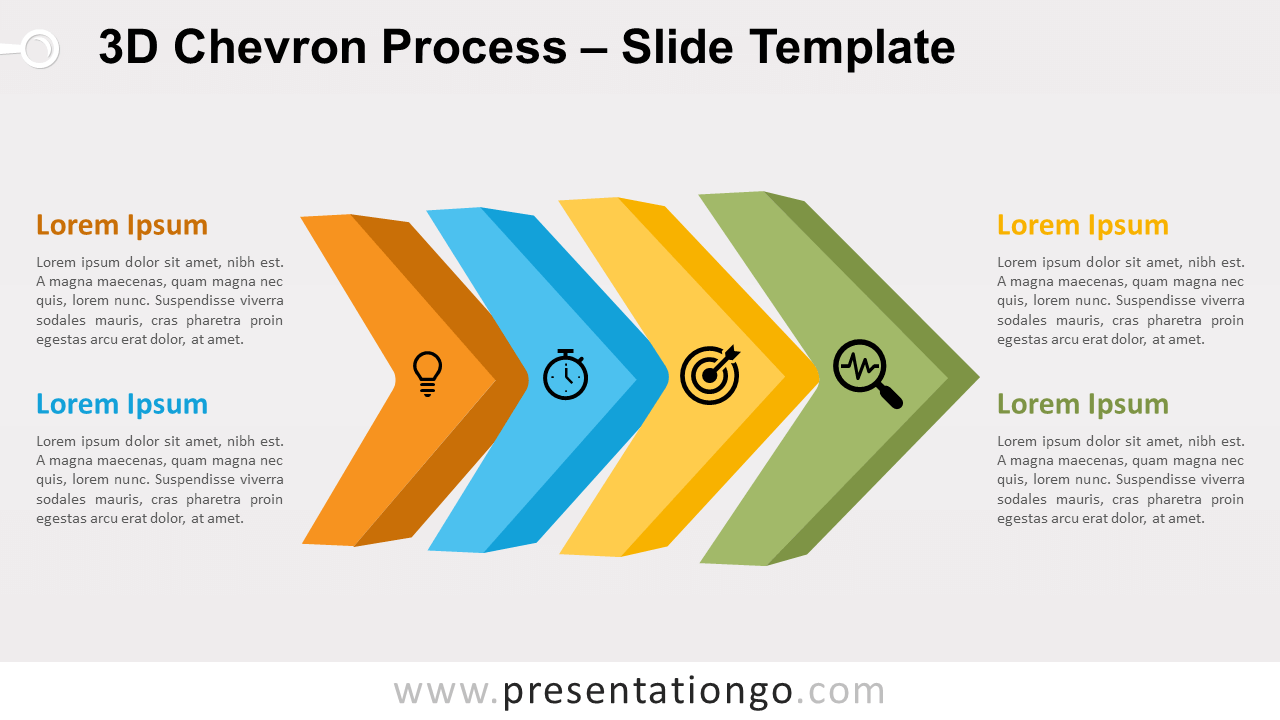
Free 3D Chevron process for PowerPoint and Google Slides. An alignment of colorful three-dimensional chevron shapes. Editable graphics.
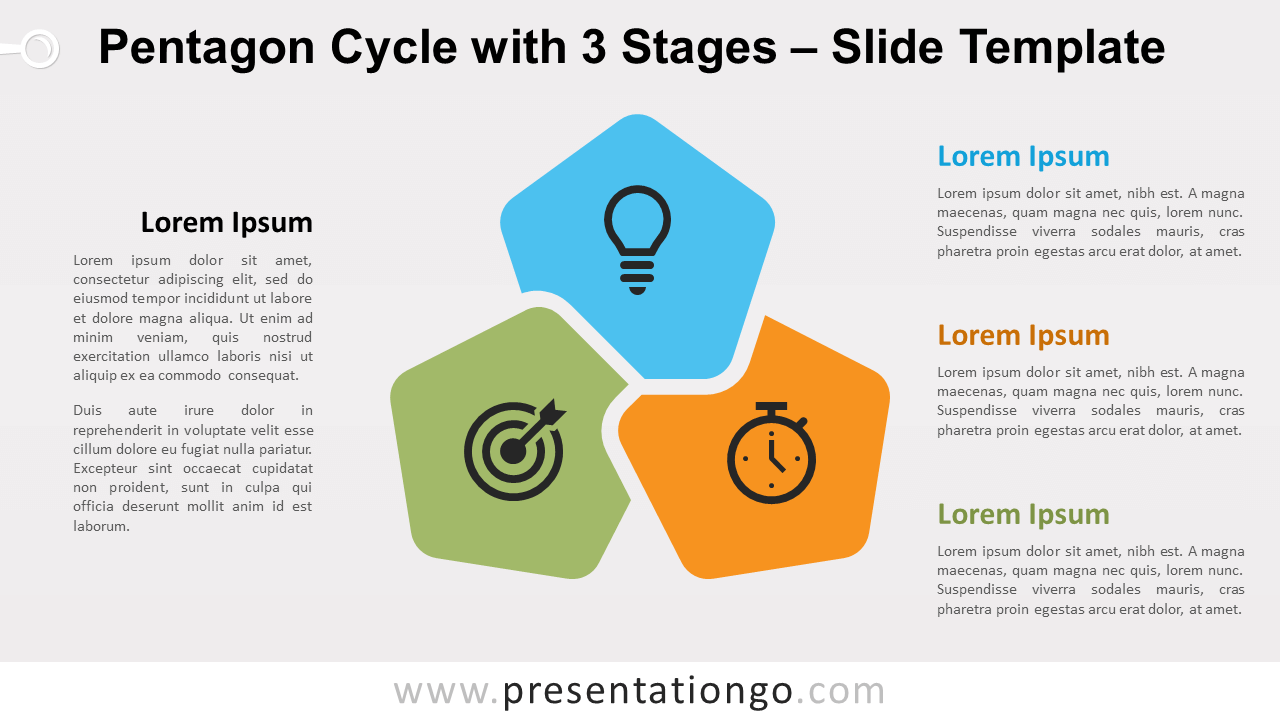
Free pentagon cycle with 3 stages for PowerPoint and Google Slides. Three pentagon shapes interlocked and forming a circular flow. Editable graphics.
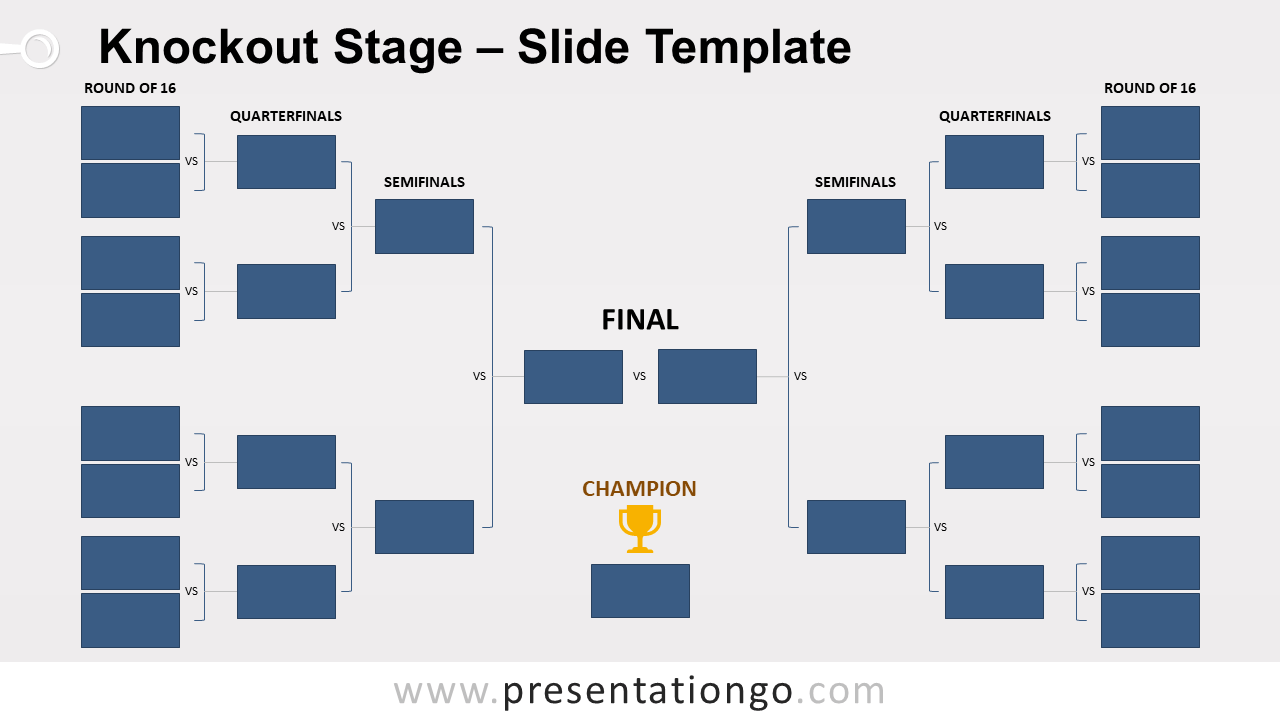
Free knockout stage for PowerPoint and Google Slides. Tournament bracket template for up to 16 teams or players. Editable with customizable text boxes.