Loading resources…
Total 1760 resources
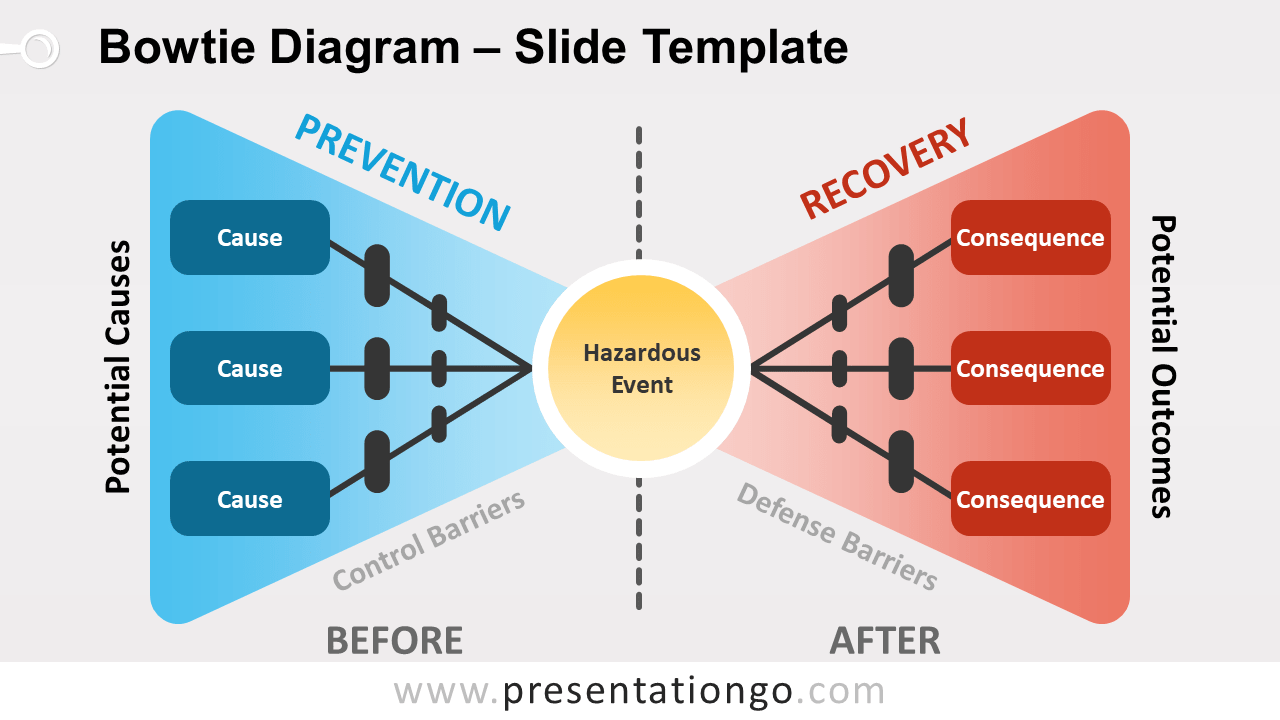
Free bowtie diagram for PowerPoint and Google Slides. A risk-assessment diagram to identify the relationships of risks, from its causes to its consequences.
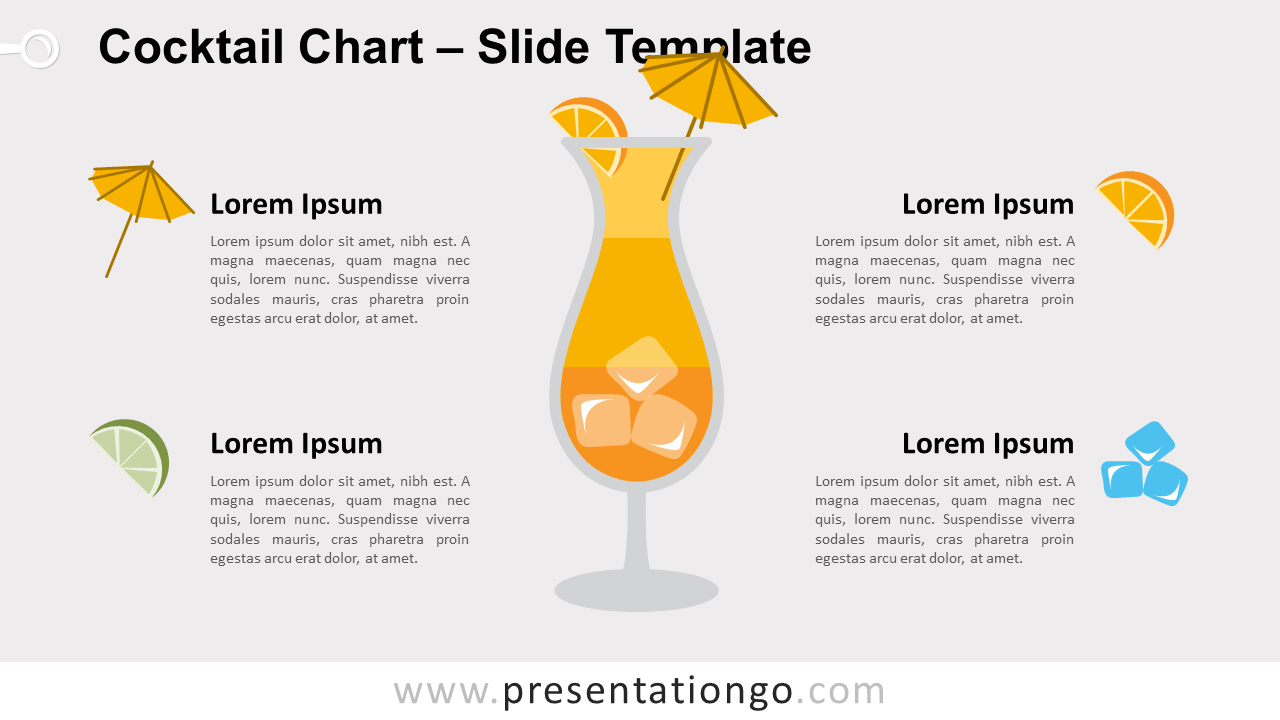
Free cocktail chart for PowerPoint and Google Slides. A cocktail glass with data-driven column chart. Creative chart to show quantitative results.
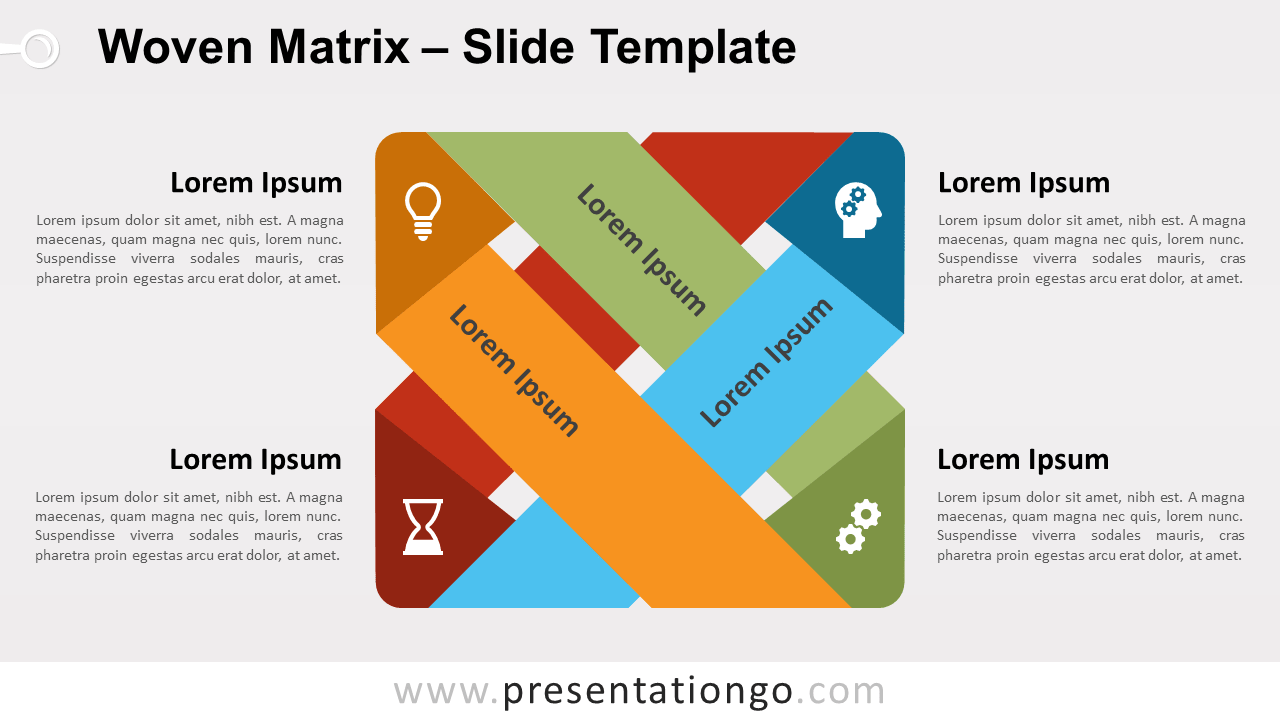
Free woven matrix for PowerPoint and Google Slides. Matrix diagram with a braided woven stripe effect. Editable graphics with icons and text placeholders.
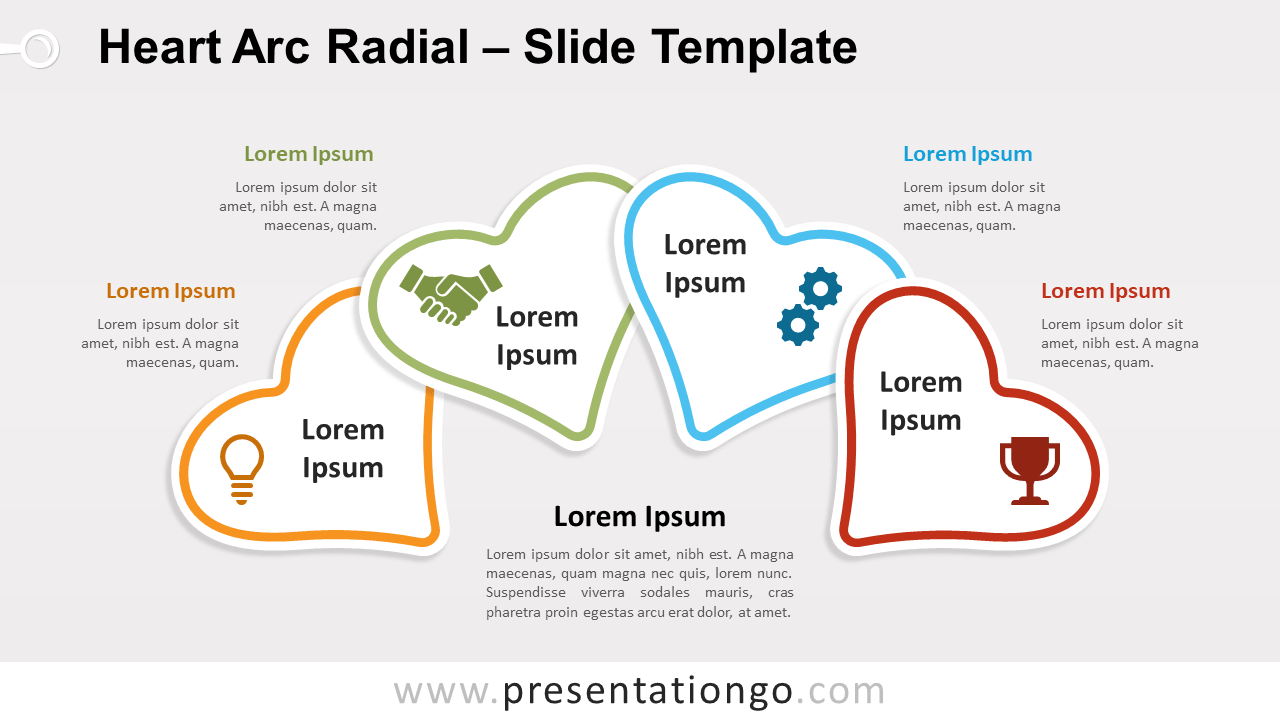
Free heart arc radial for PowerPoint and Google Slides. Radial diagram designed with four heart shapes (like stickers) aligned in a semi-circular flow.
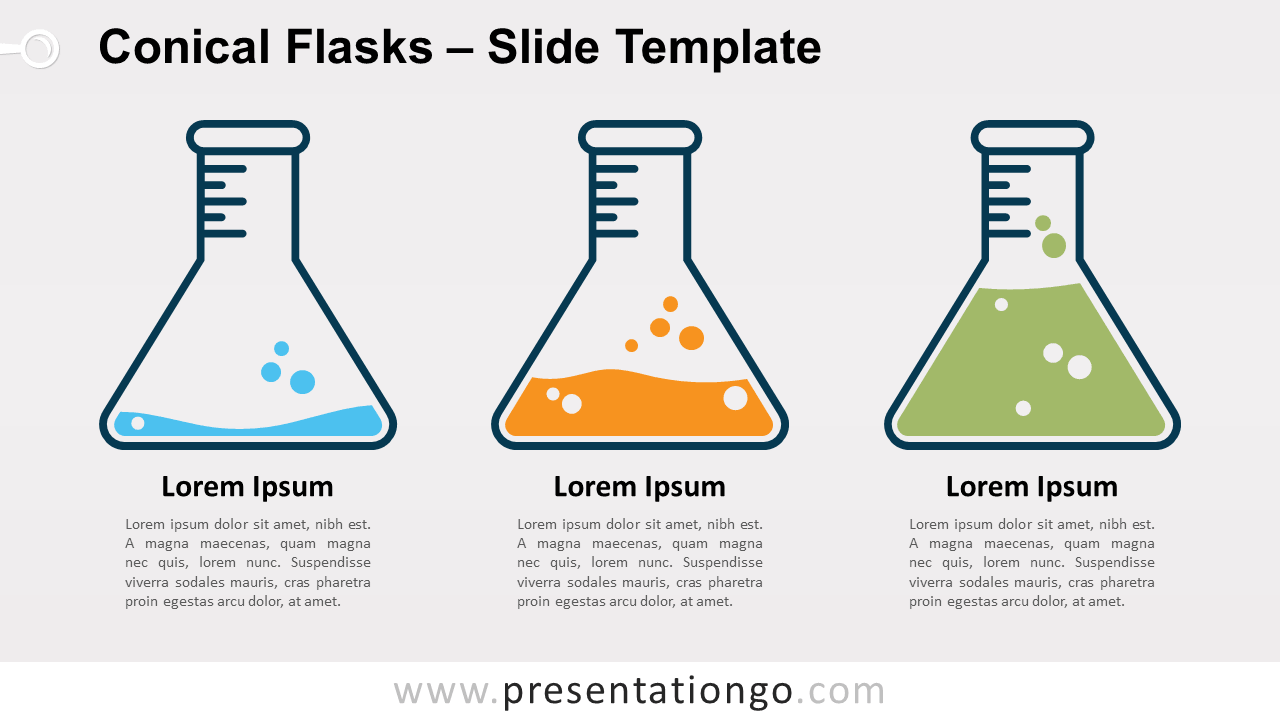
Free conical flasks for PowerPoint and Google Slides. Line design illustrations of a laboratory flask, aka Erlenmeyer flask. Editable graphics.
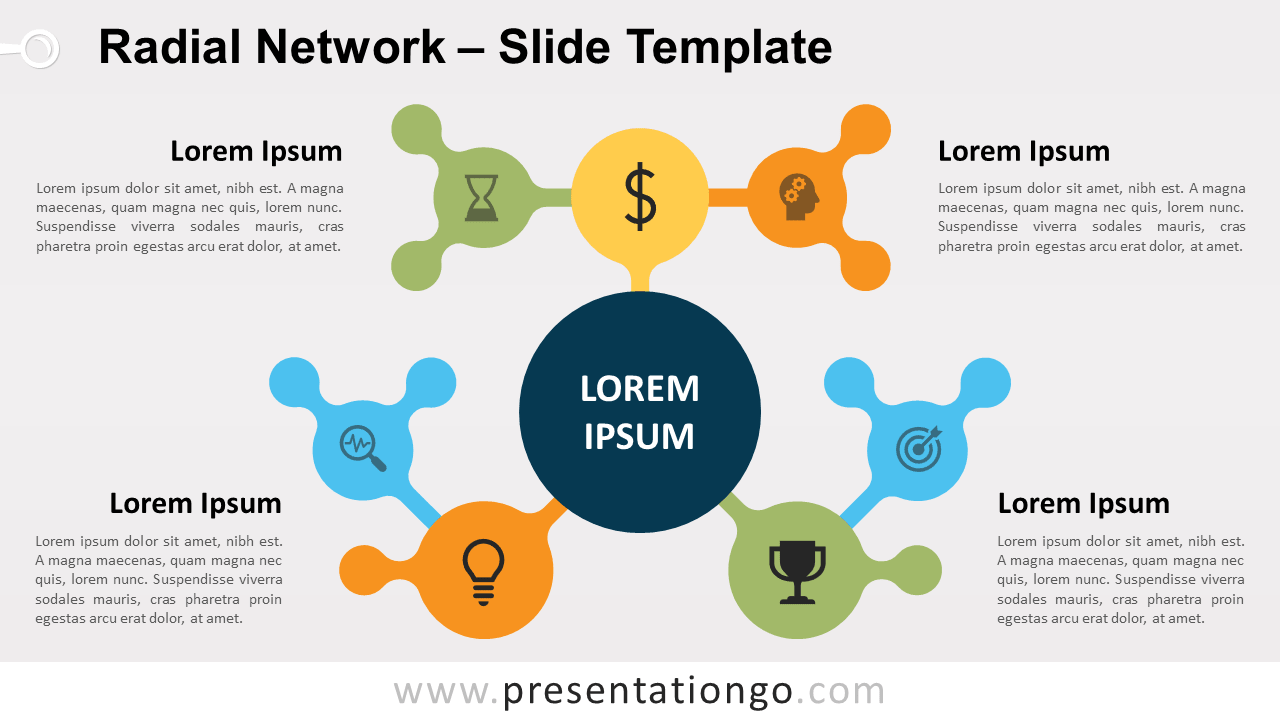
Free radial network for PowerPoint and Google Slides. Three-level radial diagram with 3 elements surrounding the central idea. Editable graphics.
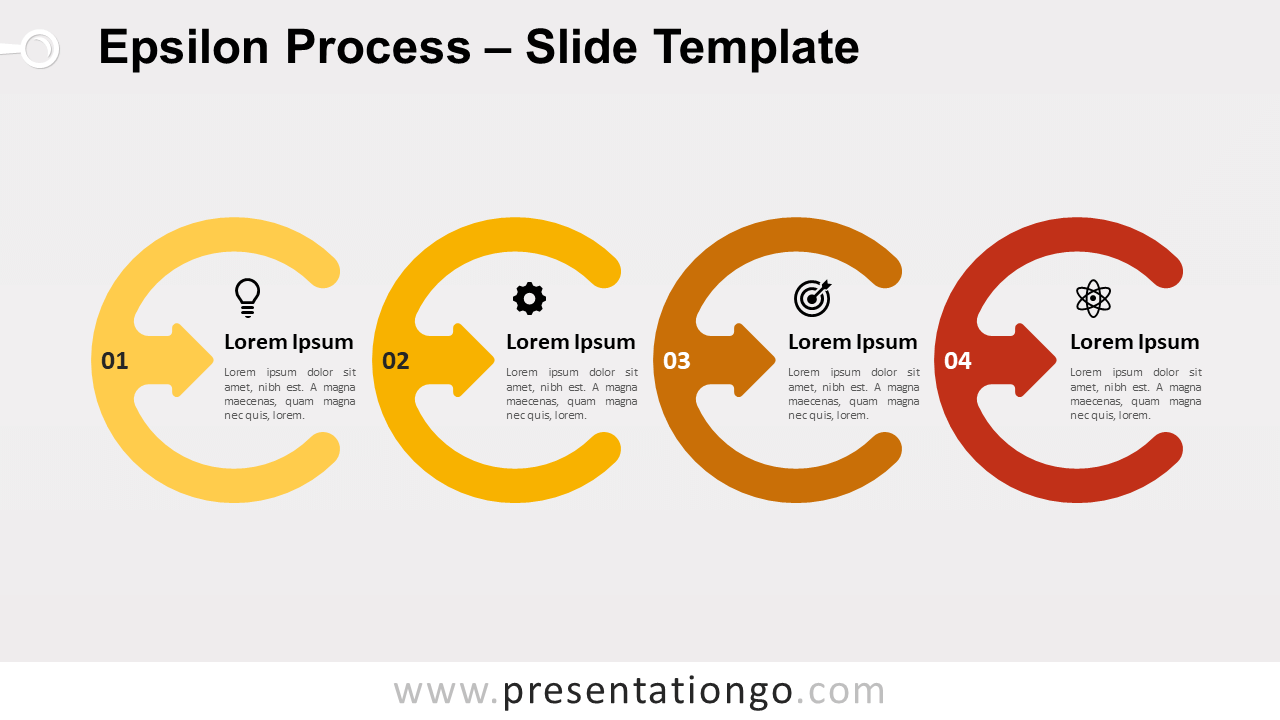
Free Epsilon process for PowerPoint and Google Slides. Process diagram designed with a series of stylish epsilon symbols. Editable graphics.
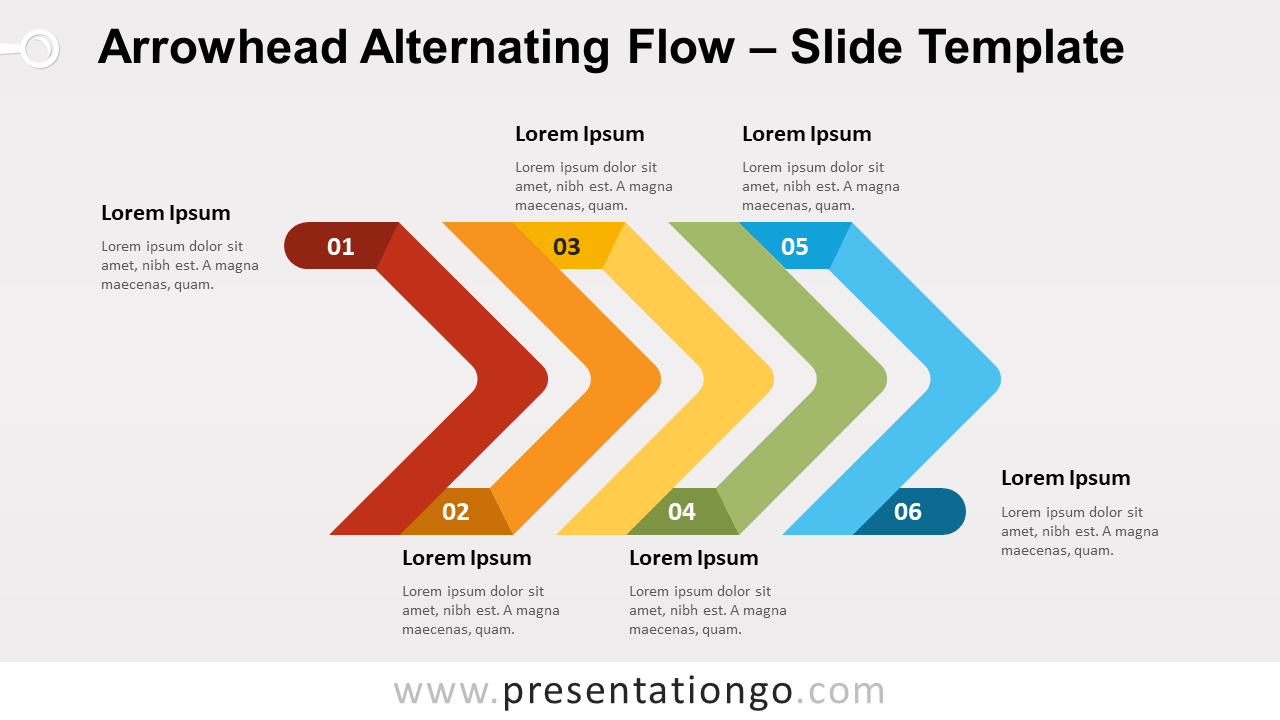
Free arrowhead alternating flow for PowerPoint and Google Slides. Process diagram designed with connected arrowheads in an alternating flow.
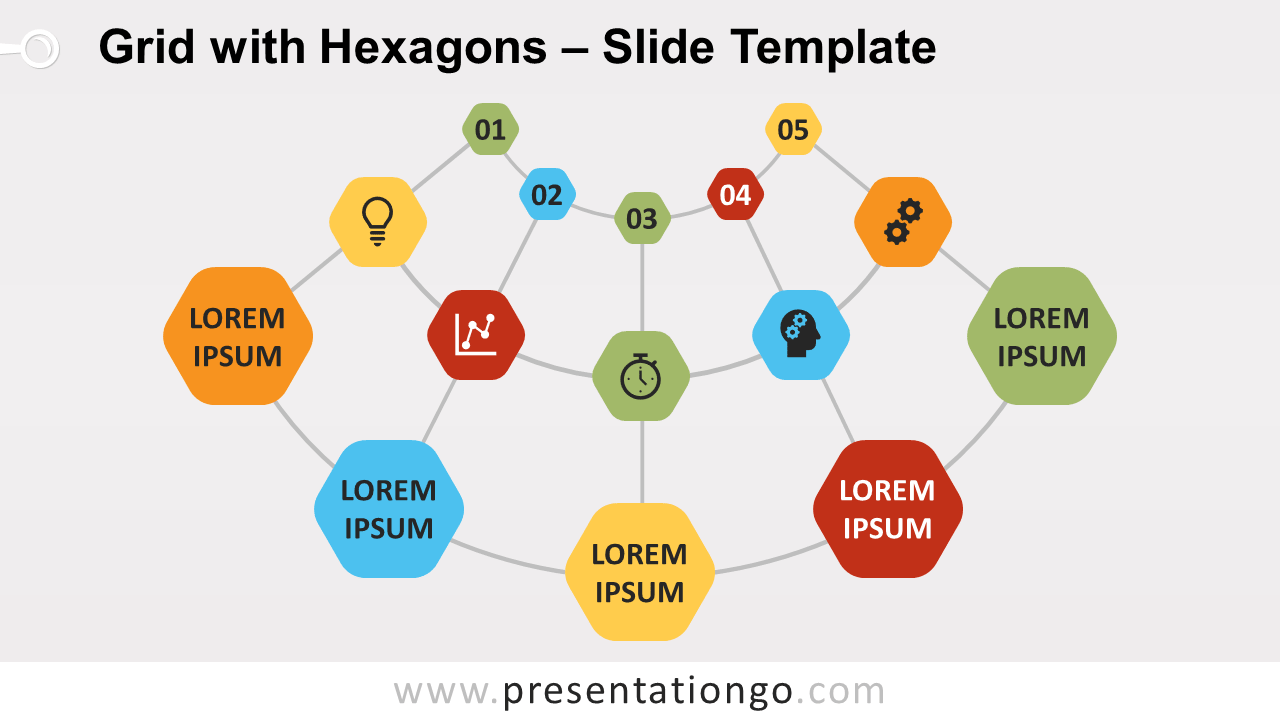
Free grid with hexagons for PowerPoint and Google Slides. A two-dimensional grid with hexagon shapes. Editable graphics with icons and text placeholders.
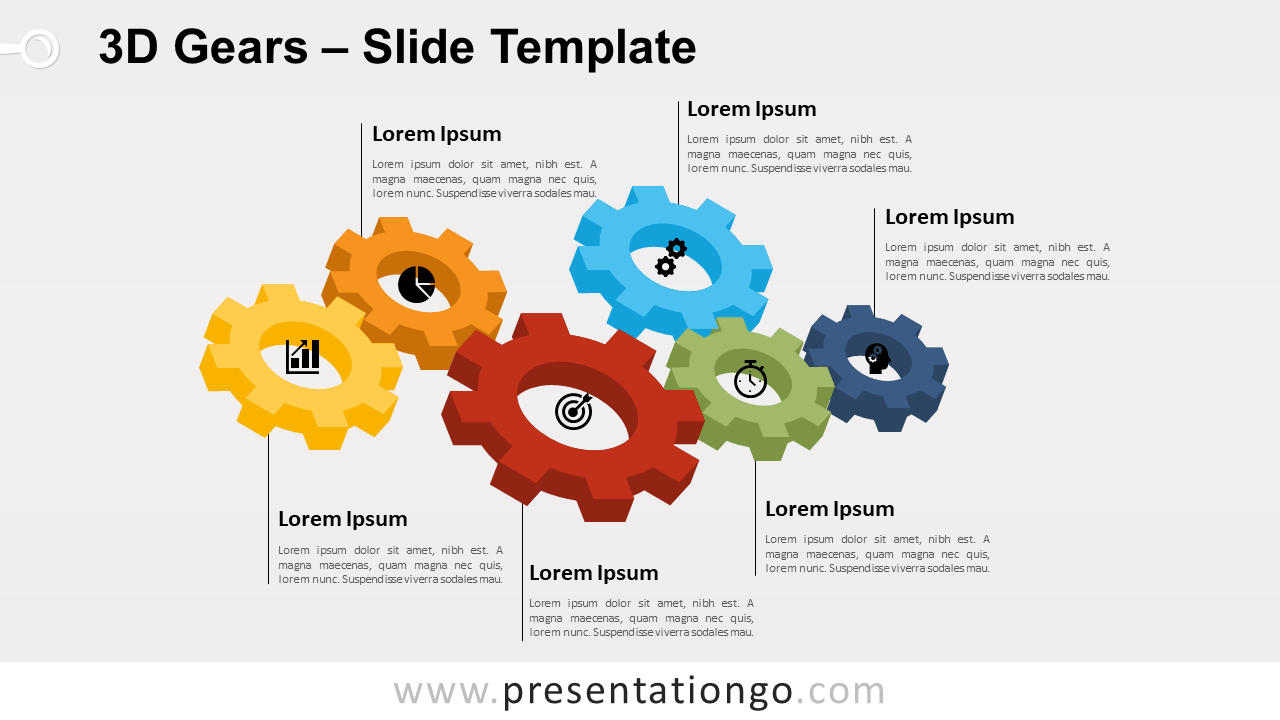
Free 3D gears for PowerPoint and Google Slides. An alternating flow of gears with a 3D effect. Perfect template to show interlocking ideas.
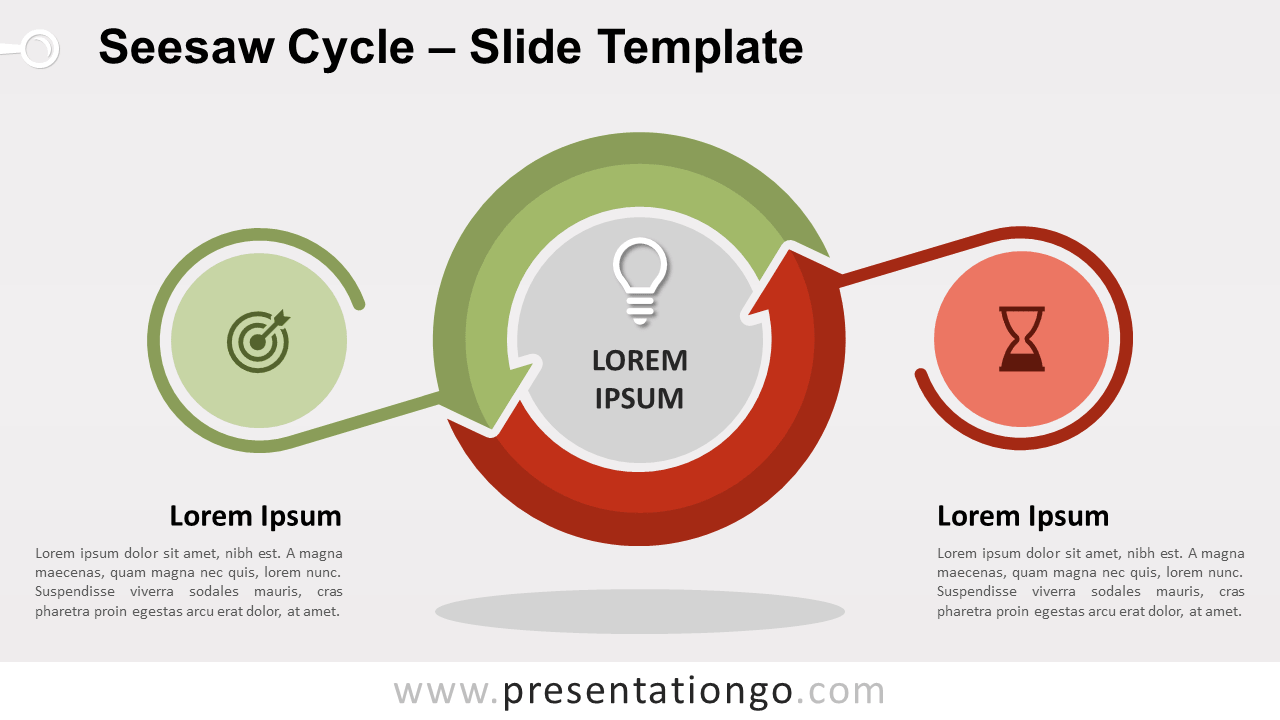
Free seesaw cycle for PowerPoint and Google Slides. Cycle diagram with two circular up-and-down arrows. Perfect to illustrate dichotomous, opposite ideas.
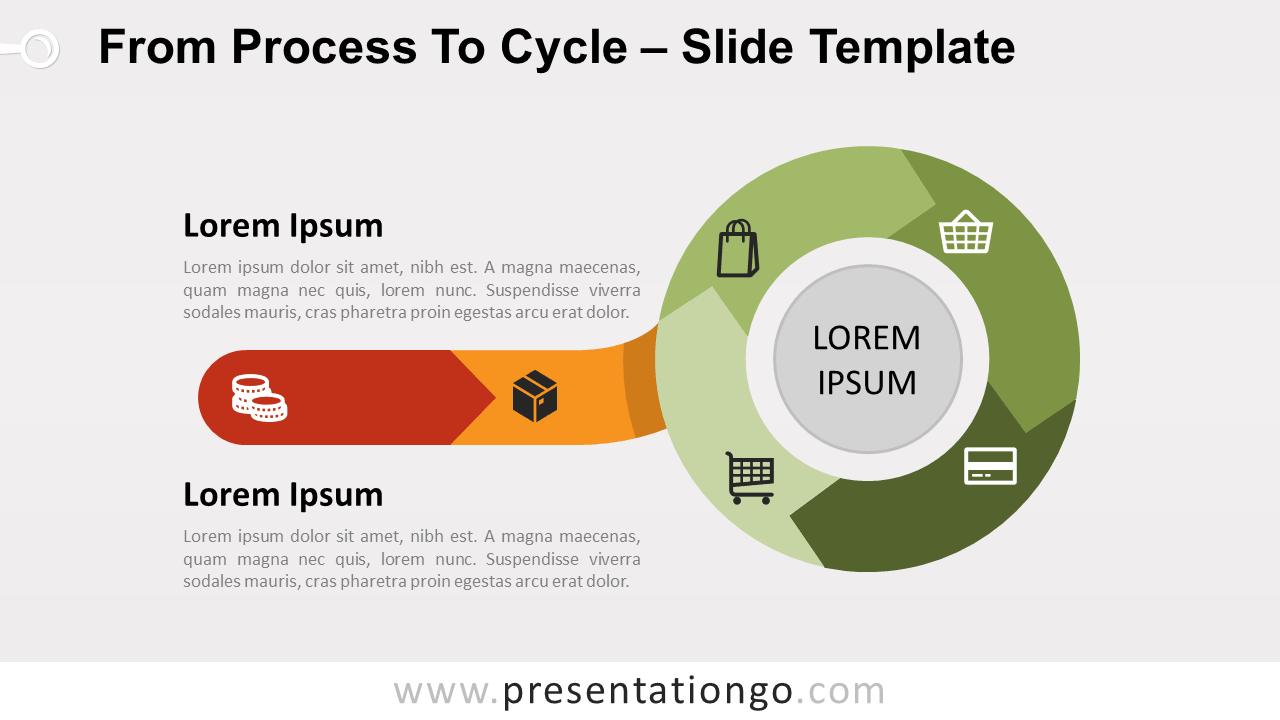
Combination of a process and a cycle diagram for PowerPoint and Google Slides. Diagram starting with a 2-step horizontal process and ending with a cycle.
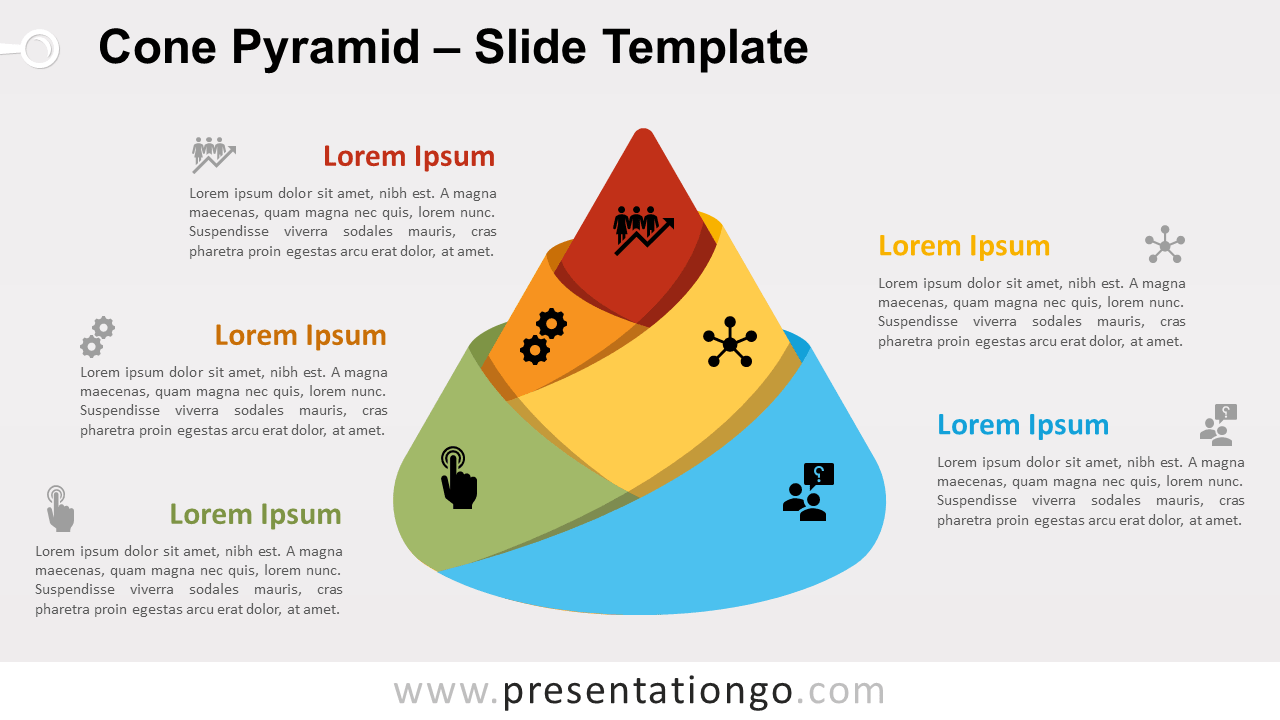
Free cone pyramid for PowerPoint and Google Slides. Infographic conical pyramid diagram designed with five layers. Shows an ascending sequence of 5 stages.
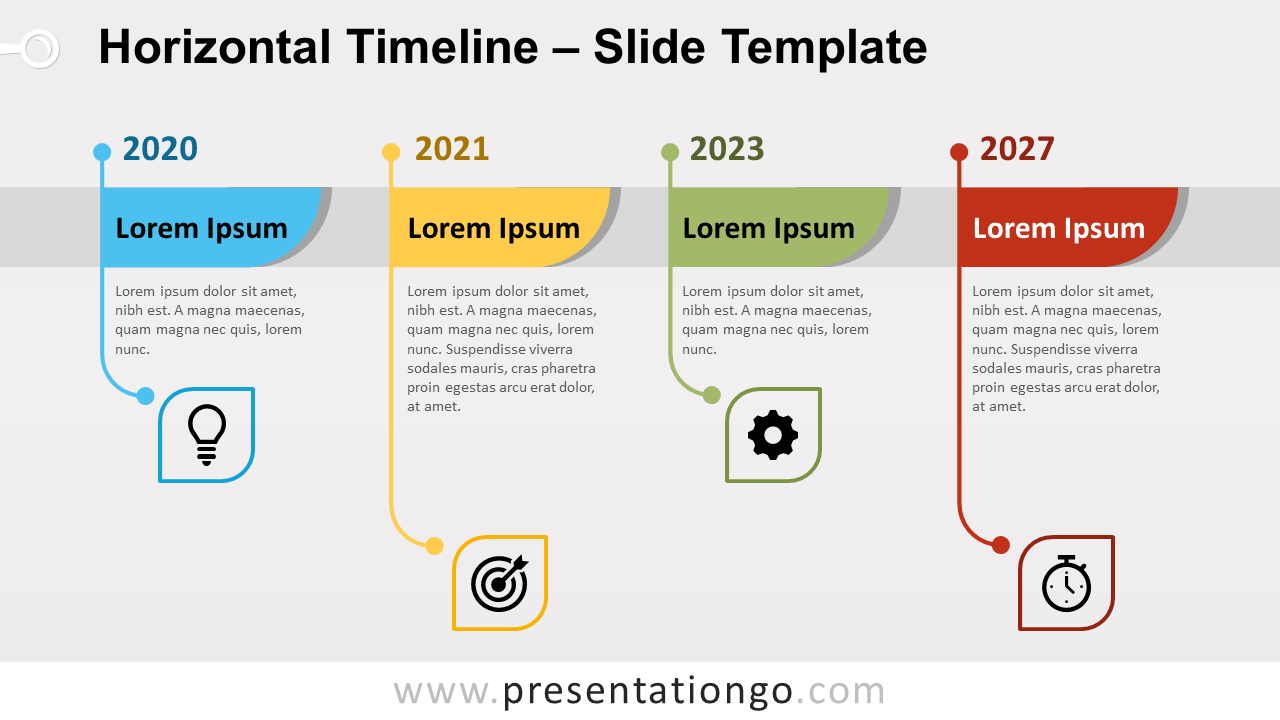
Free horizontal timeline for PowerPoint and Google Slides. Infographic horizontal timeline diagram with knife blade-shaped events.
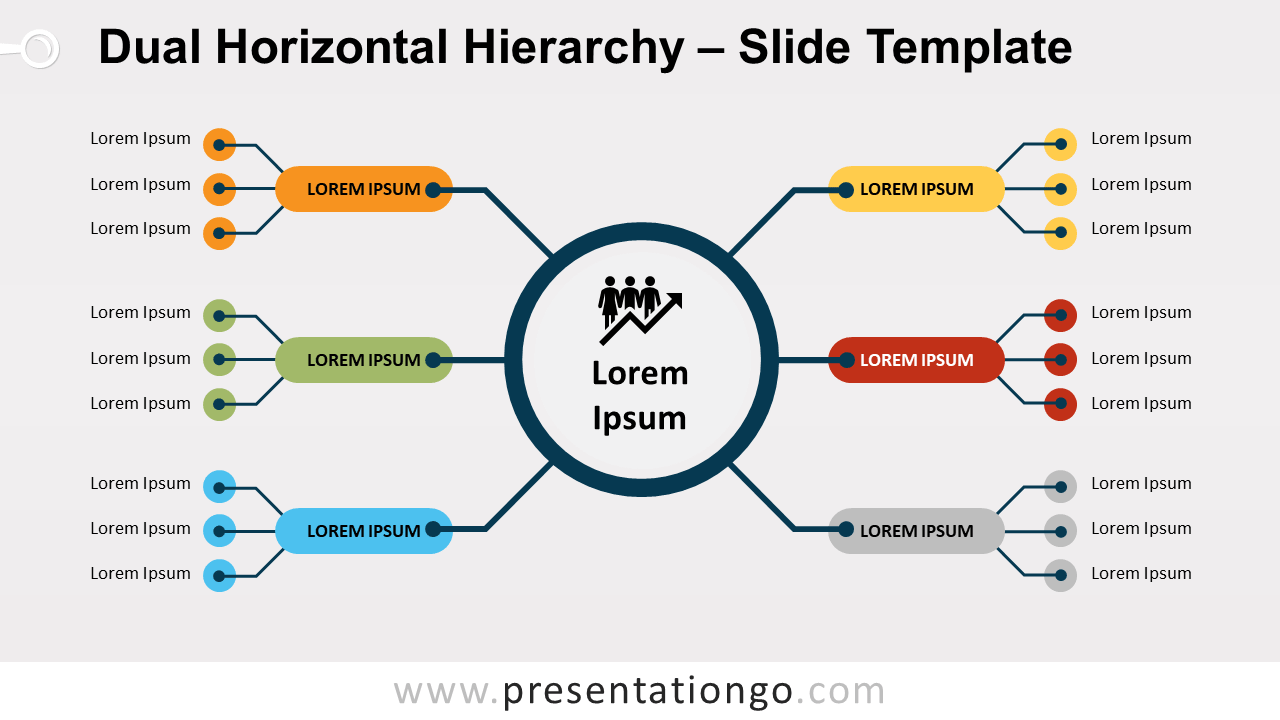
Free dual horizontal hierarchy for PowerPoint and Google Slides. A tree structure with horizontal branches. Editable graphics.
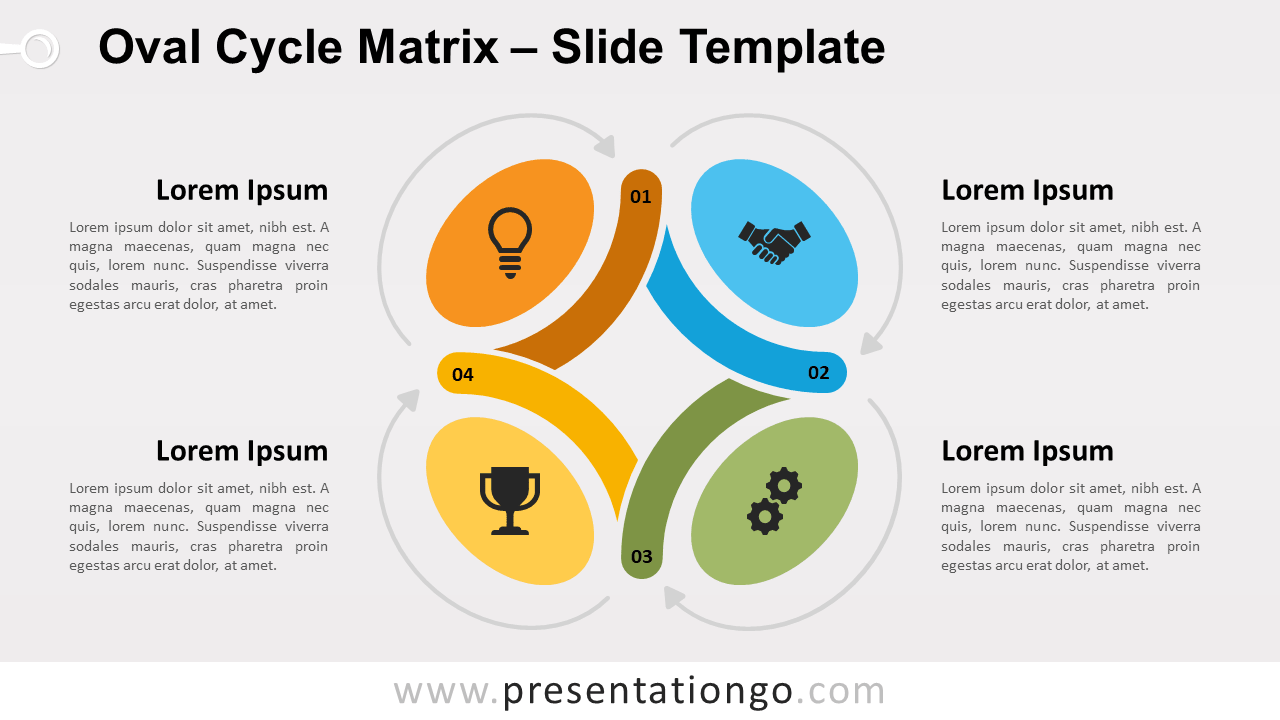
Free oval cycle matrix for PowerPoint and Google Slides. A circular diagram designed with oval shapes, arcs, and arrows. Editable graphics.
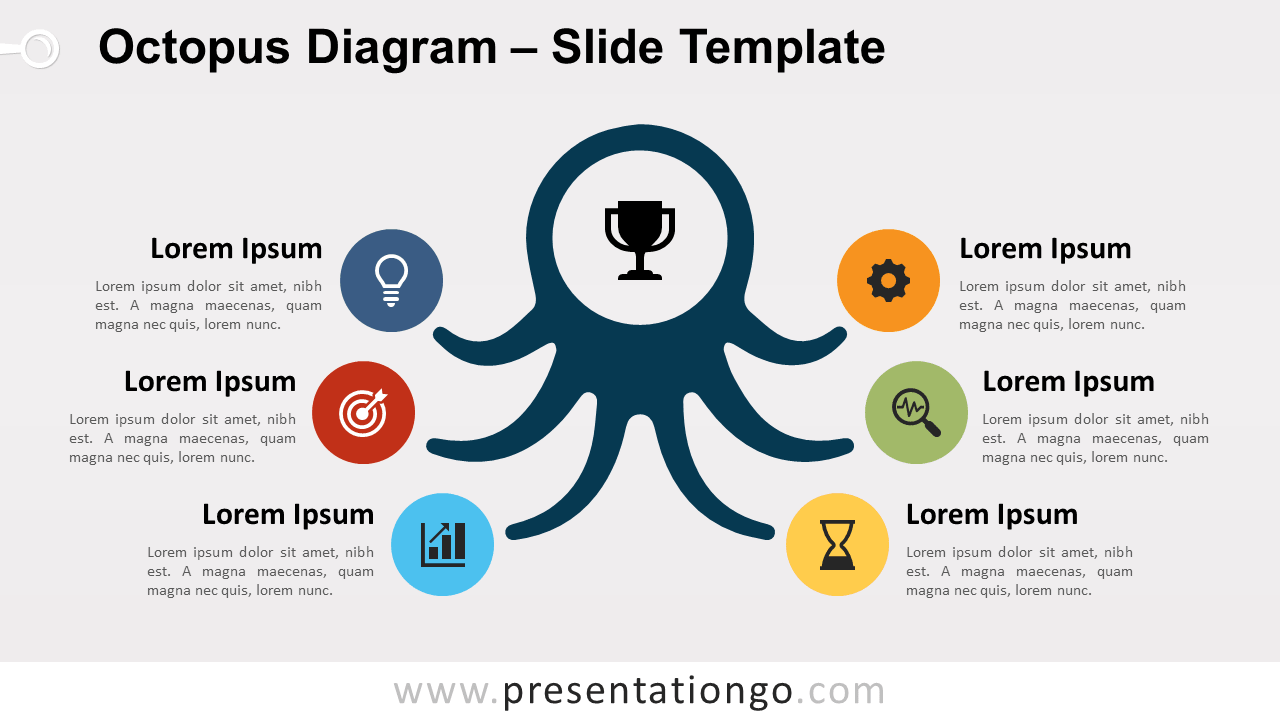
Free octopus diagram for PowerPoint and Google Slides. Minimalist octopus with six tentacles. Creative design to illustrate a radial cluster diagram.
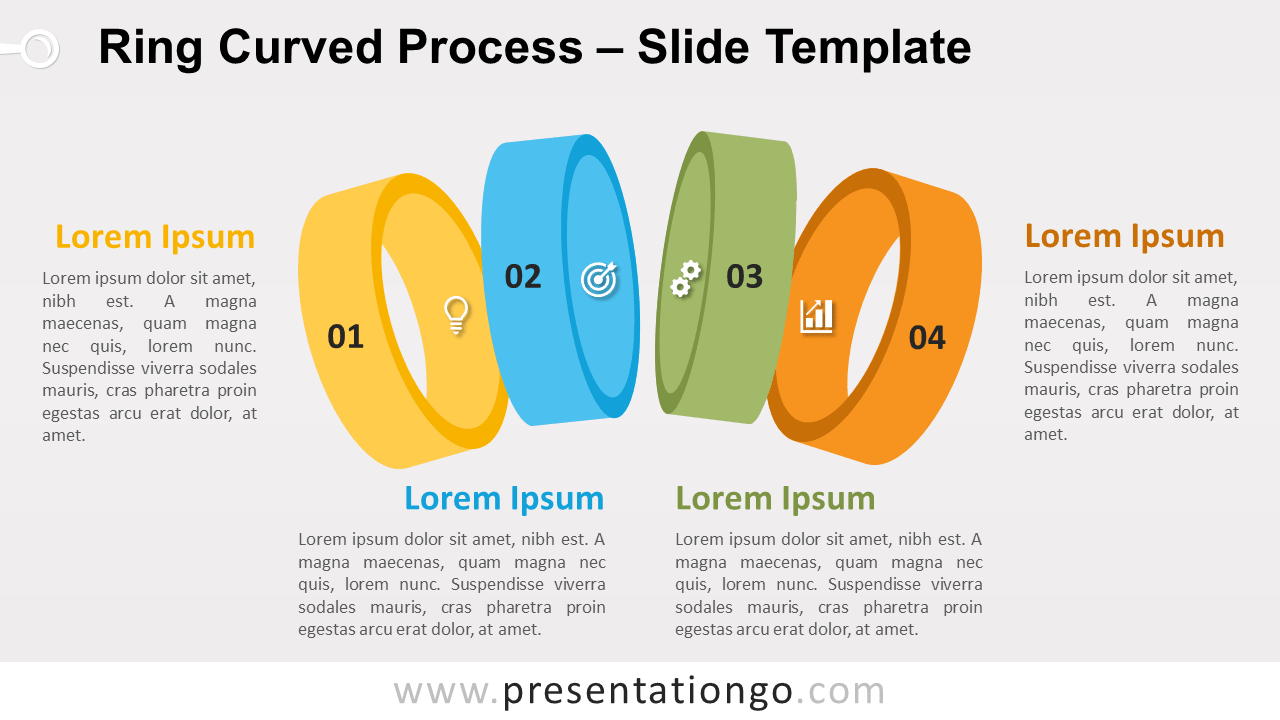
Free ring curved process for PowerPoint and Google Slides. A series of 4 colorful rings aligned with a subtle curving path. Great as a process diagram.
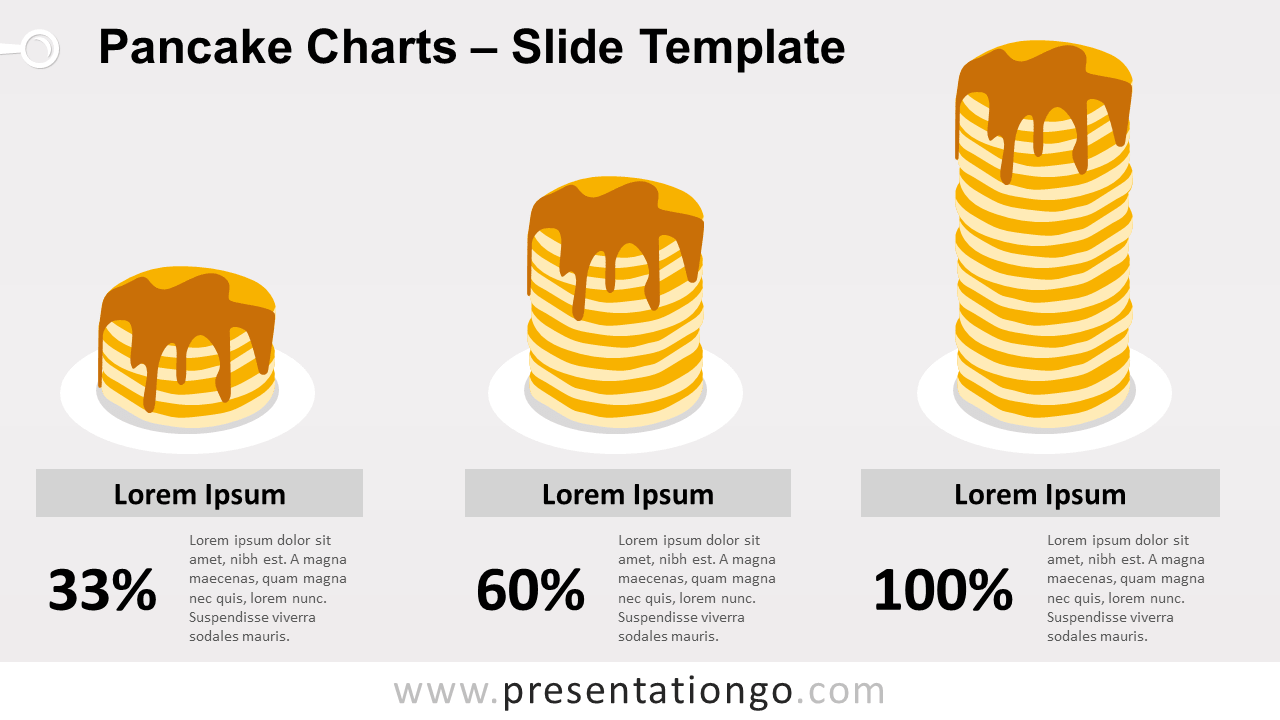
Free pancake charts for PowerPoint and Google Slides. This adjustable pile of pancakes is a fun alternative to show quantitative data. Editable graphics.
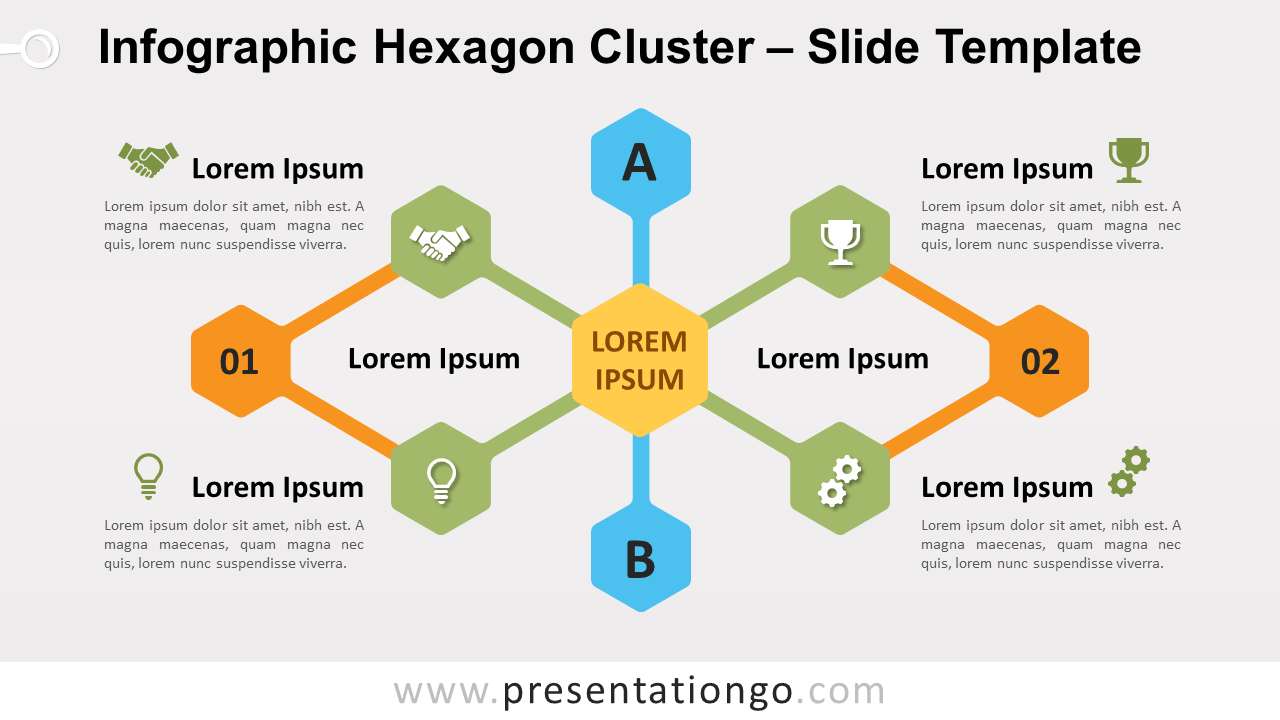
Free infographic hexagon cluster for PowerPoint and Google Slides. A series of hexagon shapes connected to a central idea. Node links to show hierarchies.
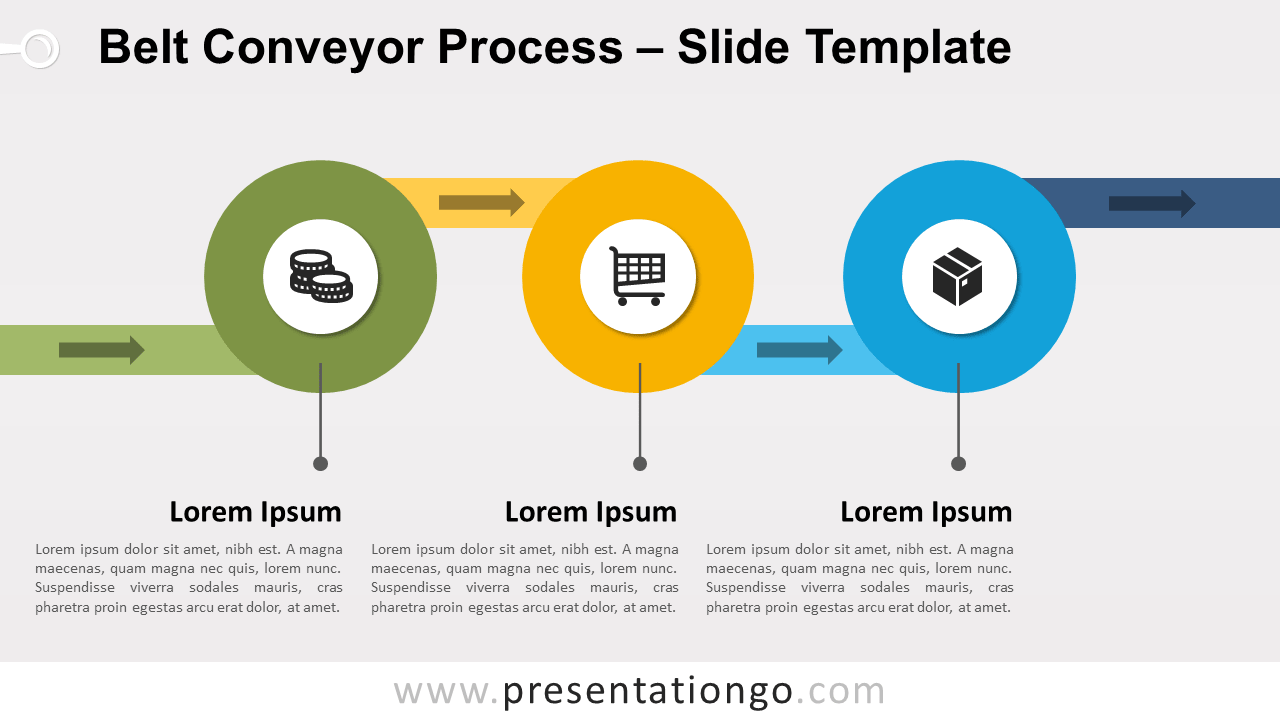
Free belt conveyor process for PowerPoint and Google Slides. A 3-step alternating process that emphasizes direction. 100% editable graphics.
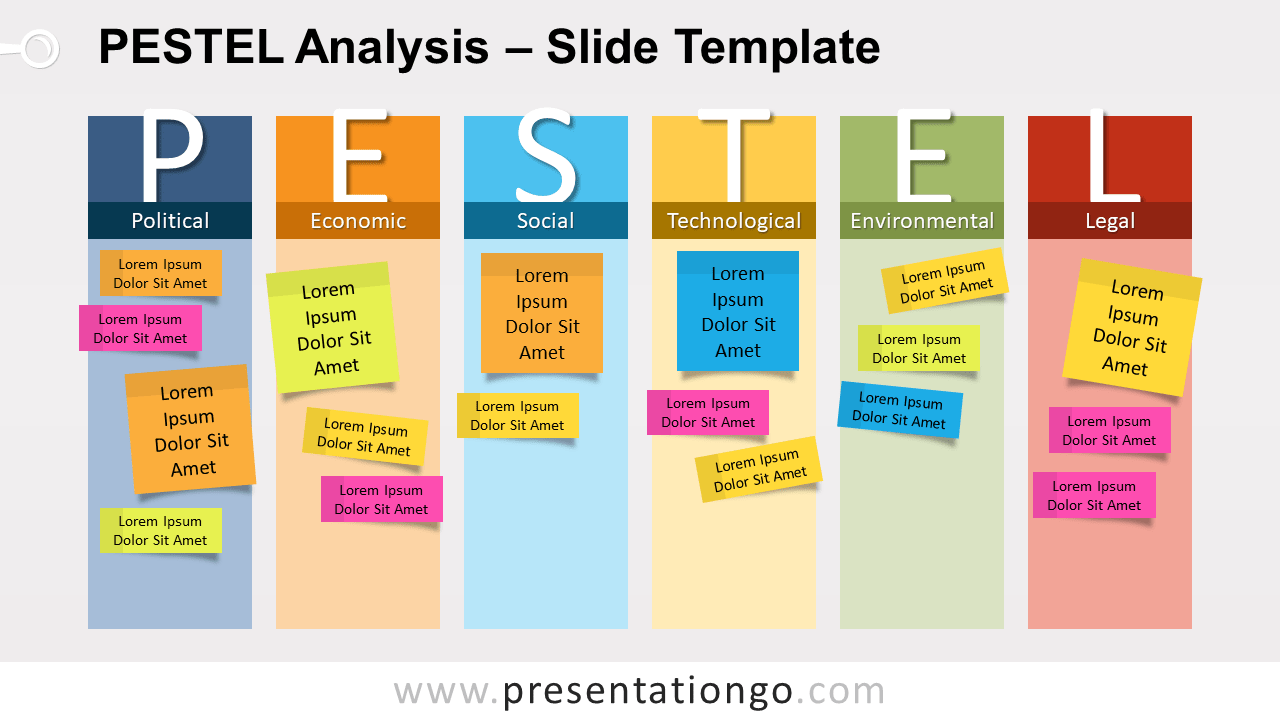
Free PESTEL analysis for PowerPoint and Google Slides. A template slide to help you audit external influences on your business or on any project.
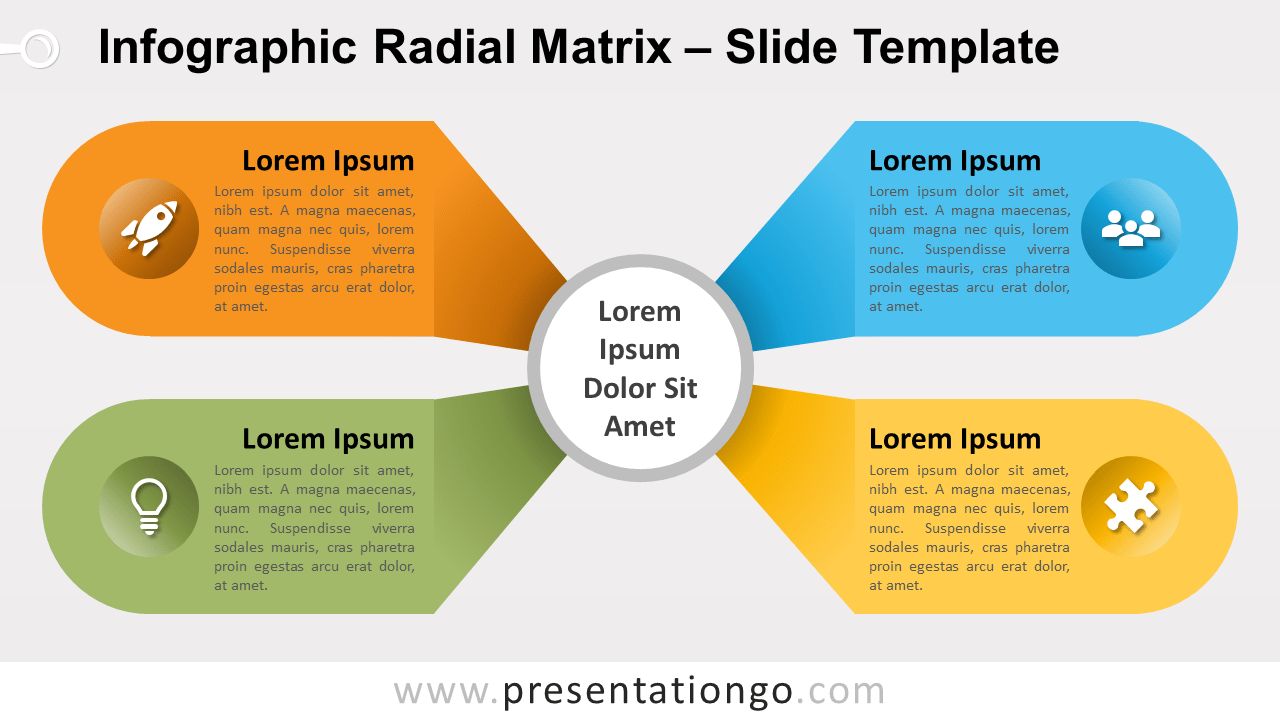
Free infographic radial matrix for PowerPoint and Google Slides. A matrix designed with four banners that relate to a central idea. Editable graphics.
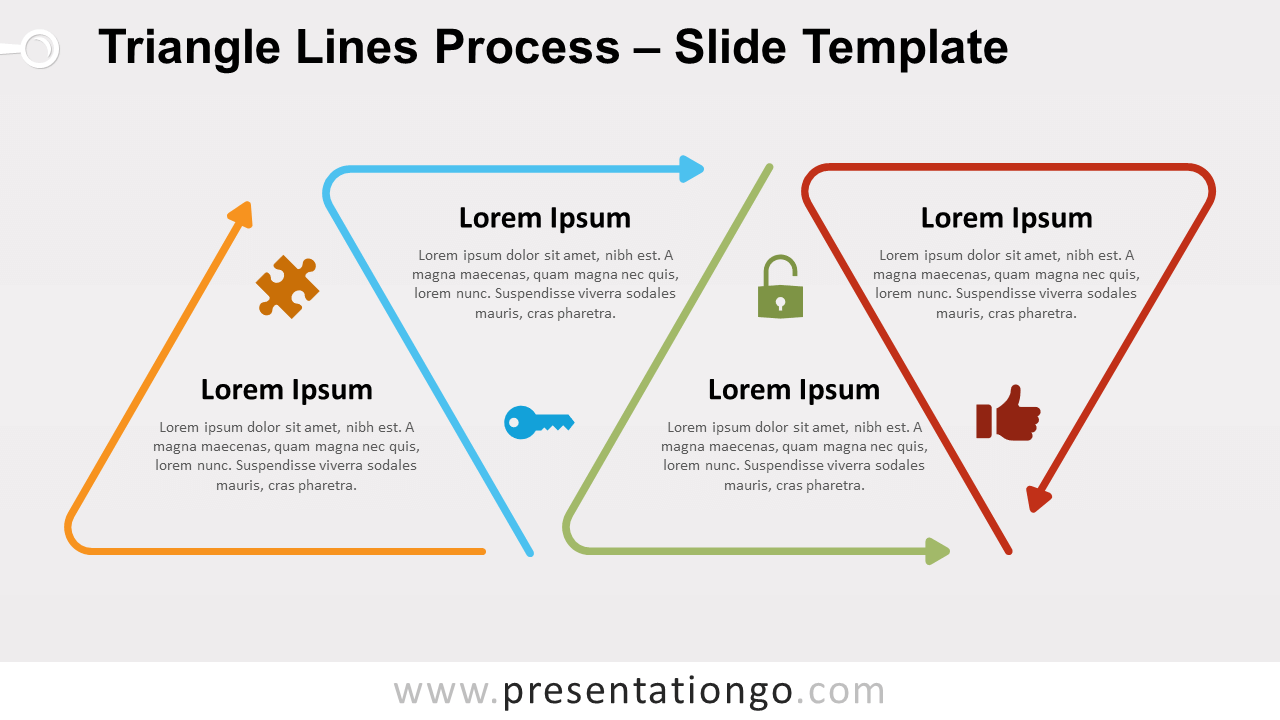
Free triangle lines process for PowerPoint and Google Slides. Triangle outline shapes aligned in horizontal flow. Editable graphics with icons and text.