Loading resources…
Total 1760 resources
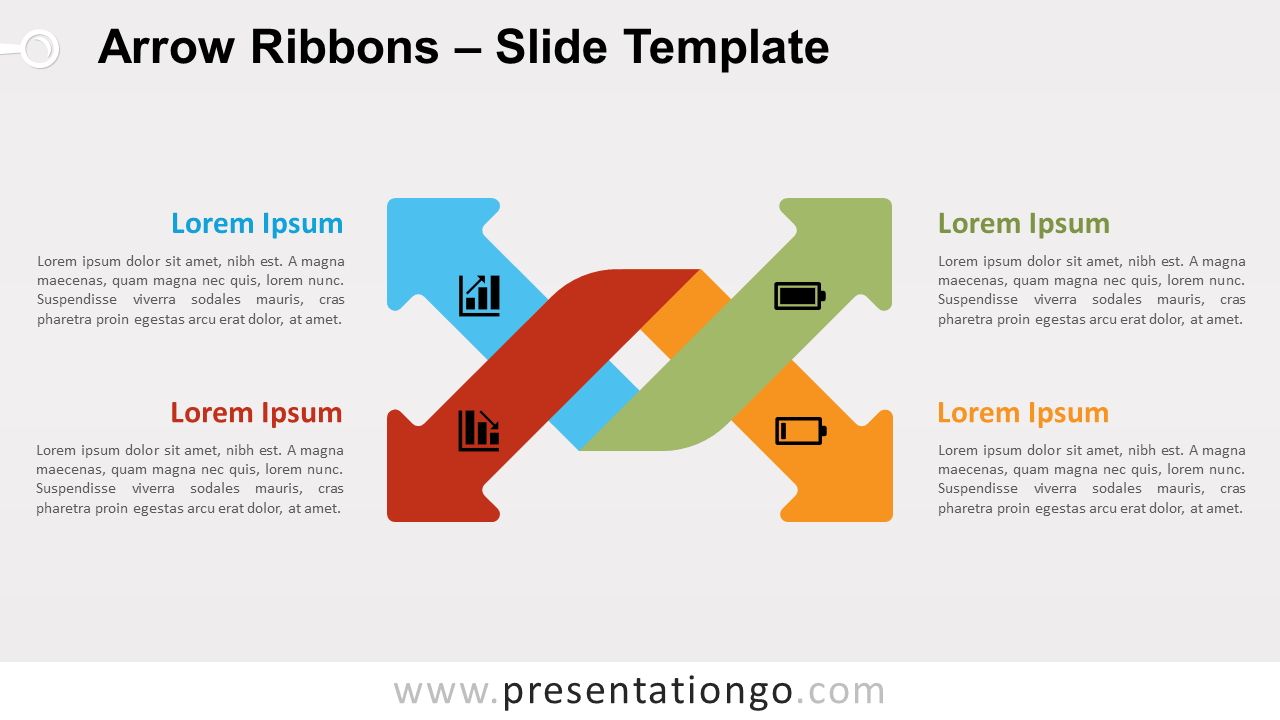
Free arrow ribbons for PowerPoint and Google Slides. A versatile infographic for your slides with 2 intertwined arrows. Editable graphics.
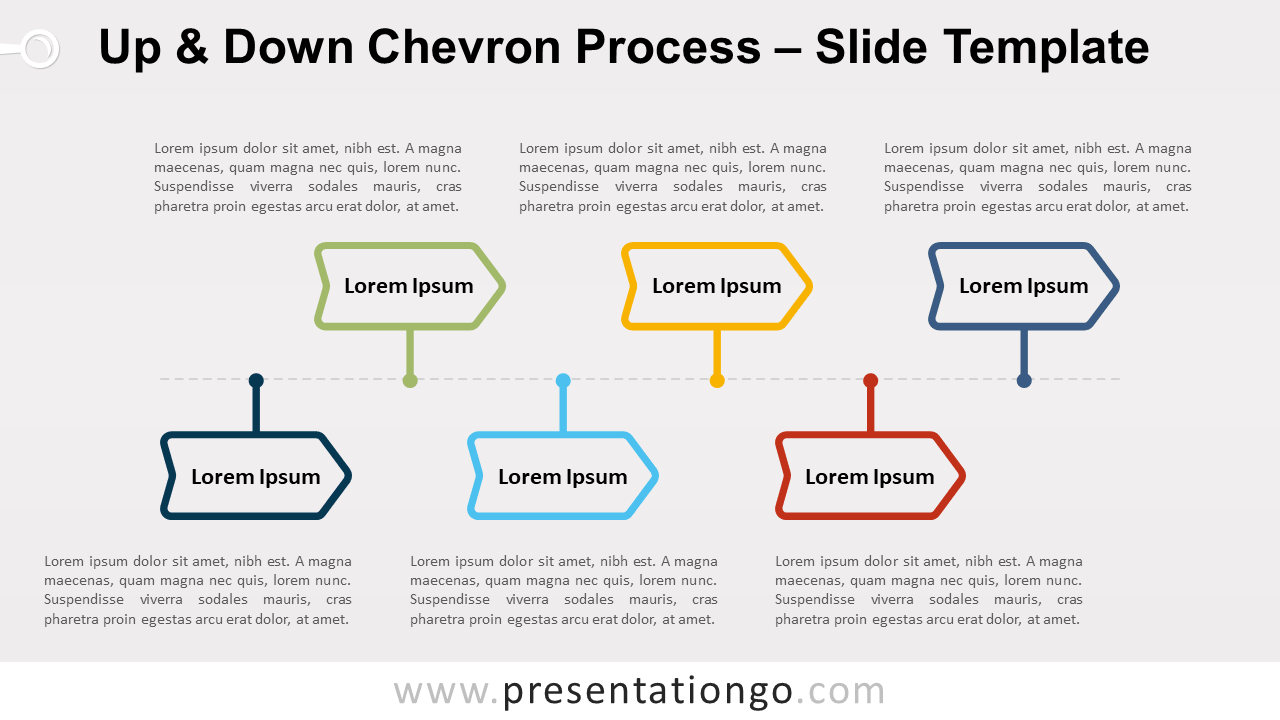
Free up and down chevron process for PowerPoint and Google Slides. Linear process diagram with upside-down directional chevron arrows on a horizontal line.
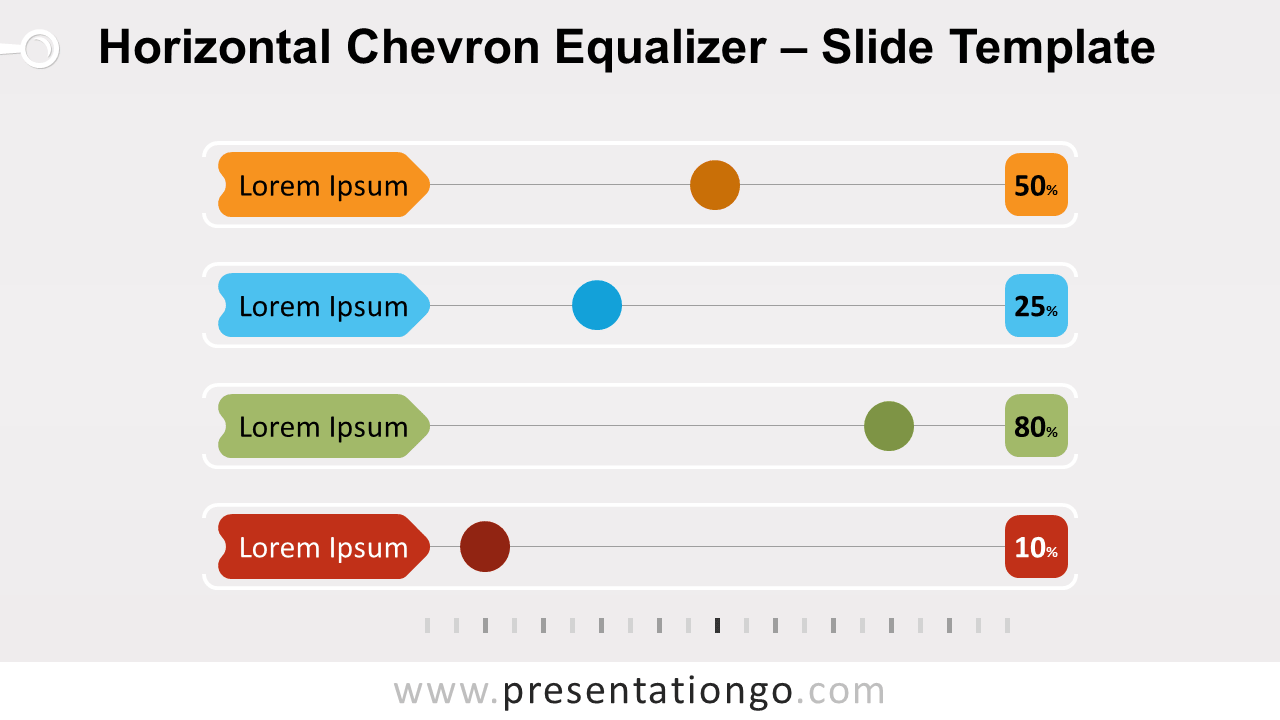
Free horizontal equalizer chevron equalizer for PowerPoint and Google Slides. An editable non-data-driven chart to illustrate and compare percentages.
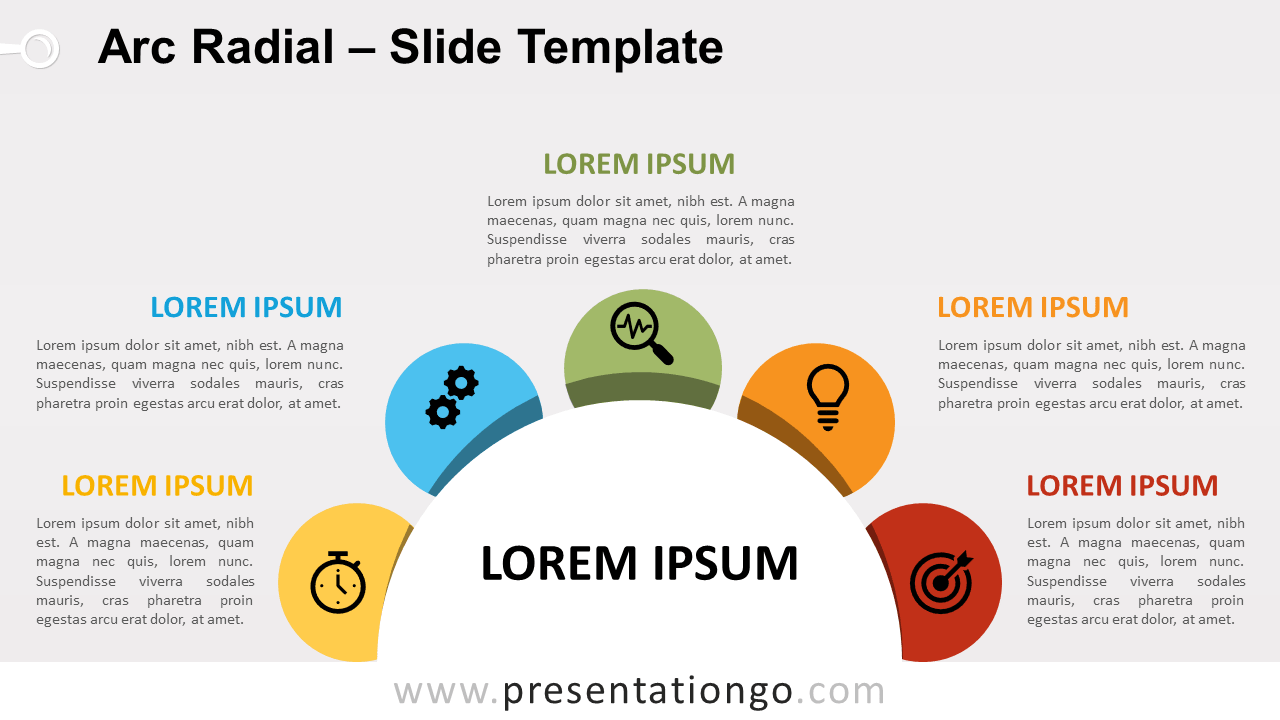
Free arc radial for PowerPoint and Google Slides. Five circle shapes around a semi-circle. An editable multi-stage diagram to explain a central concept.
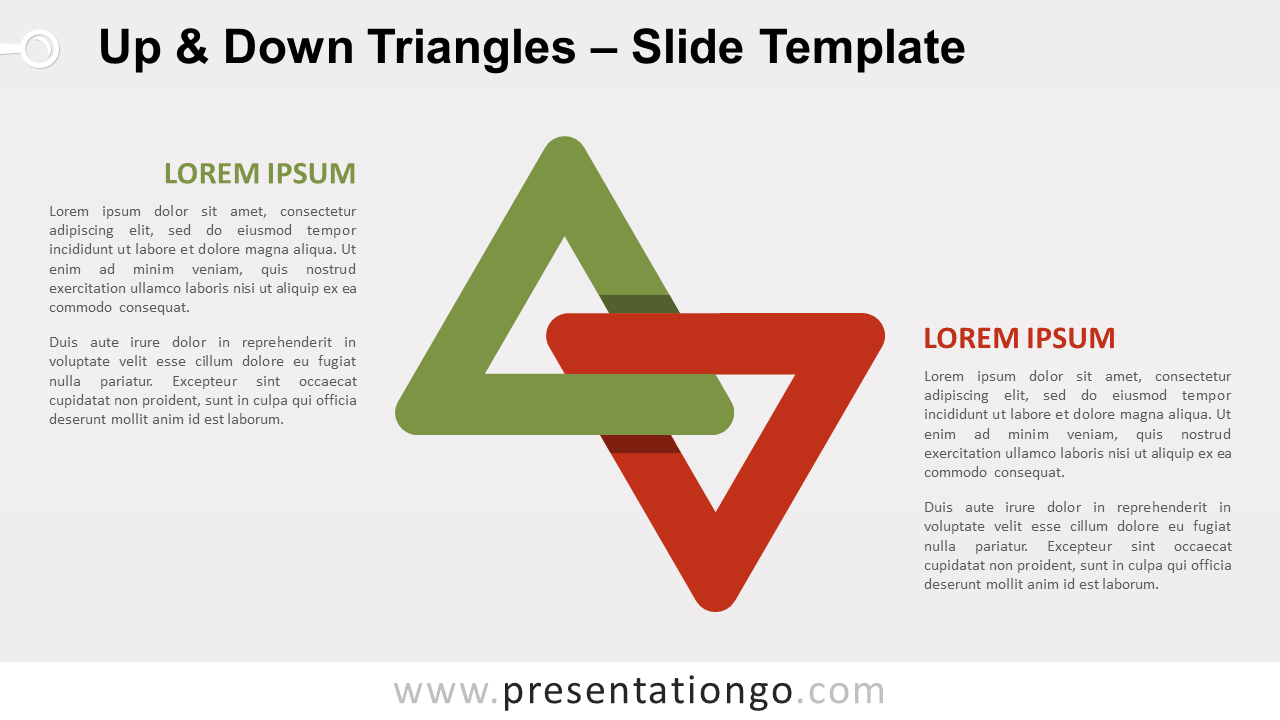
Free up and down triangles for PowerPoint and Google Slides. 2 entwined triangles pointing upwards and downwards. Great to show opposite ideas.
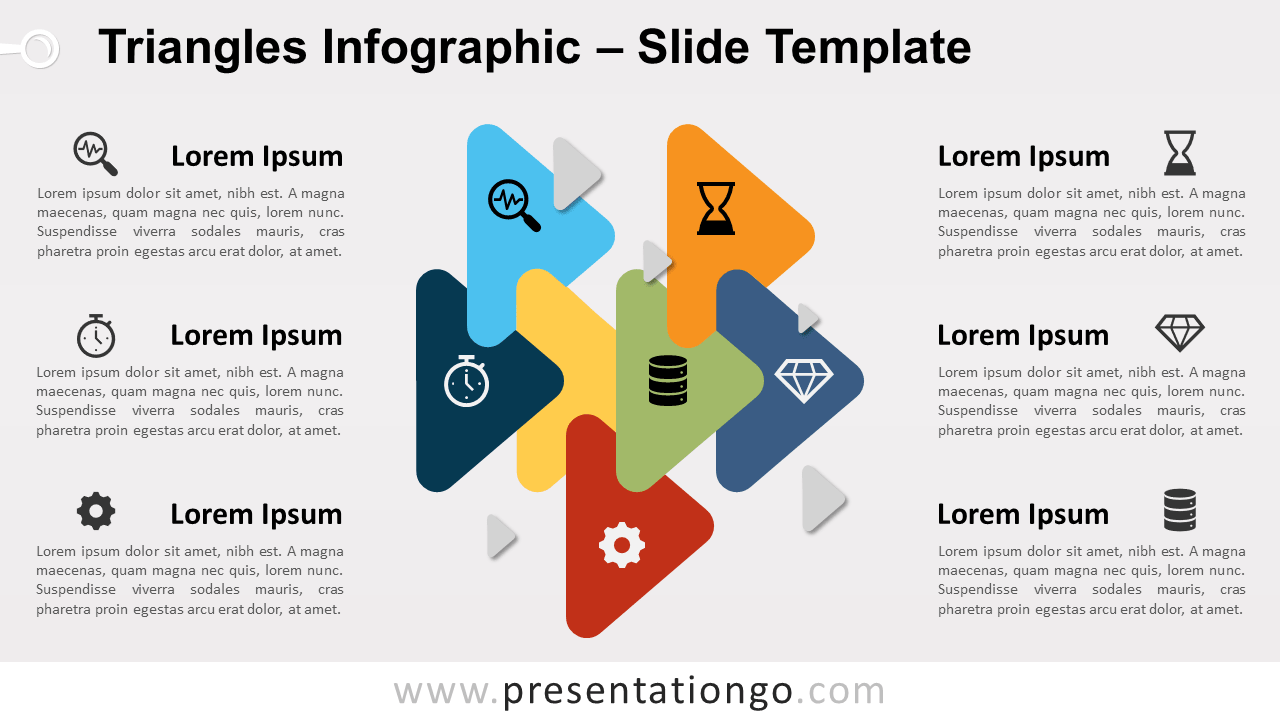
Free triangle relationship for PowerPoint and Google Slides. A multipurpose diagram to emphasize direction. Designed with editable rounded triangles.
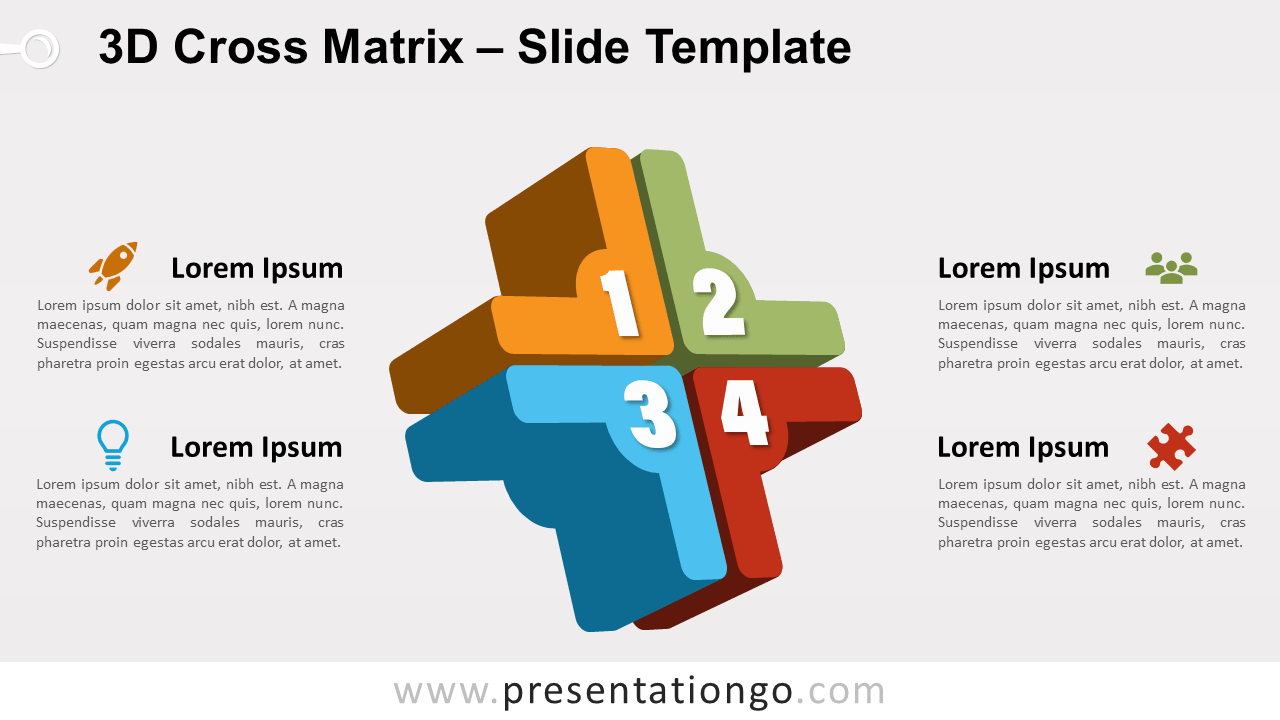
Free 3D cross matrix for PowerPoint and Google Slides. Colorful 3D rotated cross with 4 editable parts. Creative infographic as a matrix or a cycle diagram.
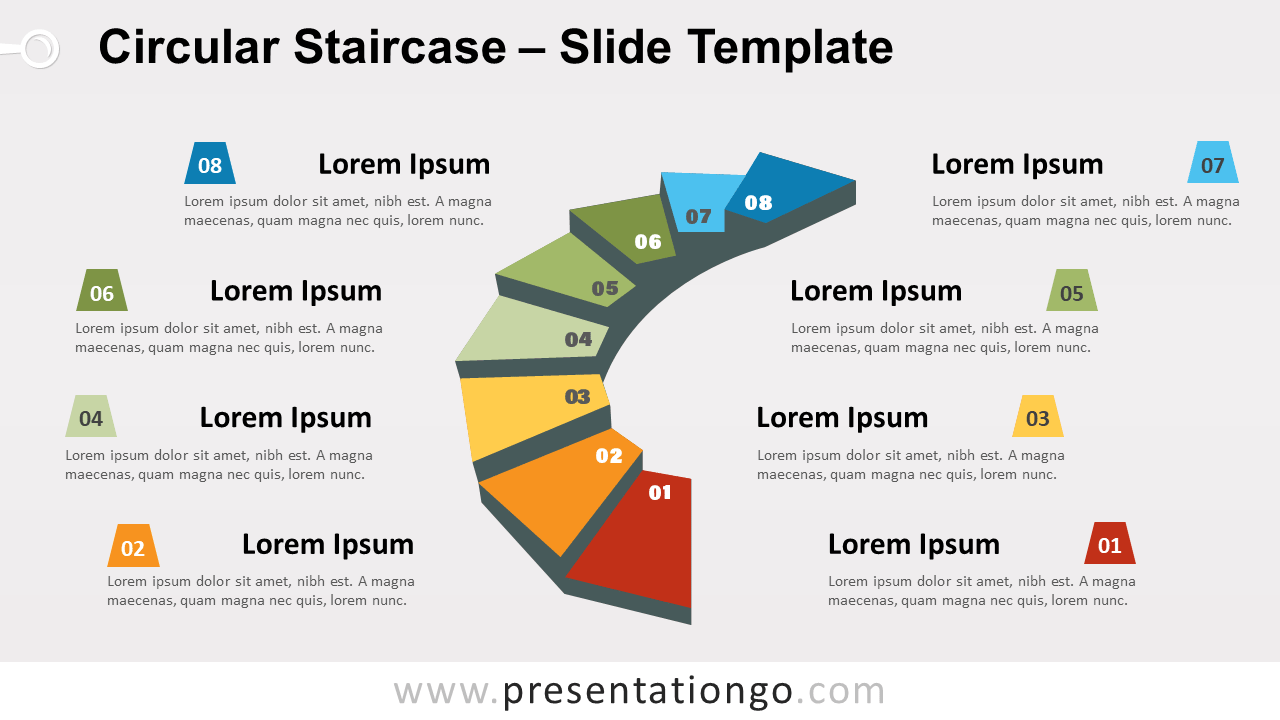
Free circular staircase for PowerPoint and Google Slides. Curved staircase with 8 colorful stairs. Editable graphics with numbers and text placeholders.
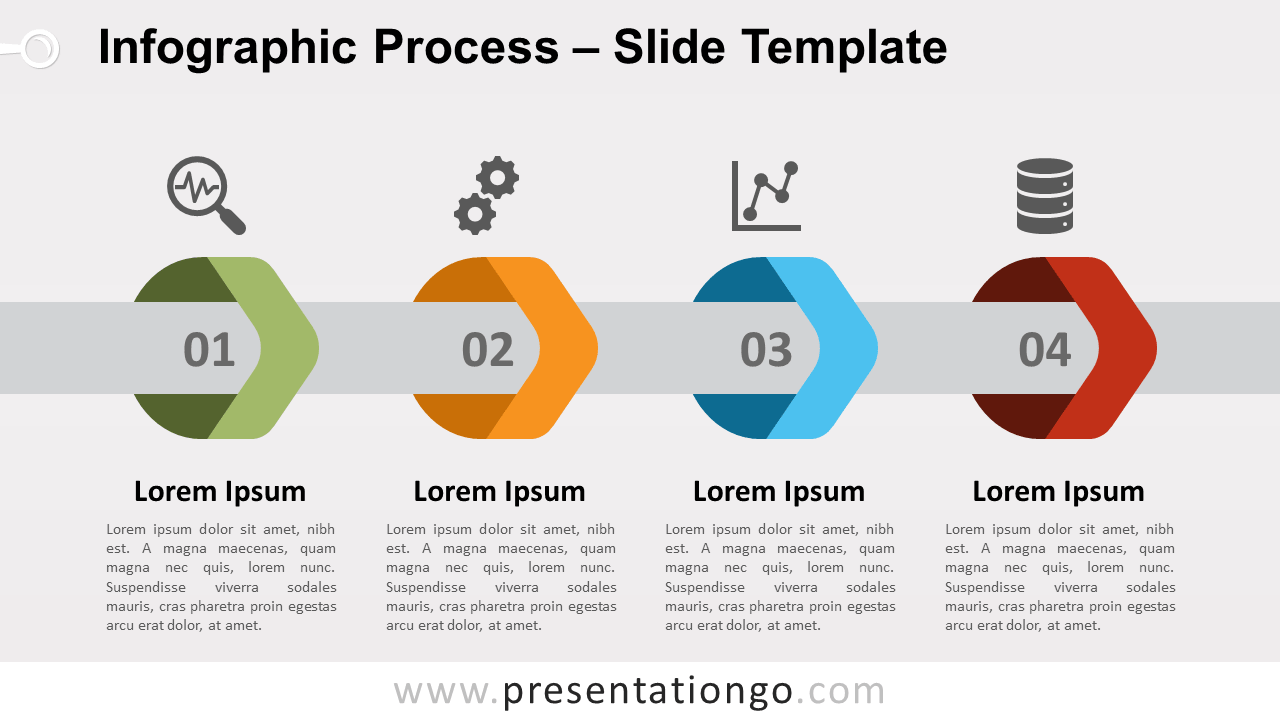
Free infographic process for PowerPoint and Google Slides. Simple horizontal linear process diagram with colorful arrows or rings. Editable graphics.
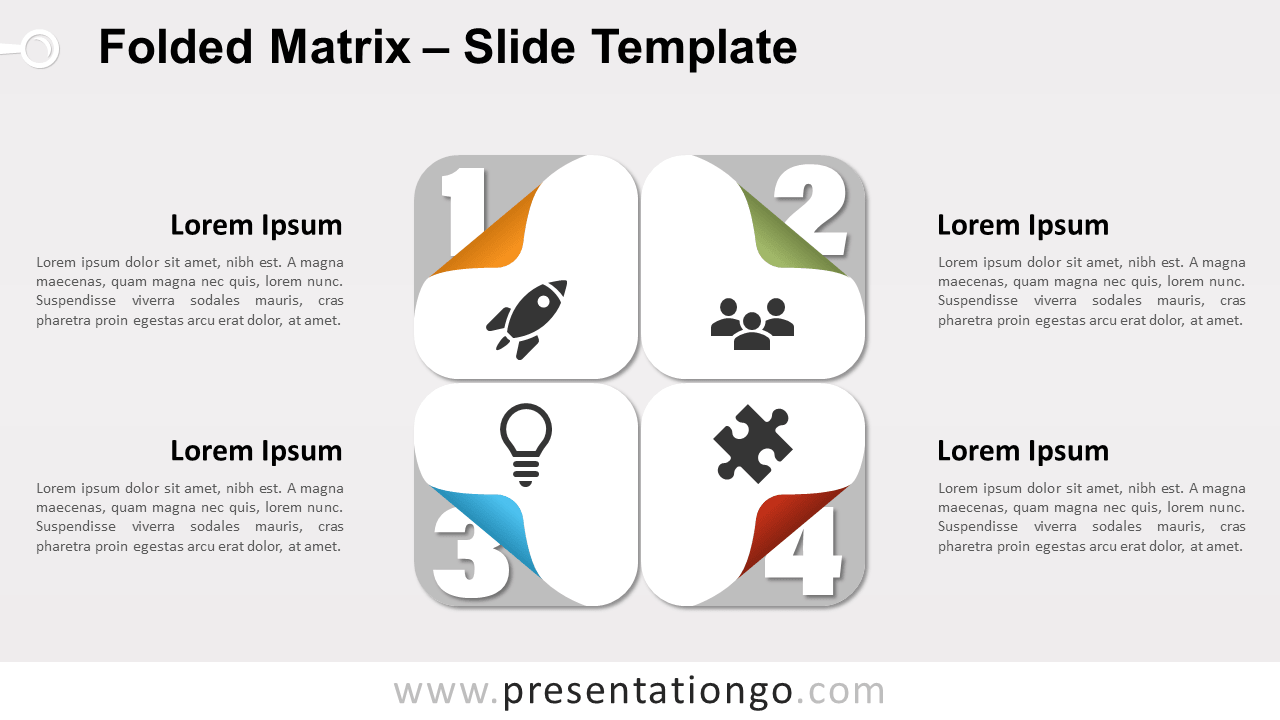
Free folded matrix for PowerPoint and Google Slides. Four rounded square sheets of paper with the corners folded (revealing different colors and numbers).
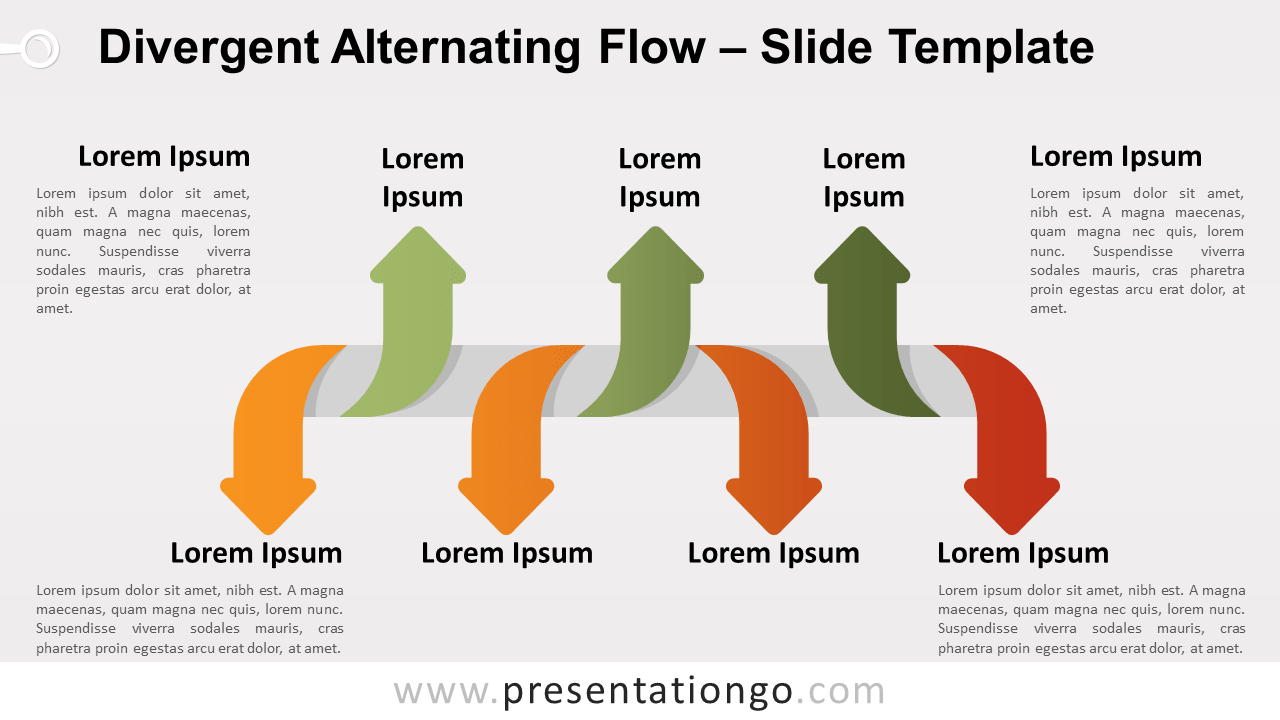
Free divergent alternating flow for PowerPoint and Google Slides. Colorful horizontal process diagram with diverging curved up-and-down arrows.
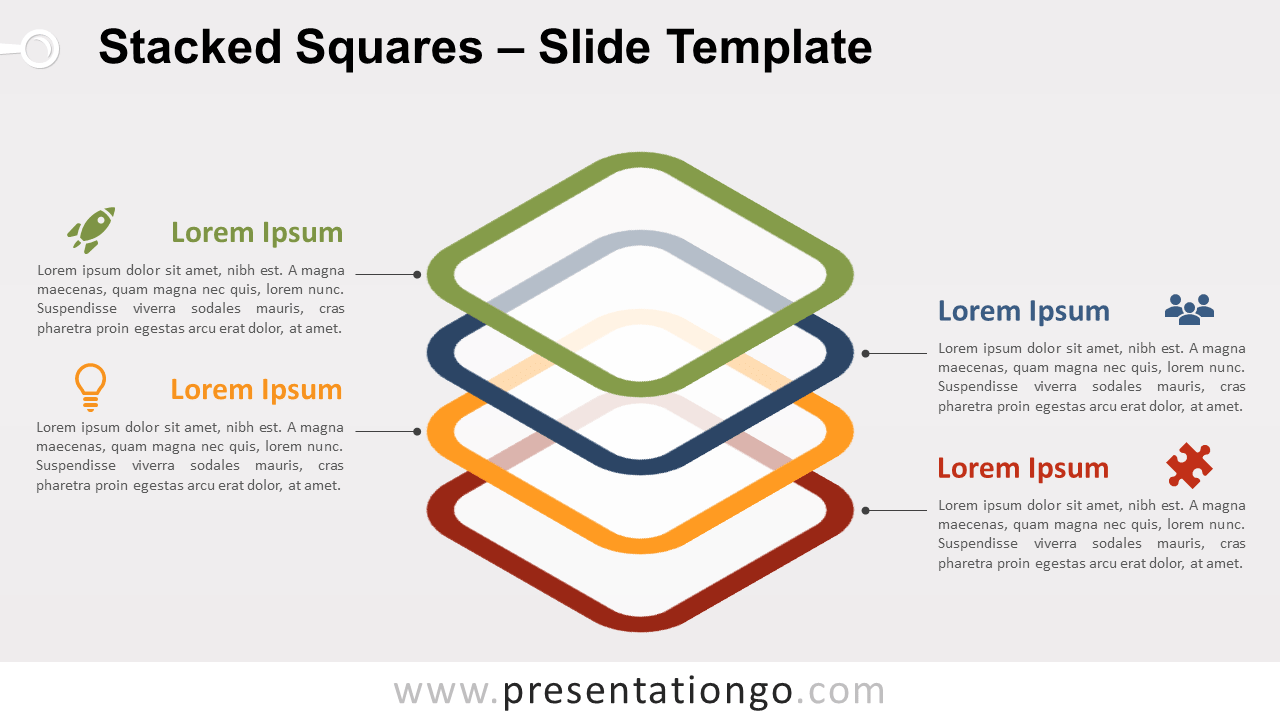
Free stacked squares diagram for PowerPoint. Stacked rhombus outlines designed with 3-D rotated rounded square shapes. For a vertical list or a process.
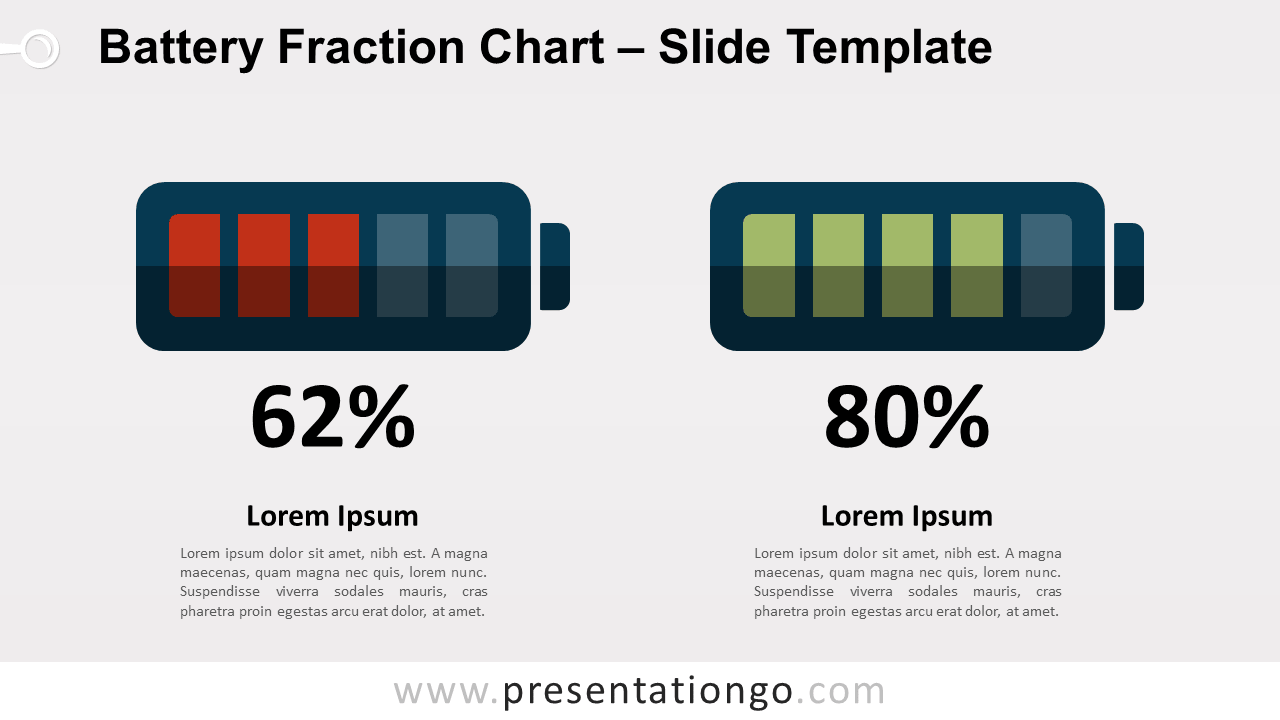
Free battery fraction chart for PowerPoint and Google Slides. 2 flat-design batteries with charge indicator. Great to compare quantitative results.
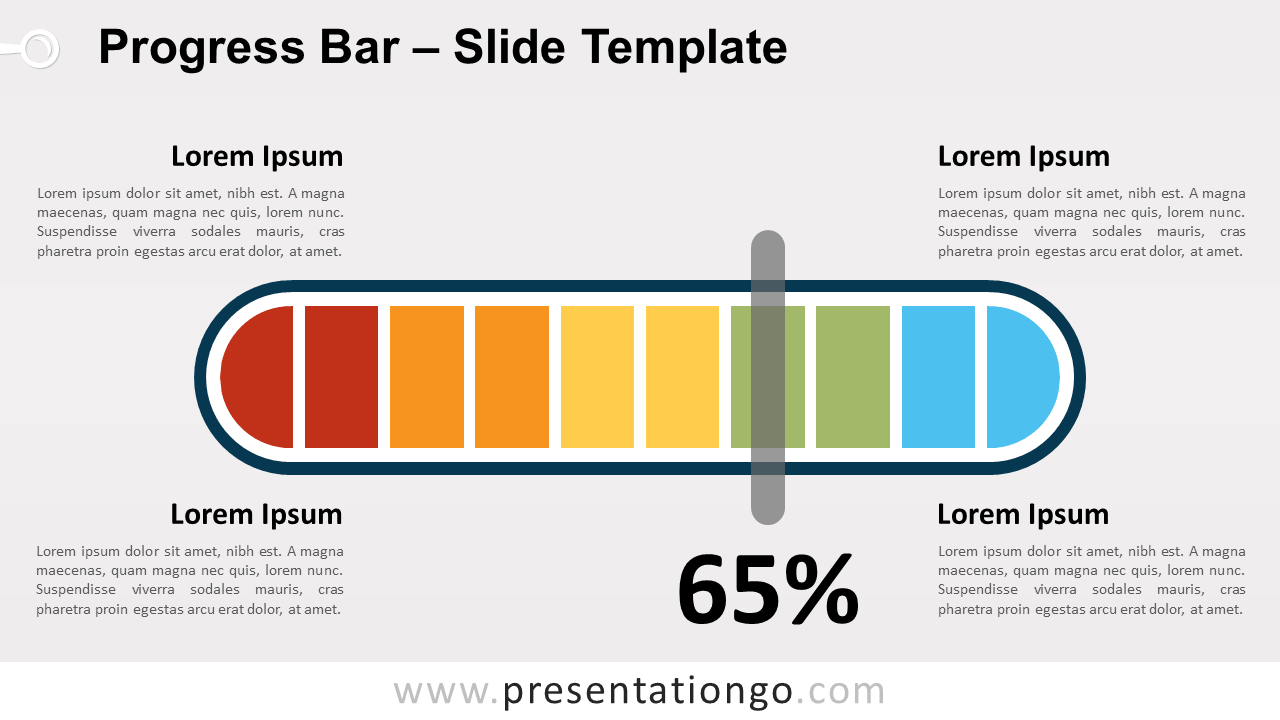
Free progress bar for PowerPoint and Google Slides. Pill-shape horizontal fraction chart. A nice alternative to simple data-driven bar charts.
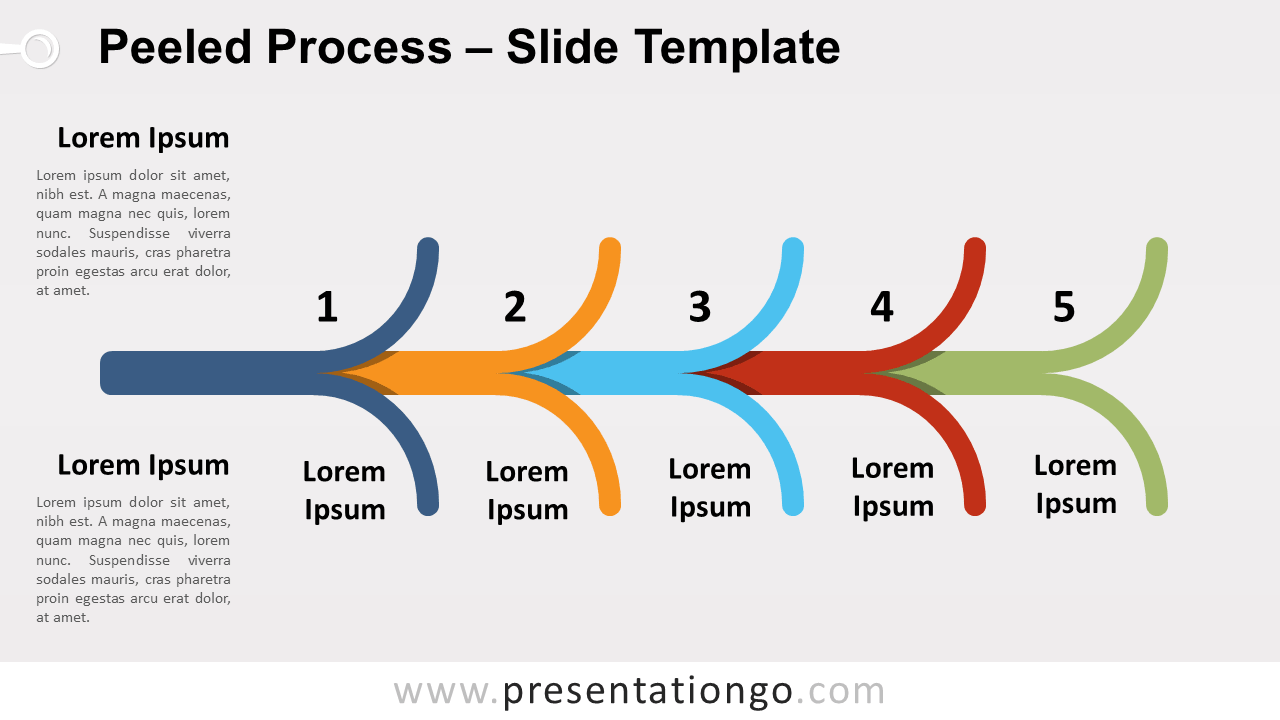
Free peeled process diagram for PowerPoint and Google Slides. 5-step horizontal process diagram designed with quarter-circle arcs. Editable graphics.
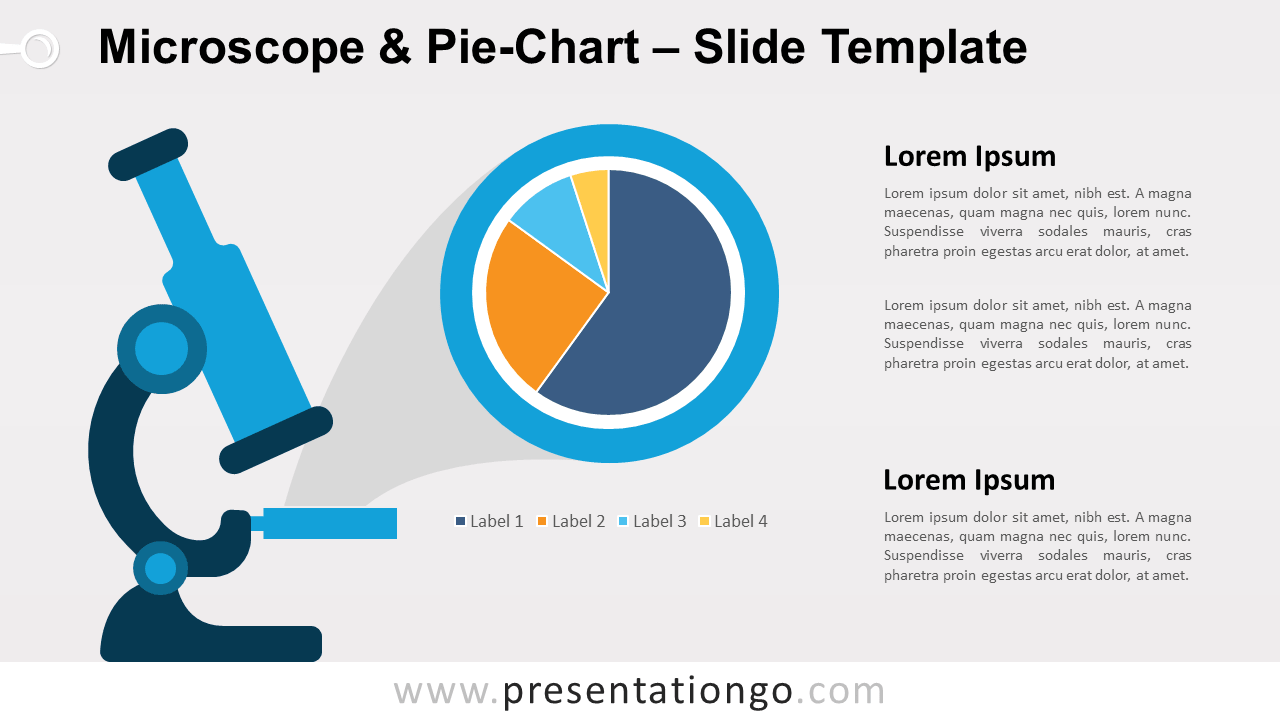
Free microscope and pie-chart for PowerPoint. Simple optical microscope and a magnified projection of a data-driven pie chart. Great to magnify your data.
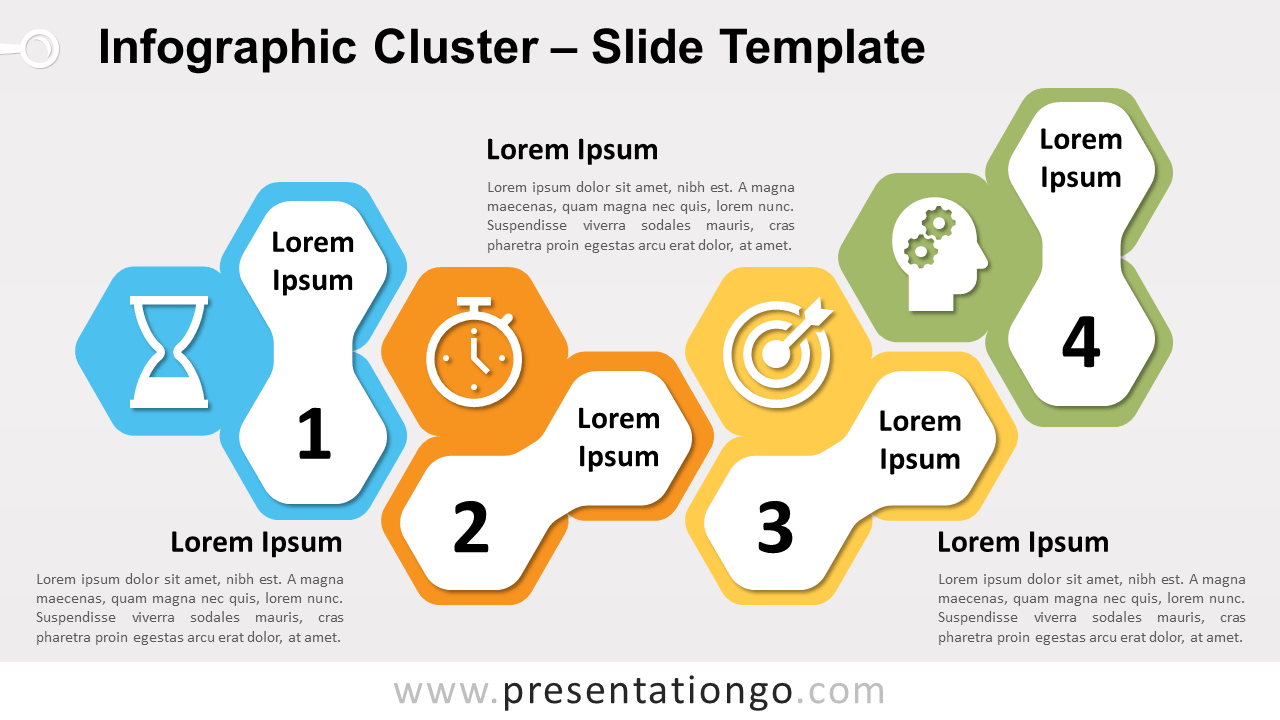
Free infographic cluster diagram for PowerPoint and Google Slides. Four elements designed with hexagons. Editable graphics with numbers, icons, and text.
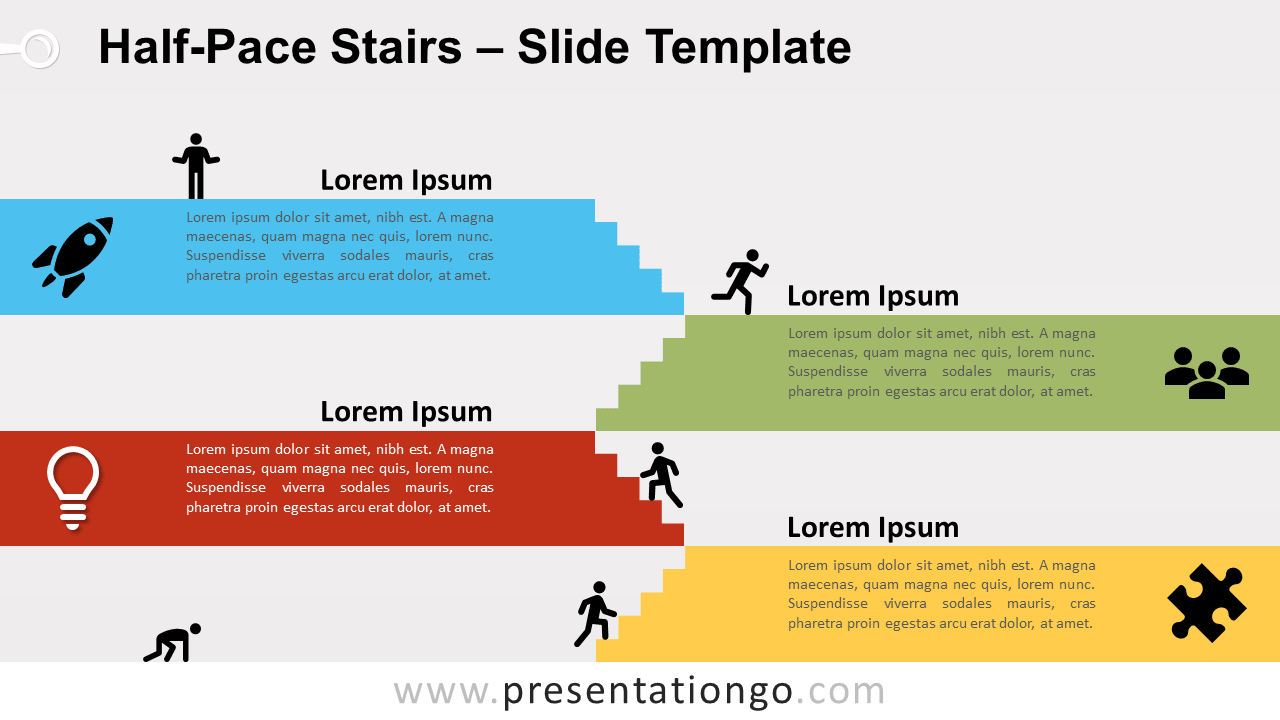
Free halfpace stairs diagram for PowerPoint and Google Slides. Multistory stairs with 4 horizontal platforms or levels and people icons. 100% editable.
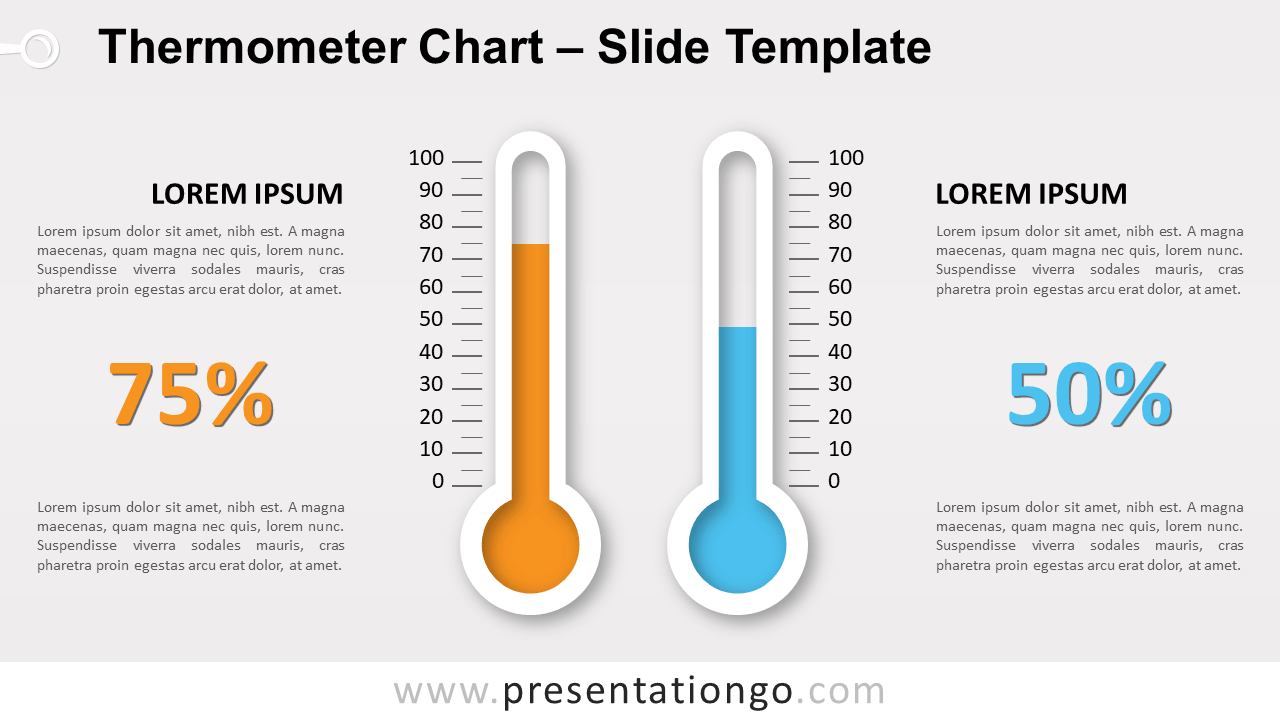
Free thermometer chart for PowerPoint and Google Slides. Medical mercury thermometer graphics with a data-driven column chart.
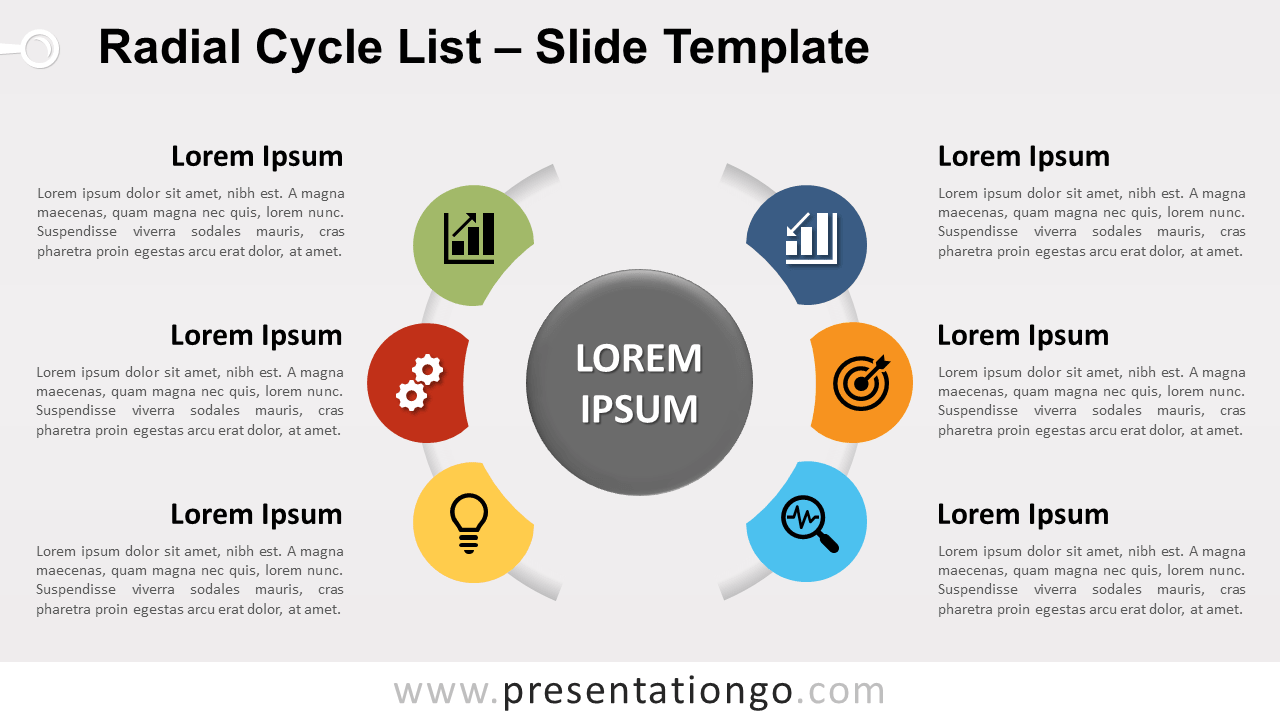
Free radial cycle list for PowerPoint and Google Slides. Two arcs with 3 circular elements around a circle shape. Editable graphics with text placeholders.
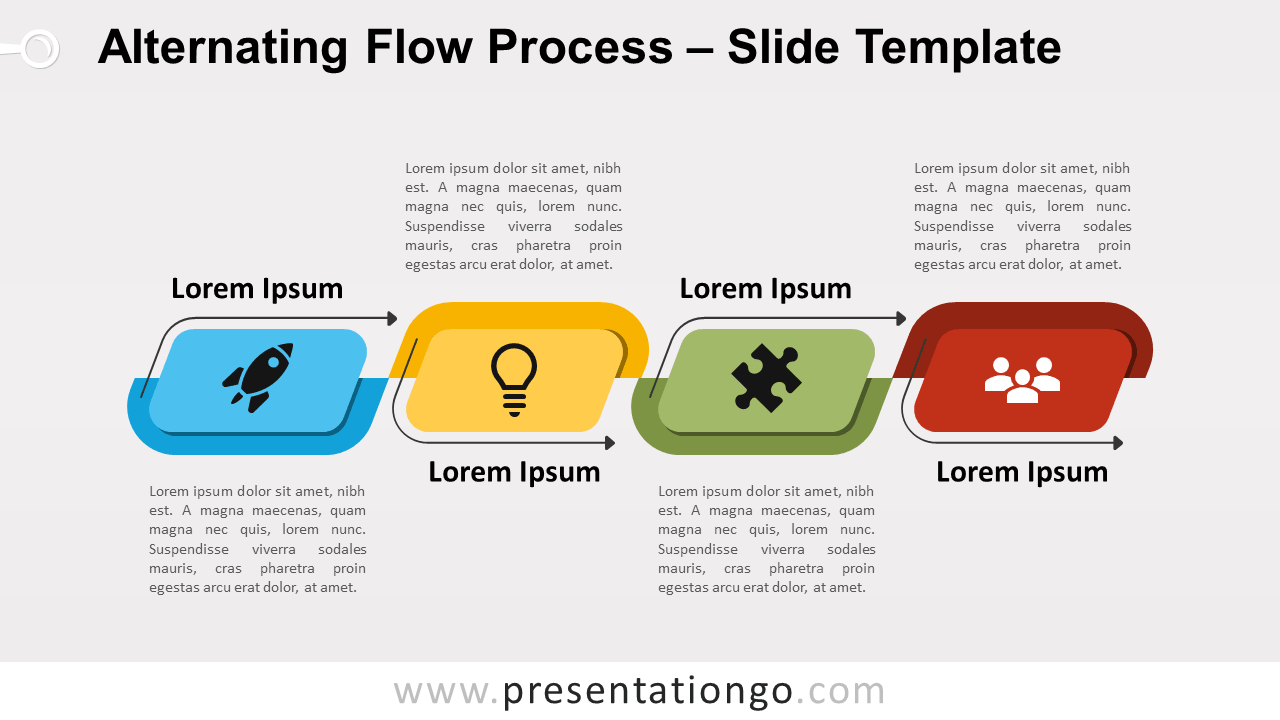
Free alternating flow process diagram for PowerPoint and Google Slides. 4-step up-and-down horizontal infographic process diagram with curved arrows.
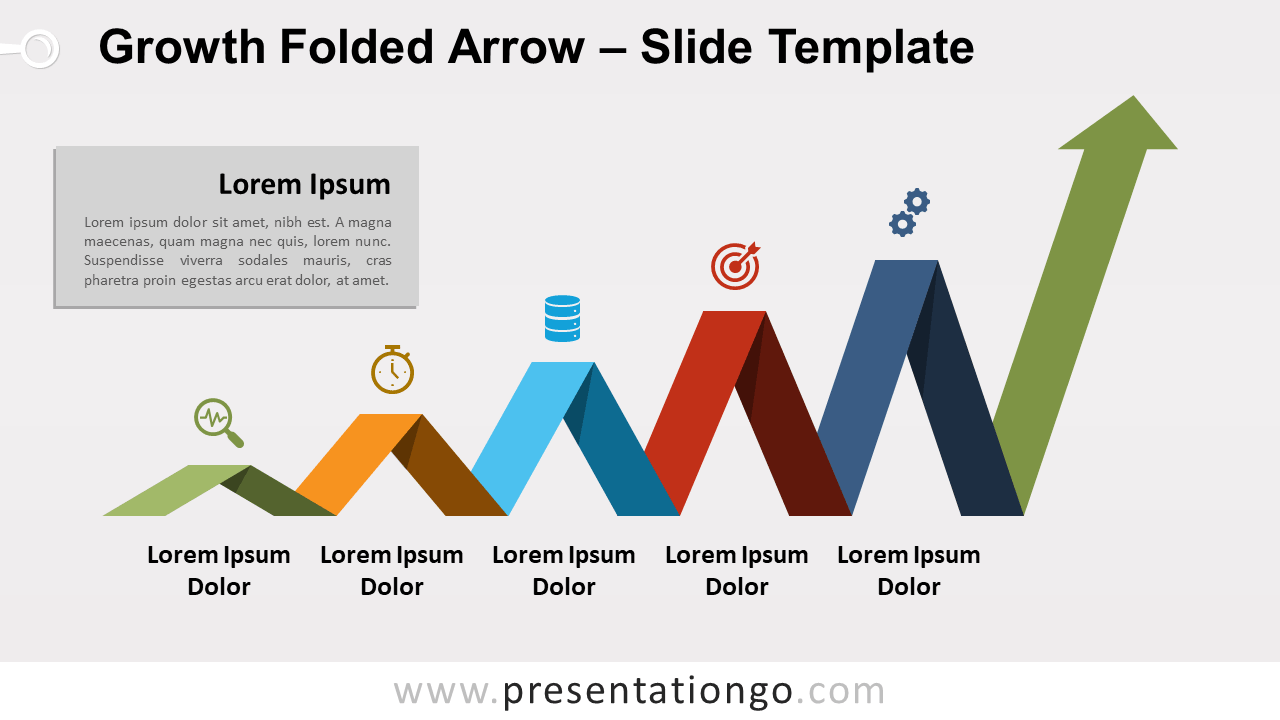
Free growth folded arrow for PowerPoint and Google Slides. 5-step increasing arrow with a folding paper effect. Perfect for business or finance slides.
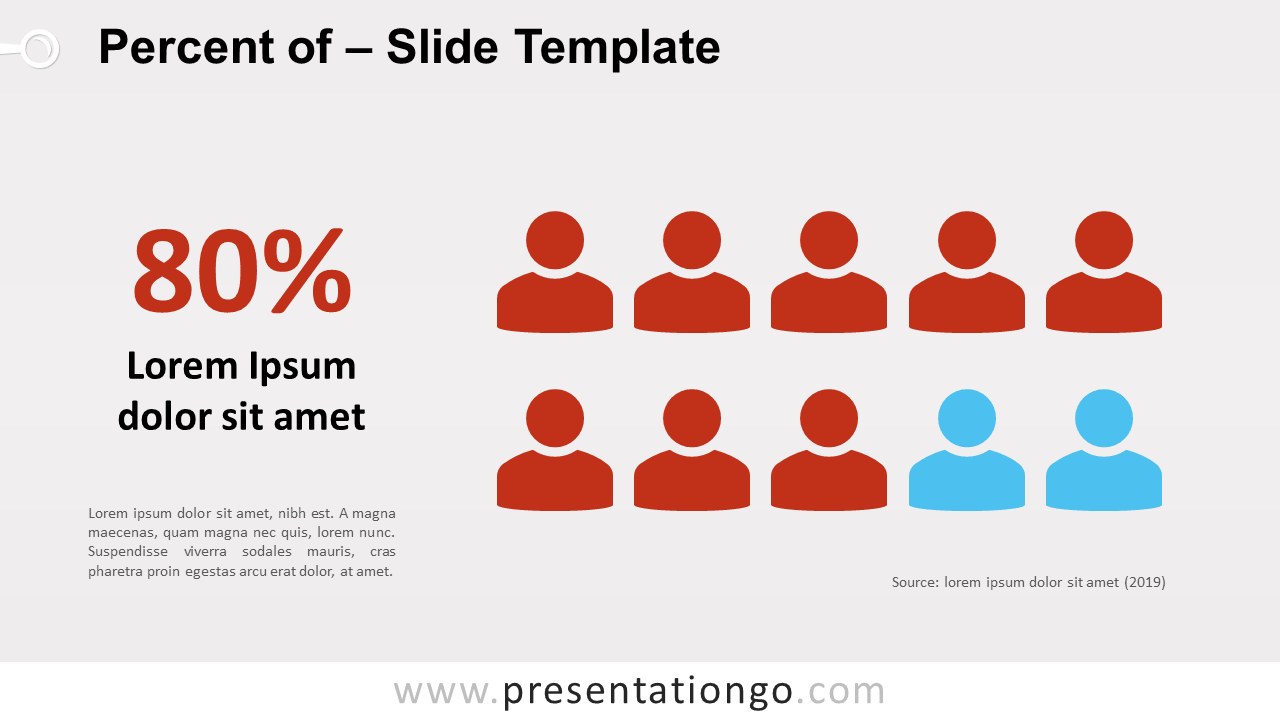
Free template for PowerPoint and Google Slides to show information about a percentage. Infographic slide template with 10 silhouette pictograms.
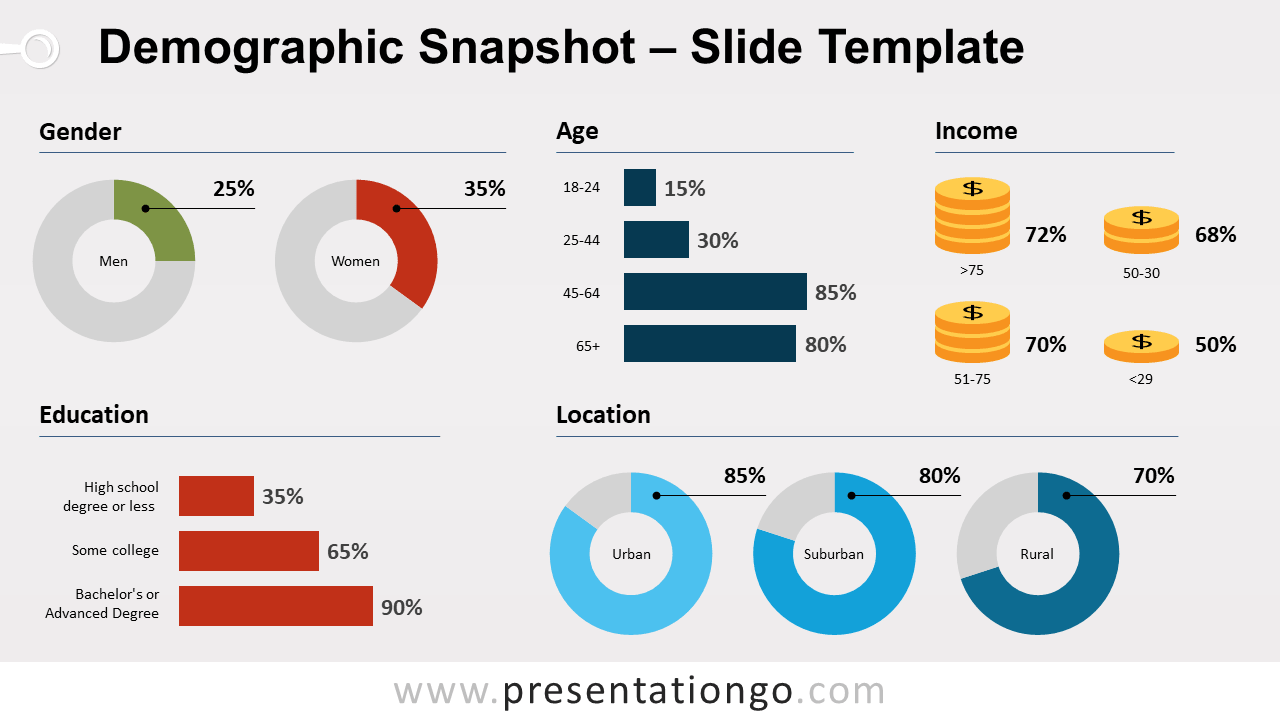
Free demographic infographic chart for PowerPoint. 1-slide snapshot template to visualize your demographic data. Editable graphics and data-driven charts.