Loading resources…
Total 1760 resources
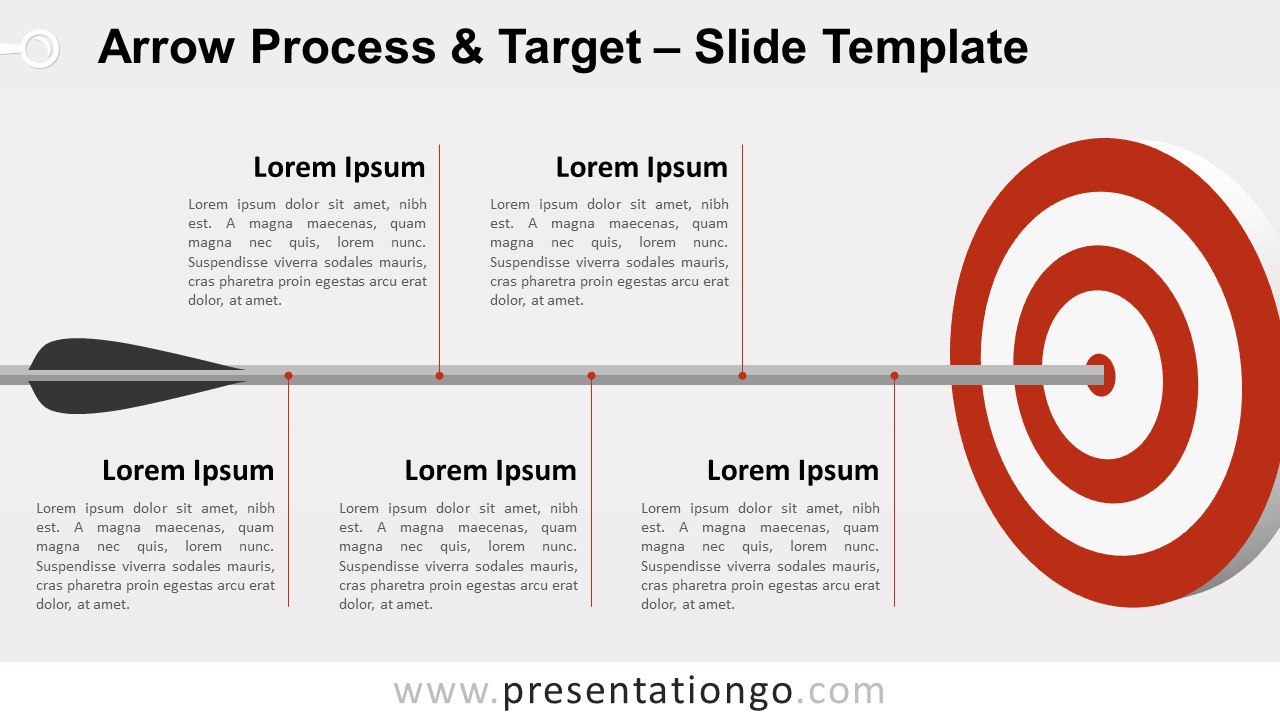
Free arrow process and target template for PowerPoint and Google Slides. Horizontal arrow hitting the bullseye. Editable graphics with text placeholders.
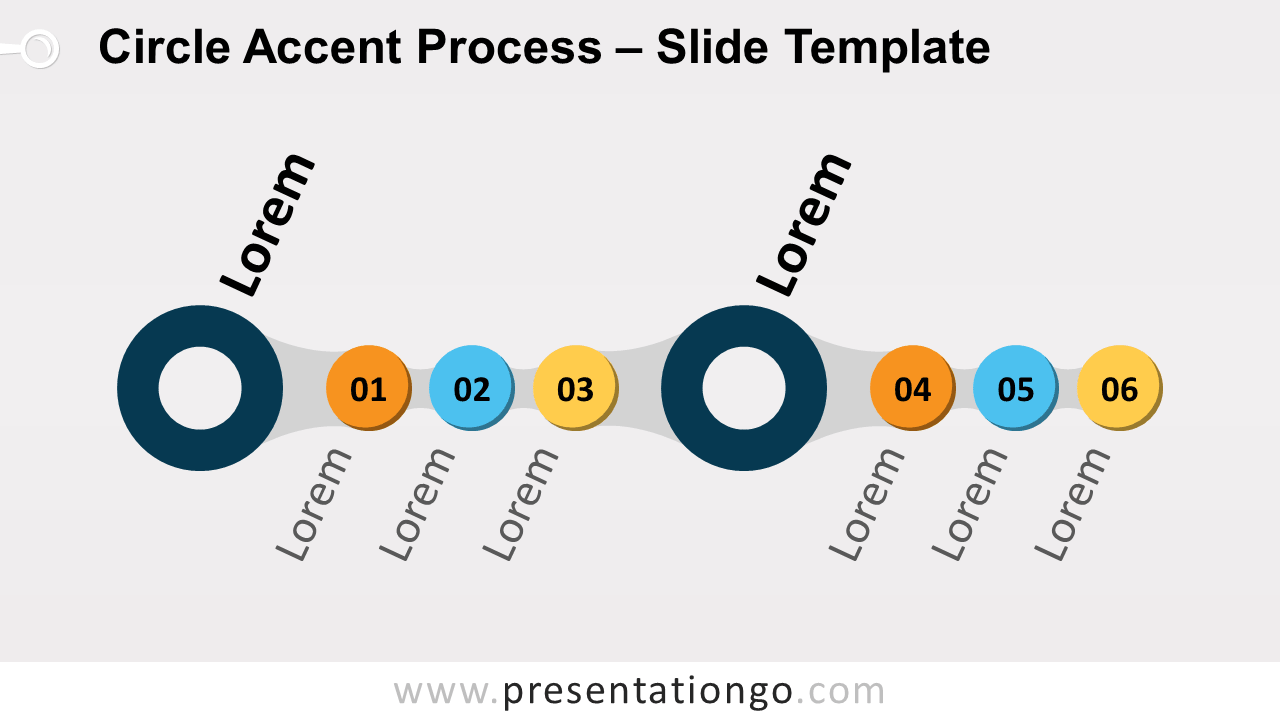
Free circle accent process for PowerPoint and Google Slides. Process diagram with larger rings (first levels) and smaller circle shapes (sub-levels).
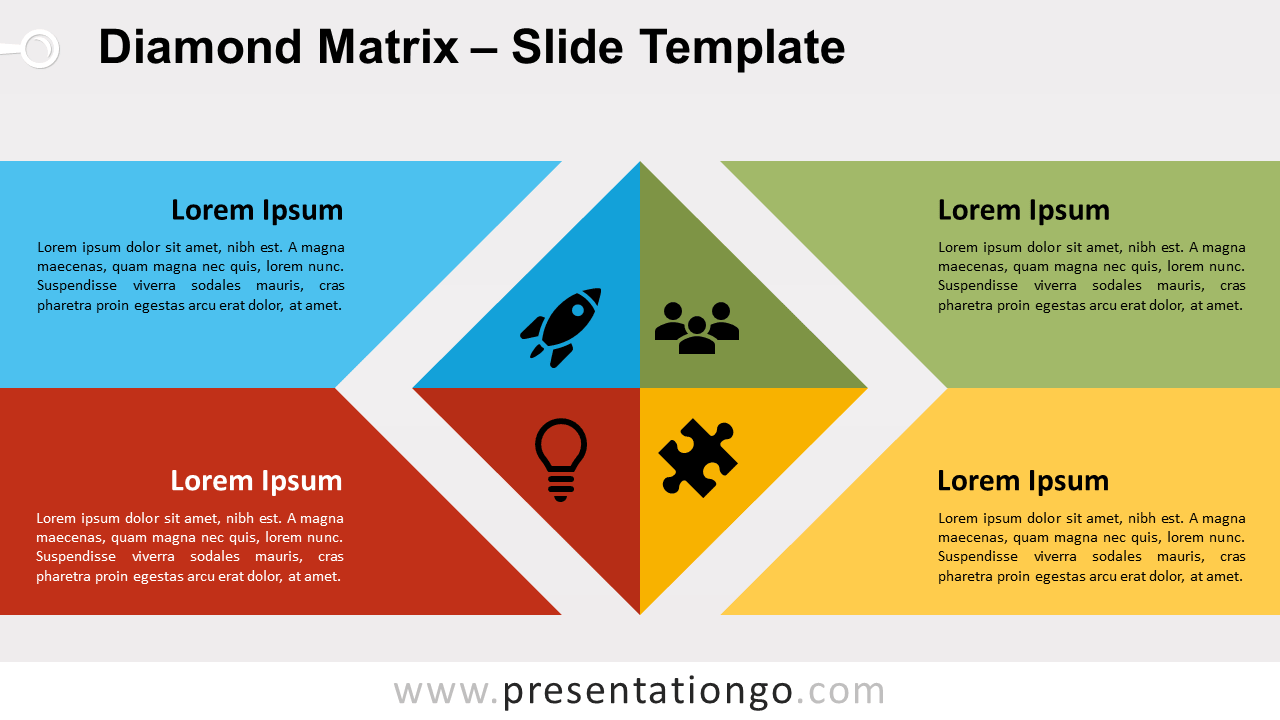
Free diamond matrix template for PowerPoint and Google Slides. Four-quadrant rotated square matrix diagram and banners. Editable graphics. 2 slides.
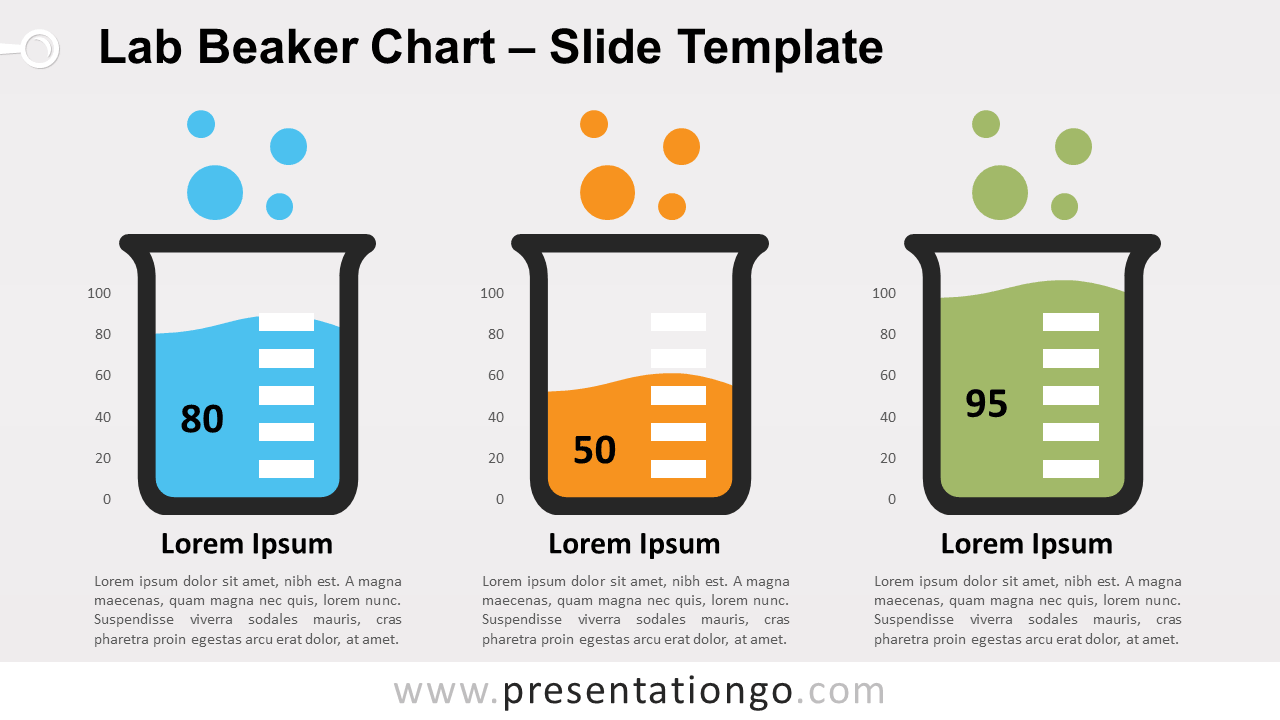
Free lab beaker chart for PowerPoint and Google Slides. 3 laboratory graduated beaker graphics with a 0-100 scale. Data-driven chart for PPTX.
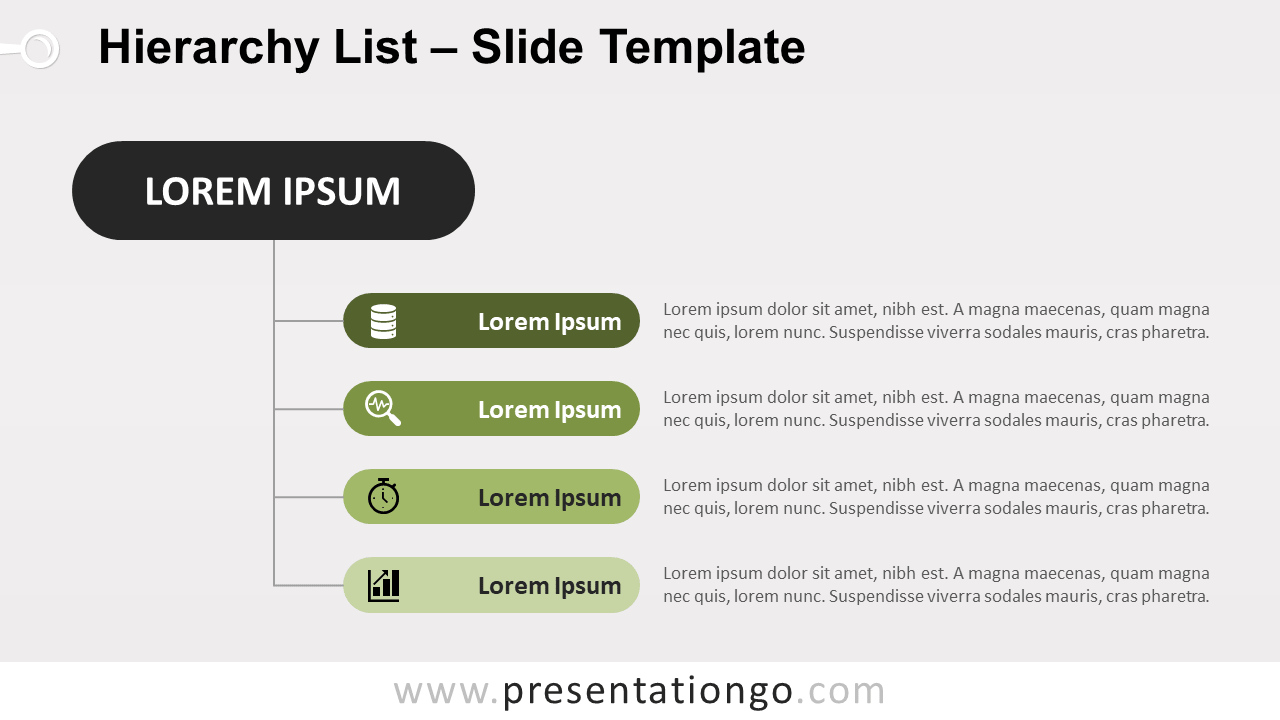
Free vertical hierarchy for PowerPoint and Google Slides. 1-level hierarchy list diagram with vertically displayed rounded rectangles. Editable graphics.
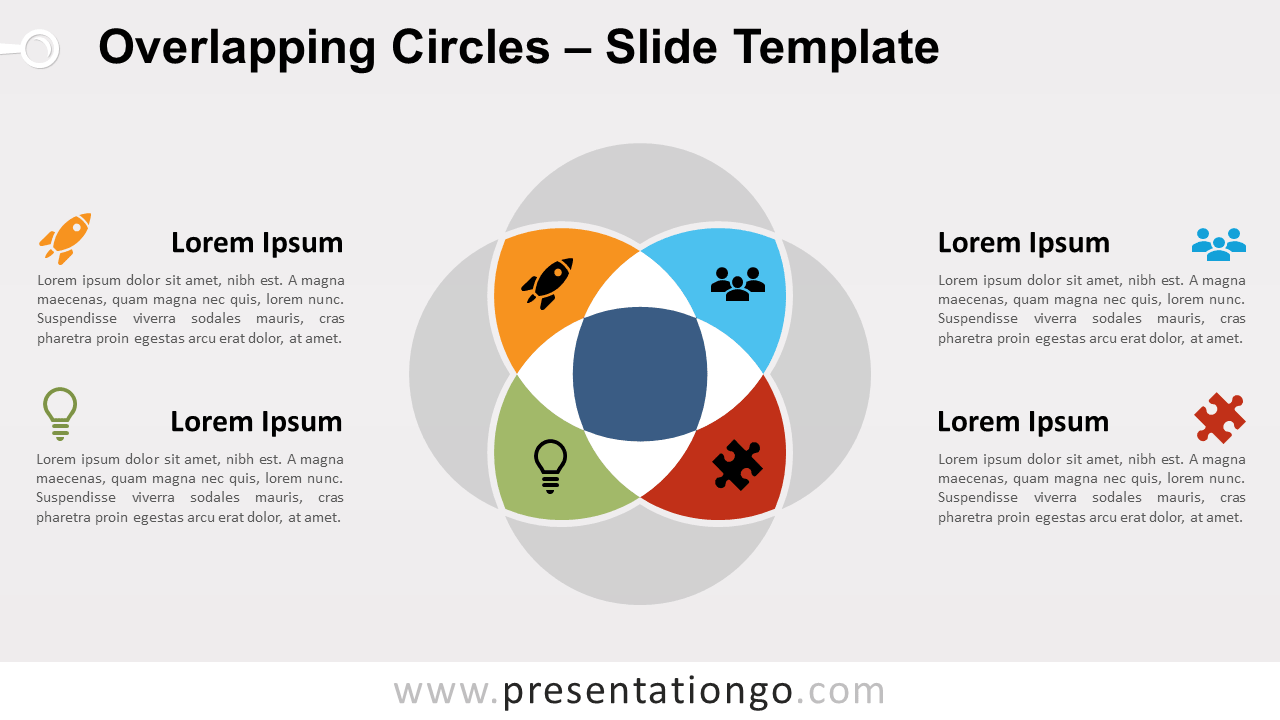
Free infographic template with overlapping circles for PowerPoint and Google Slides. Venn diagram design with 4 fragmented circle shapes. Editable graphics.
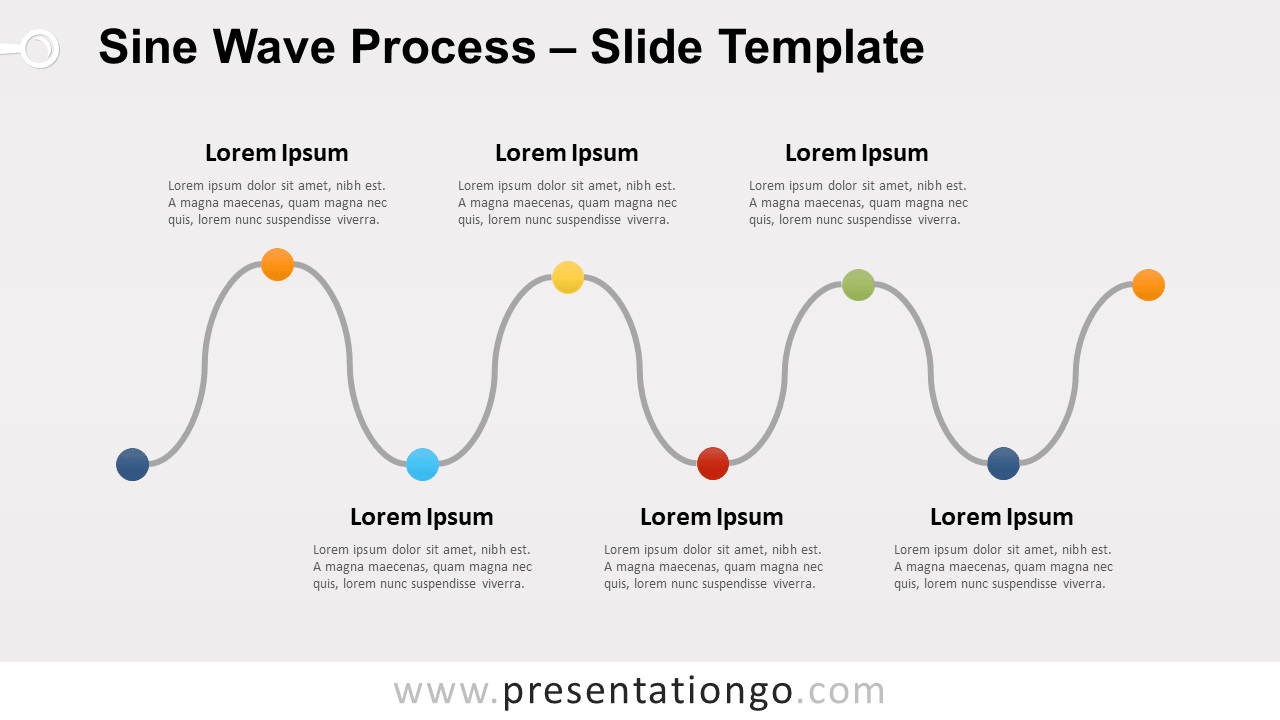
Free sine wave process diagram for PowerPoint and Google Slides. Horizontal sinusoid process diagram designed with curved lane connectors.
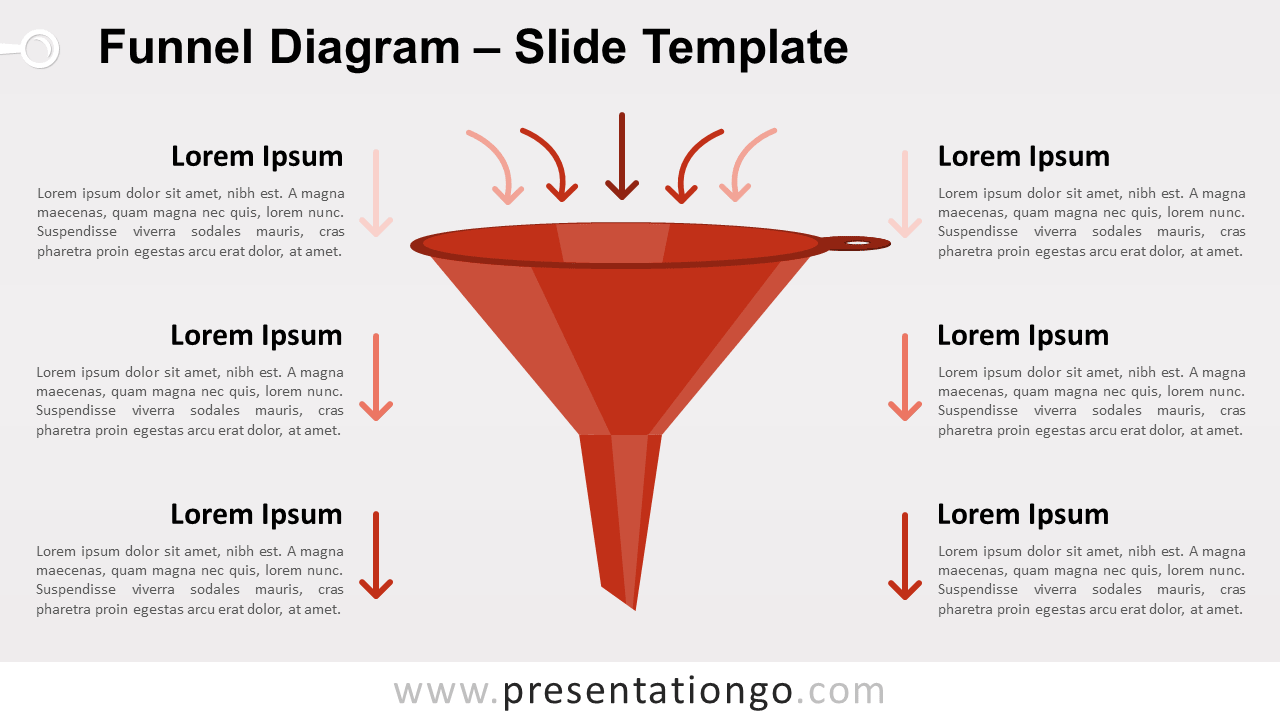
Free funnel diagram for PowerPoint and Google Slides. Double-walled blue funnel with down arrows. Editable graphics with text placeholders. 2 slides.
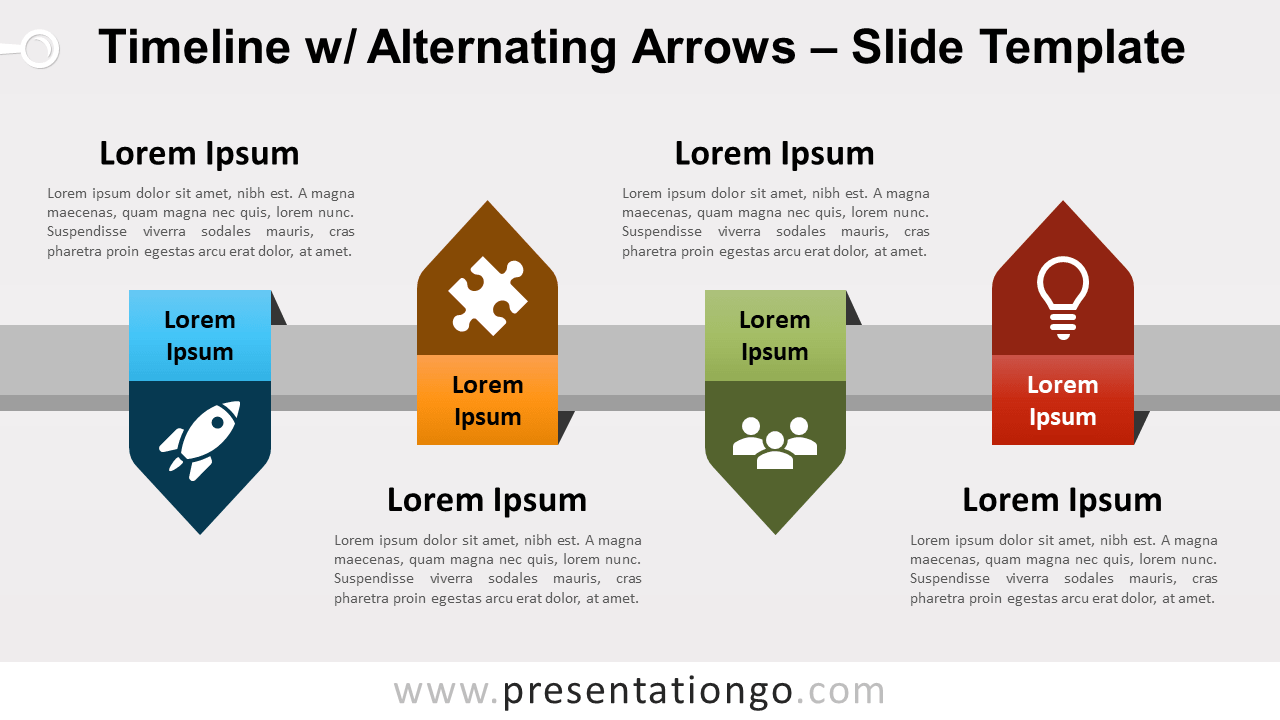
Free timeline with alternating arrows for PowerPoint and Google Slides. 4-step horizontal process diagram with alternating up and down ribbon arrows.
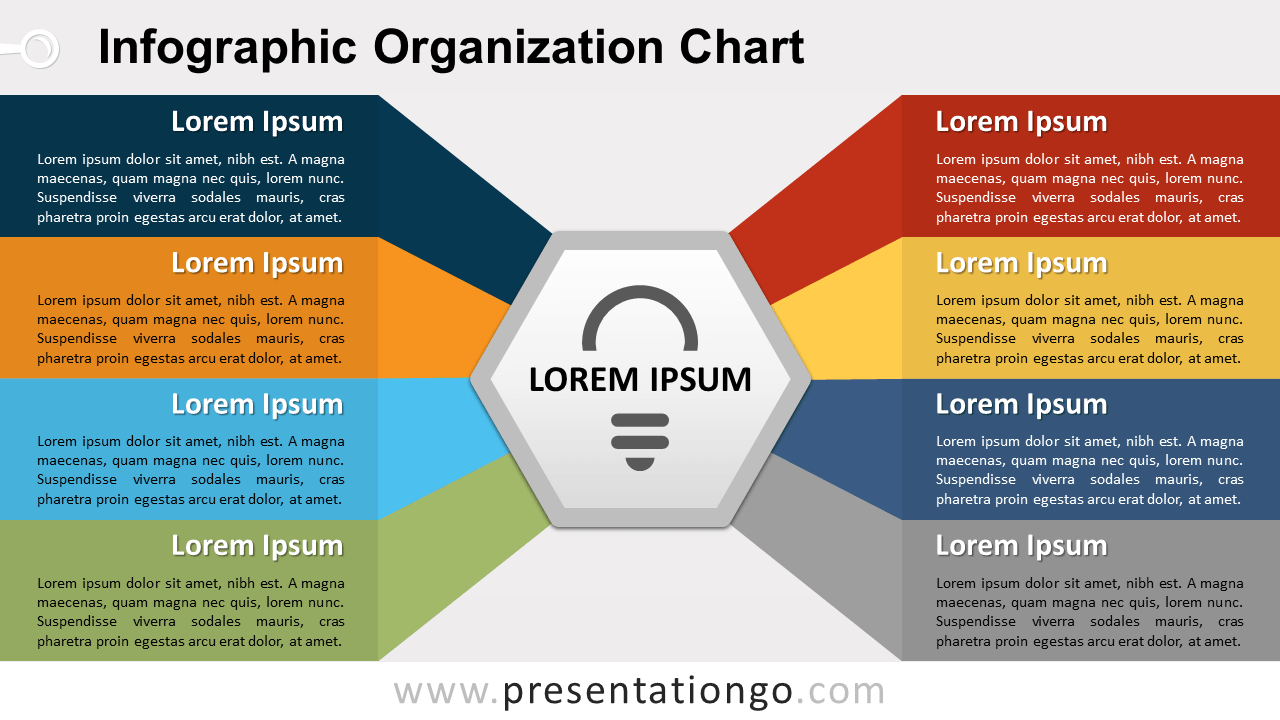
Free infographic organization chart for PowerPoint and Google Slides. Organizational diagram showing the relation of 8 banners to a central element.
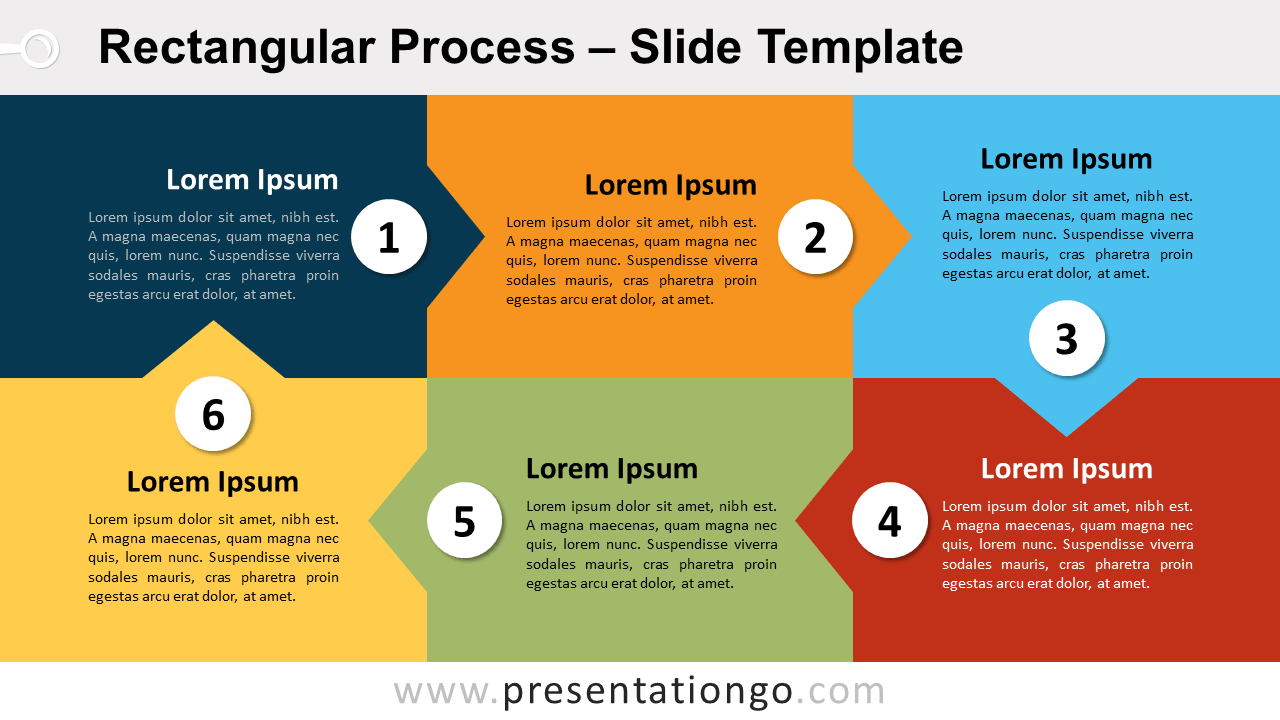
Free rectangular process for PowerPoint and Google Slides. Infographic diagram with 6 colorful blocks put together and arrows. Editable graphics.
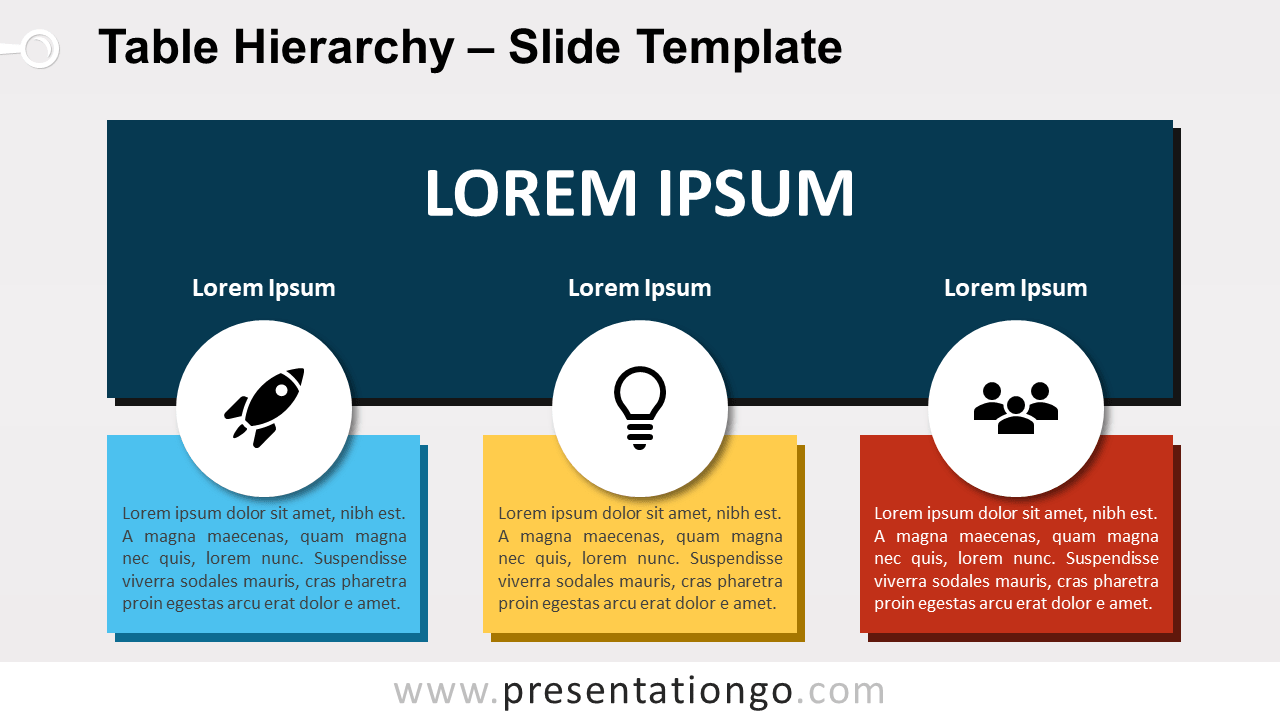
Free table hierarchy for PowerPoint and Google Slides. Tree-like structure diagram with 1 main element and 3 child tables. Editable graphics.
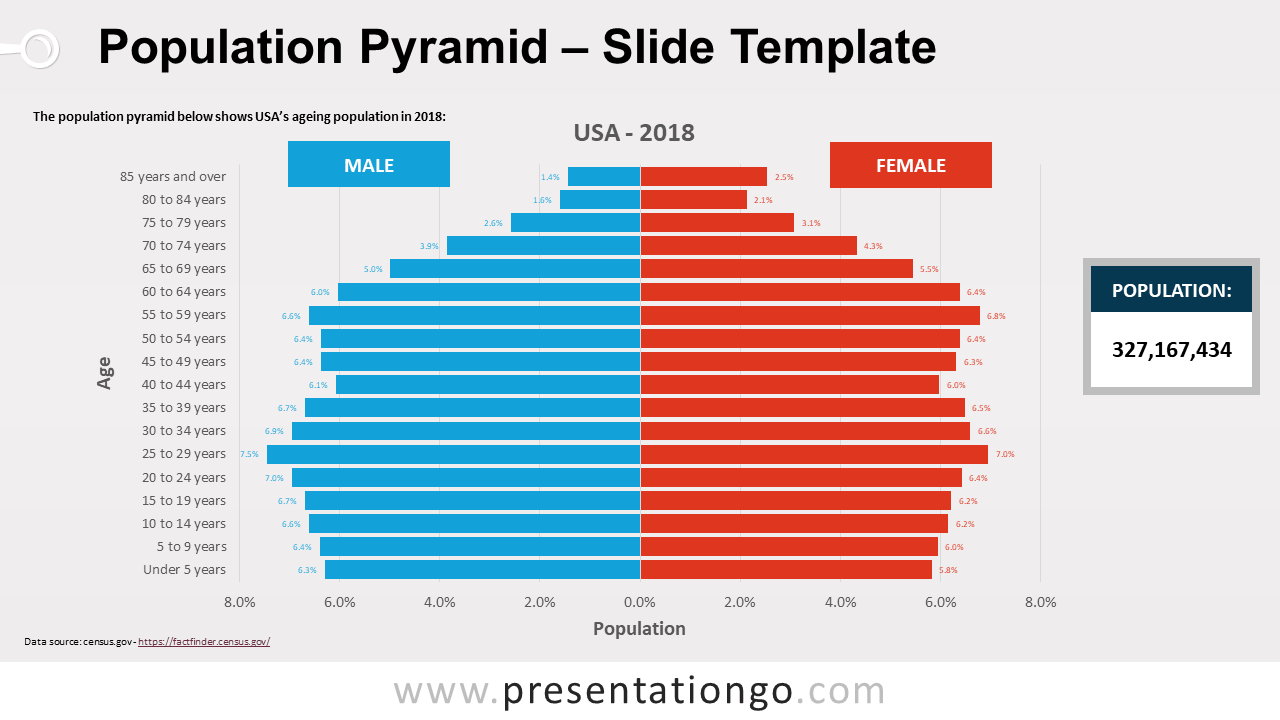
Free pyramid population template for PowerPoint. Data-driven bar chart to show the distribution of various age groups in a population. Editable graphics.
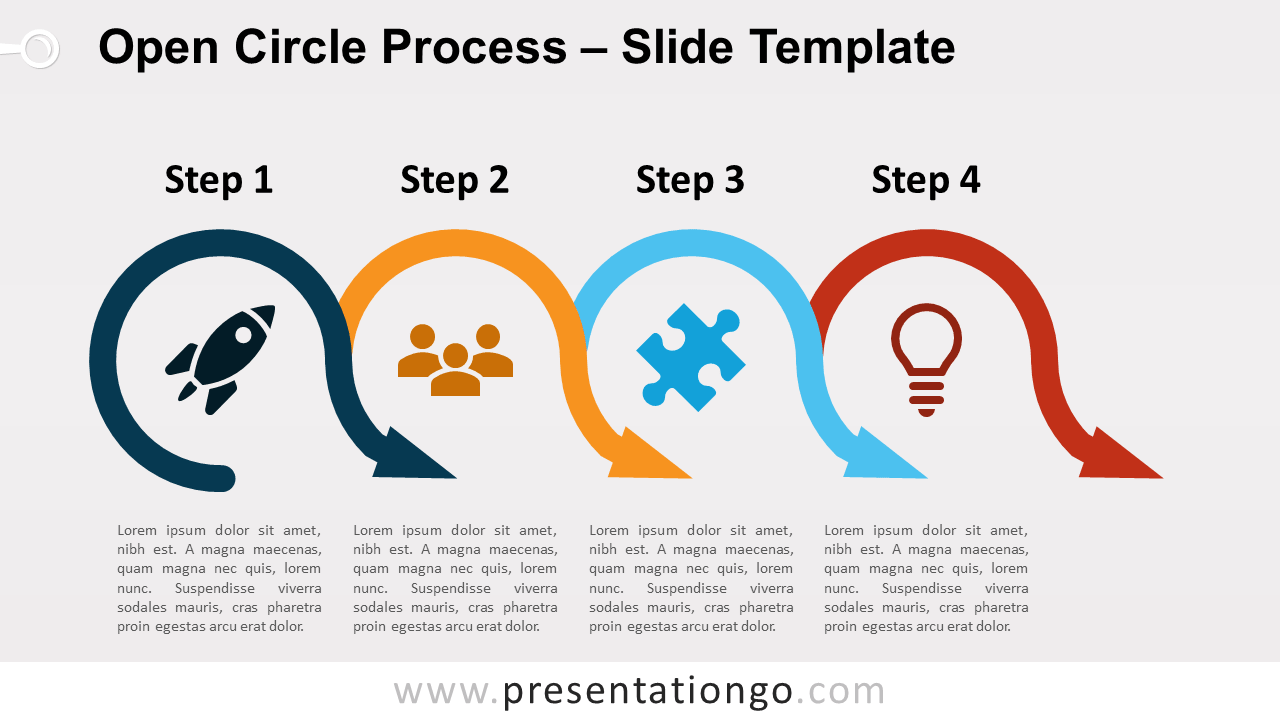
Free open circle process for PowerPoint and Google Slides. 4-step horizontal process diagram using incomplete circles with waving effect end arrows.
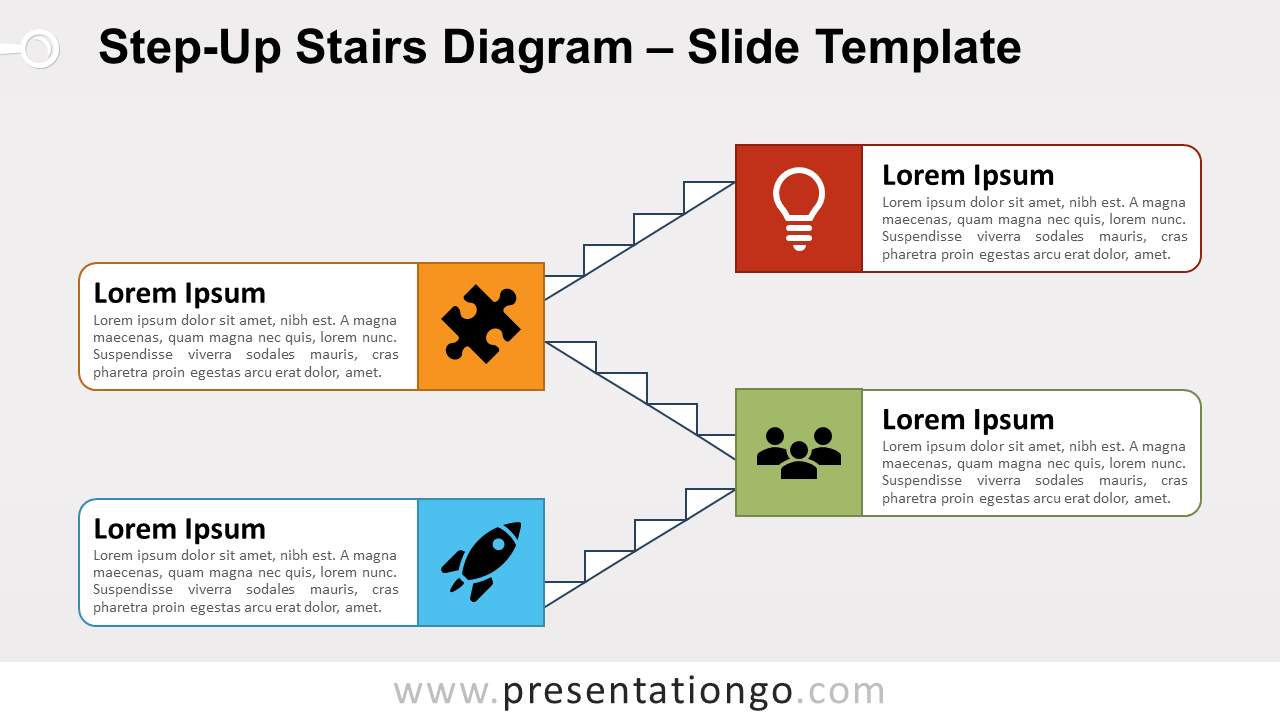
Free step-up stairs diagram for PowerPoint and Google Slides. Staircase with 4 flights of straight stairs and 4 floors. Editable graphics. 2 slides.
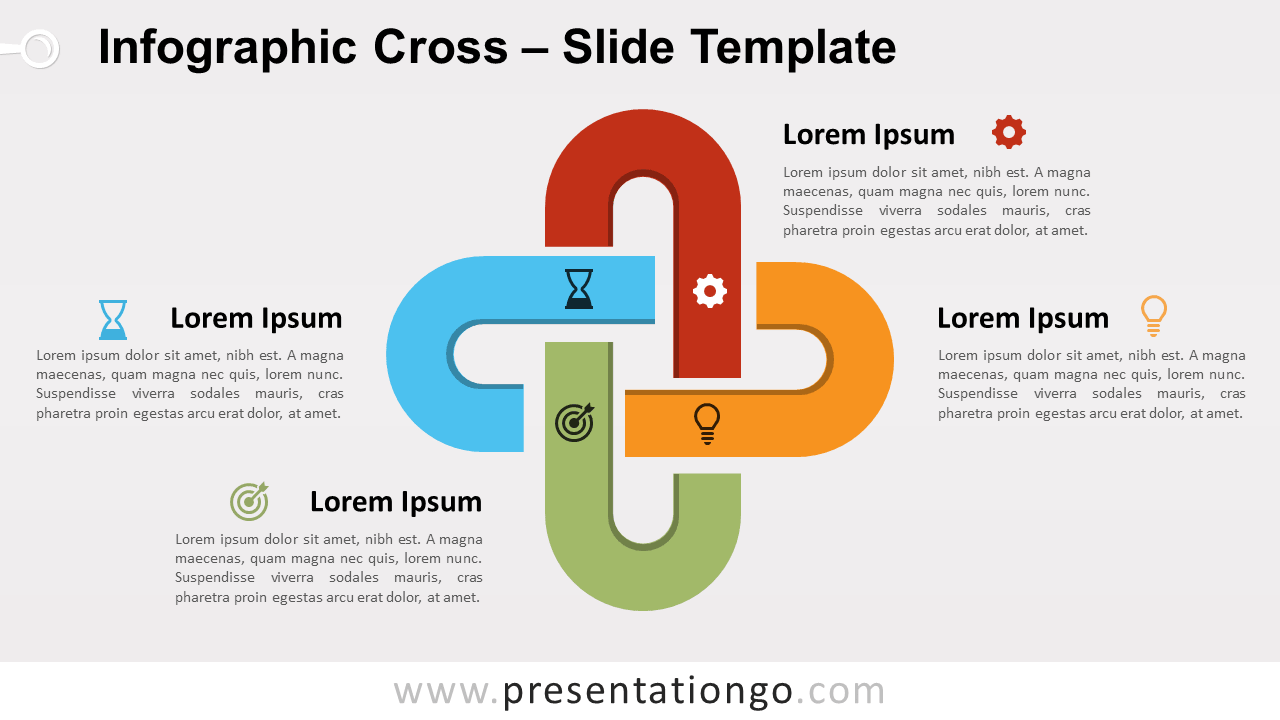
Free infographic cross for PowerPoint and Google Slides. Diagram of a cross designed with 4 colorful cane-shaped heads. Editable graphics.
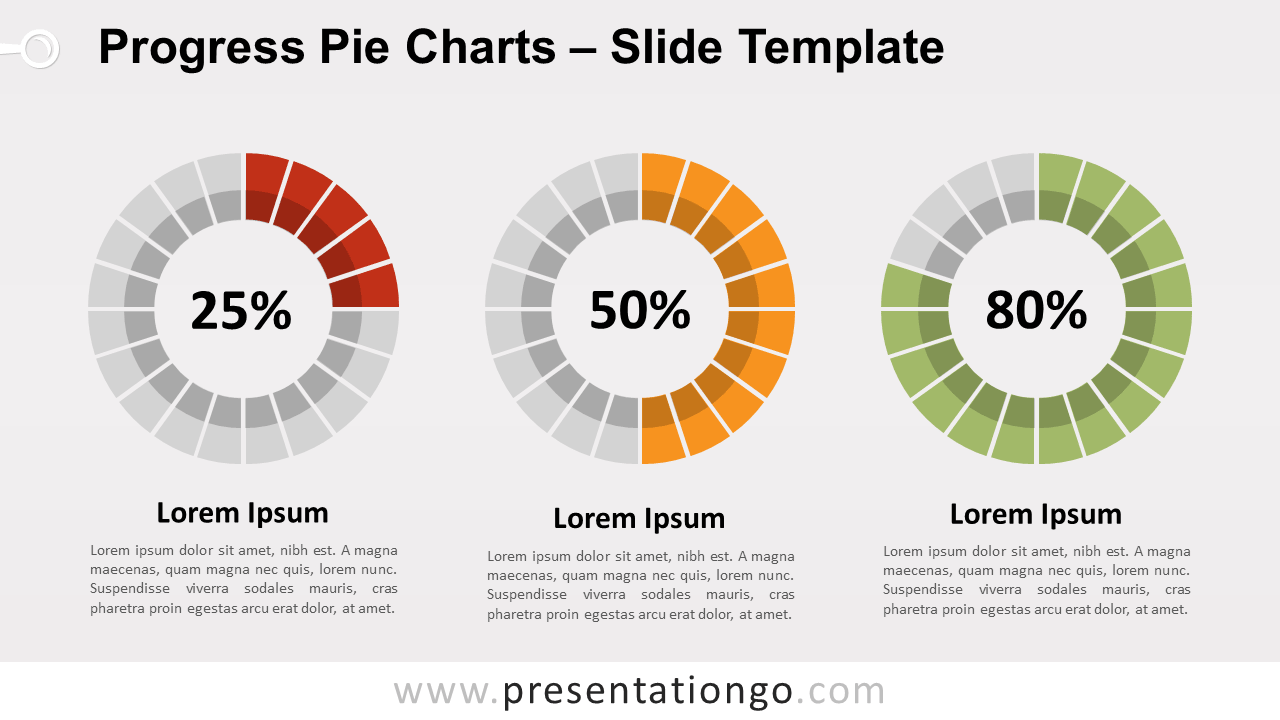
Free progress pie charts for PowerPoint and Google Slides. Donut pie chart with 20 editable slices. Non-data-driven chart alternative. Editable graphics.
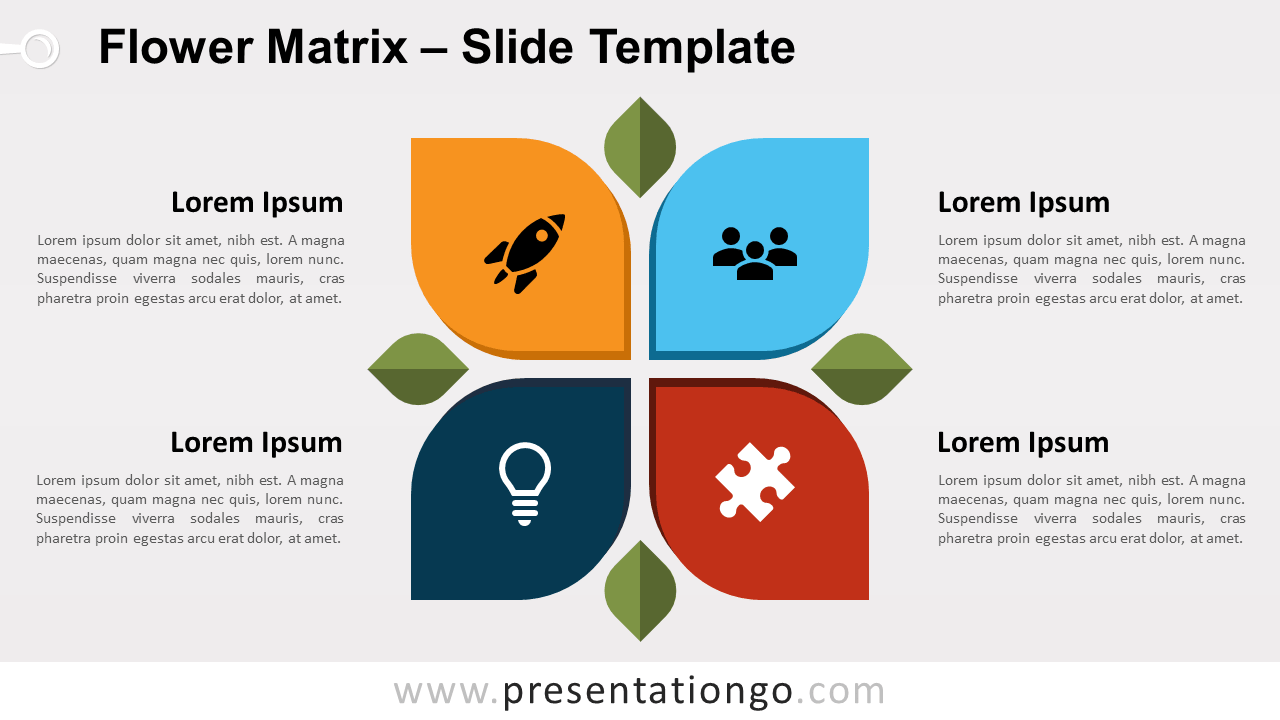
Free flower matrix for PowerPoint and Google Slides. Colorful matrix, with 4 parts or petals (2x2 cells) and icons. Editable graphics.
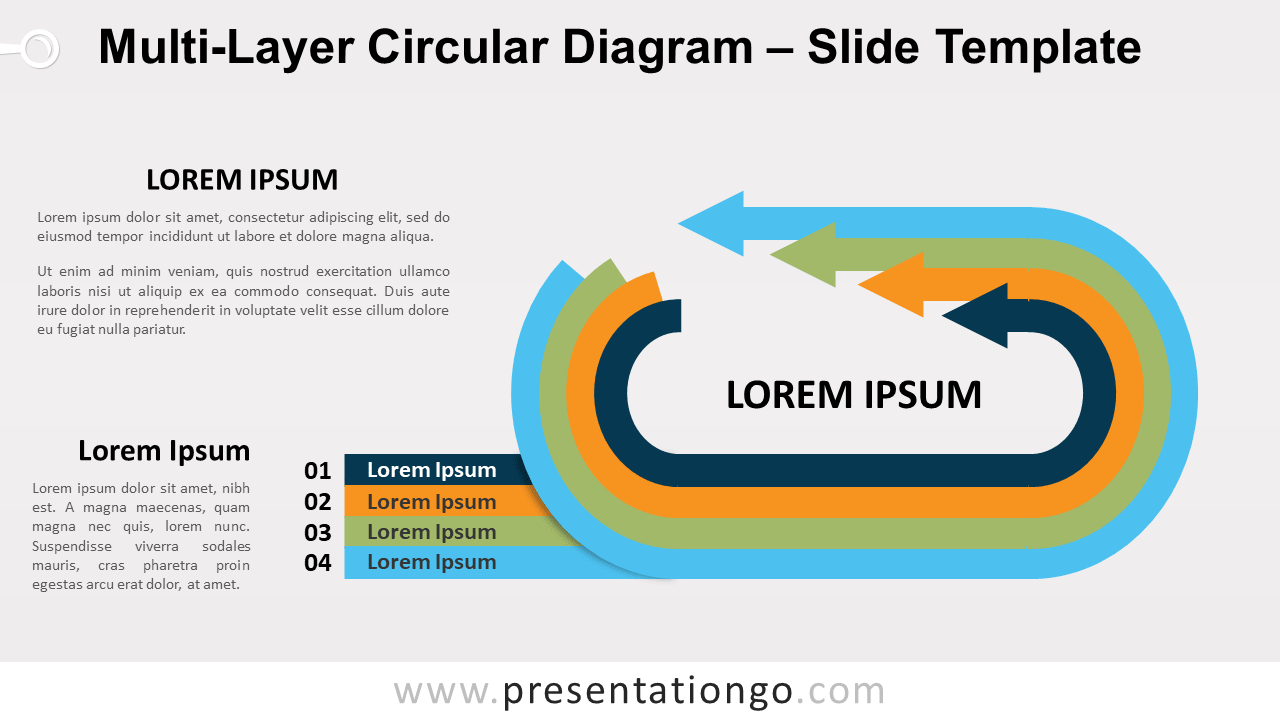
Free multi-layer circular diagram for PowerPoint and Google Slides. Running track shape with 4 circular layers or lanes, start line, and arrows.
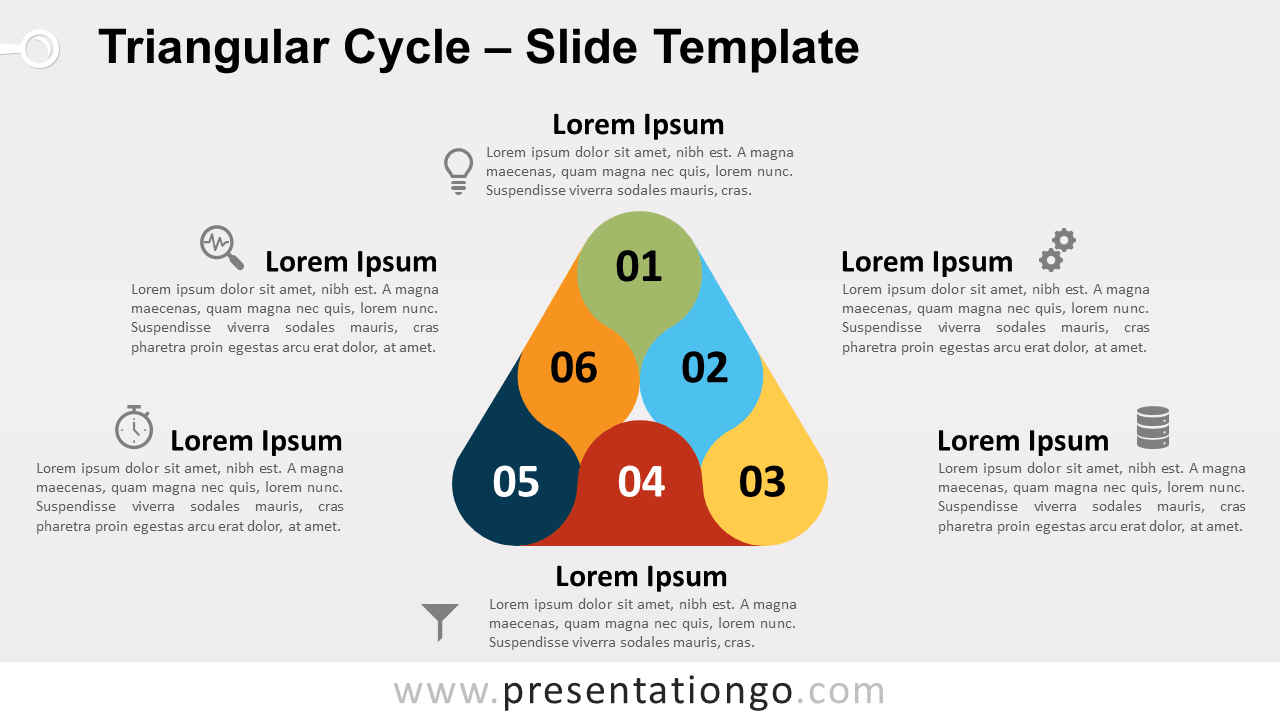
Free triangular cycle for PowerPoint and Google Slides. Infographic triangle with rounded corners and 6 parts. 6 editable steps in a circular flow.
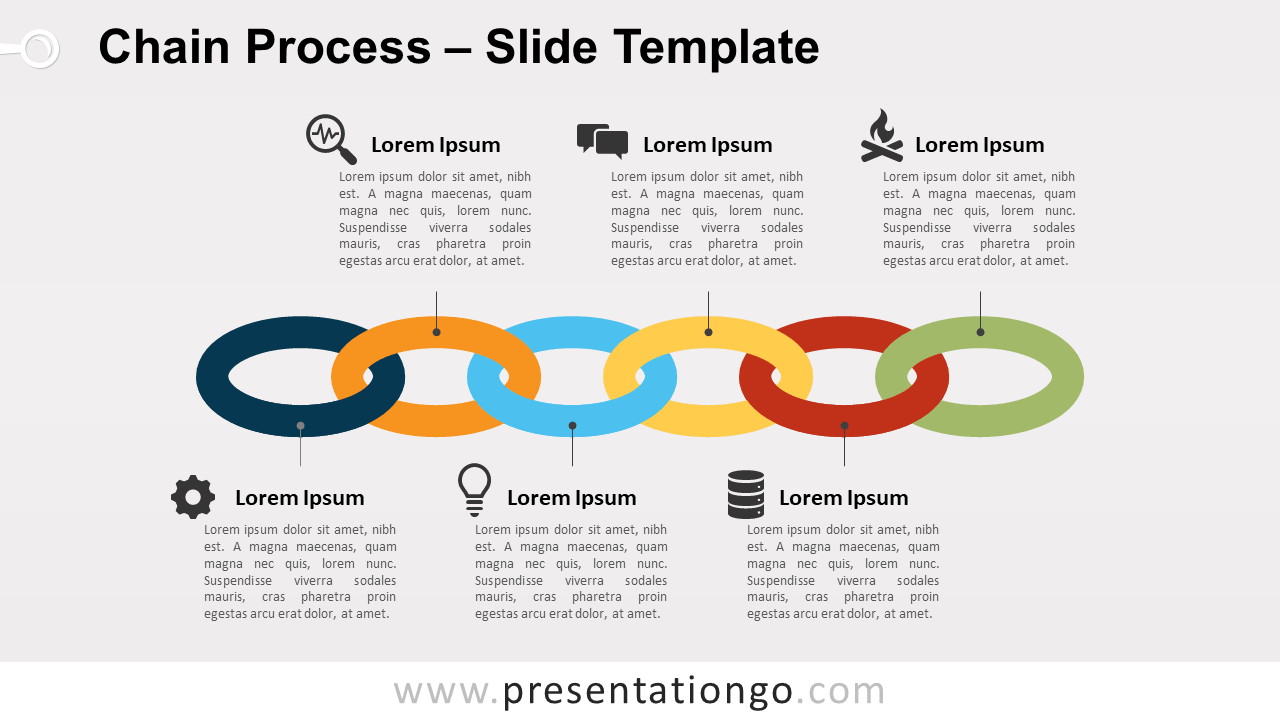
Free chain process for PowerPoint and Google Slides. 6-step horizontal process diagram designed with connected colorful chain-link shapes.
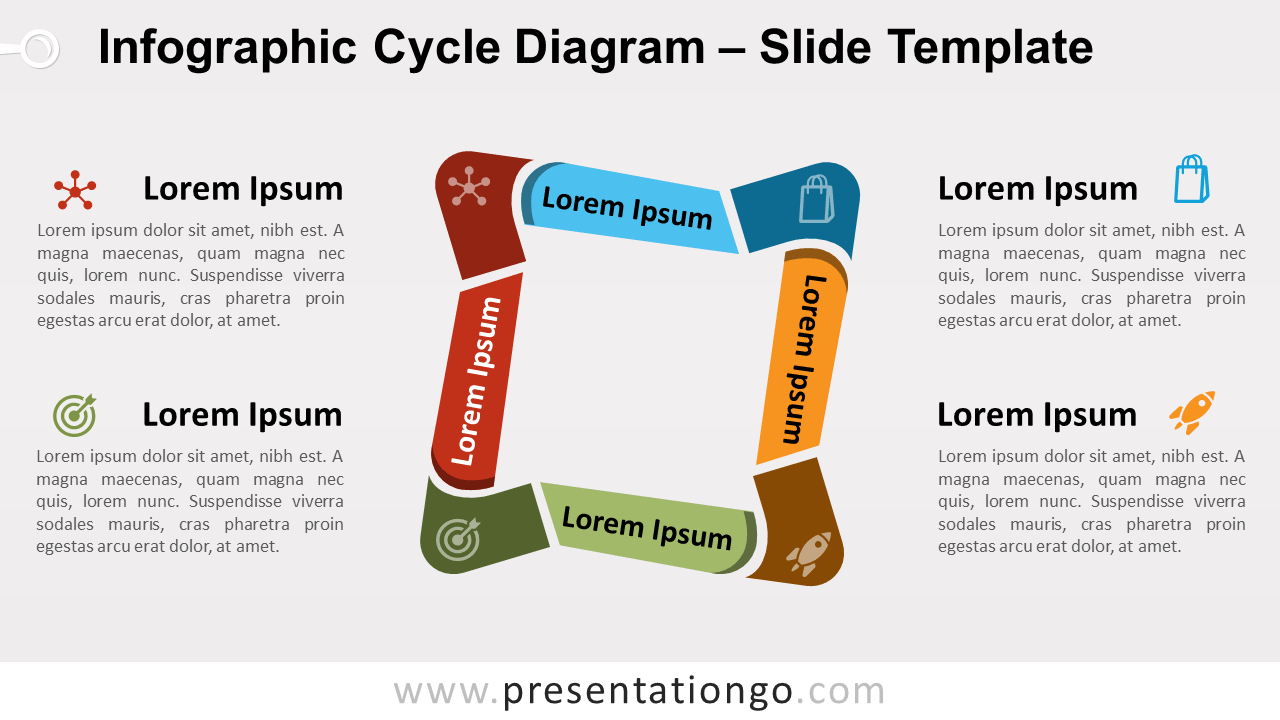
Free infographic cycle diagram for PowerPoint and Google Slides. Horizontal folded banners connected to 8 donut pie chart slices.
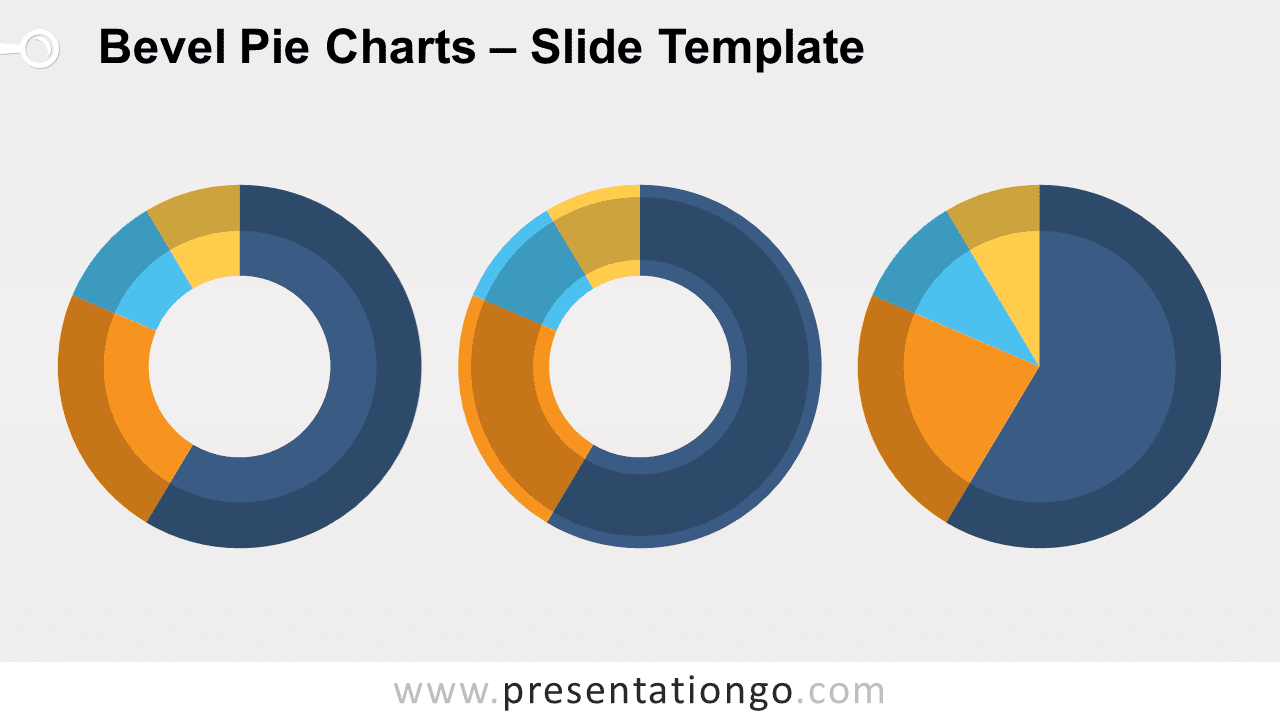
Free pie-charts template with a bevel effect for PowerPoint. Simple, yet beautiful effect for your pie and donut charts. Great for your infographics.
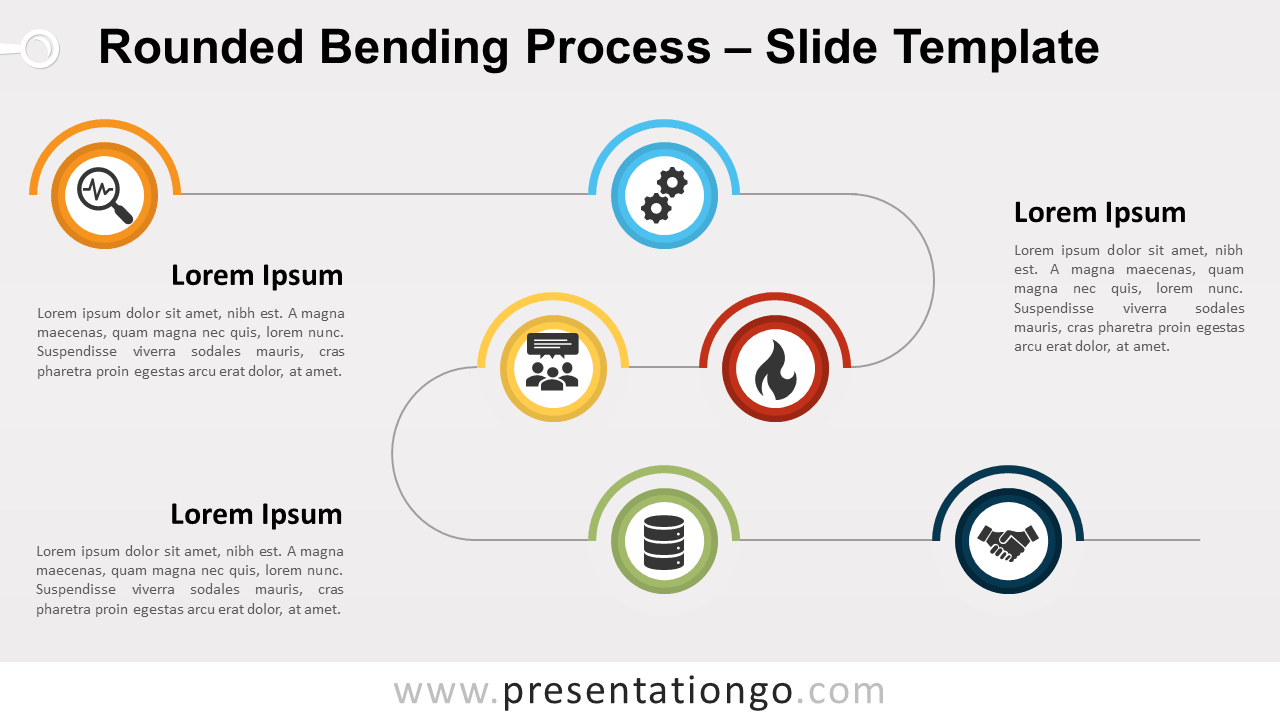
Free rounded bending process for PowerPoint and Google Slides. Linear bent process diagram designed with a winding line, dispersed circle shapes with icons.