Loading resources…
Total 1760 resources
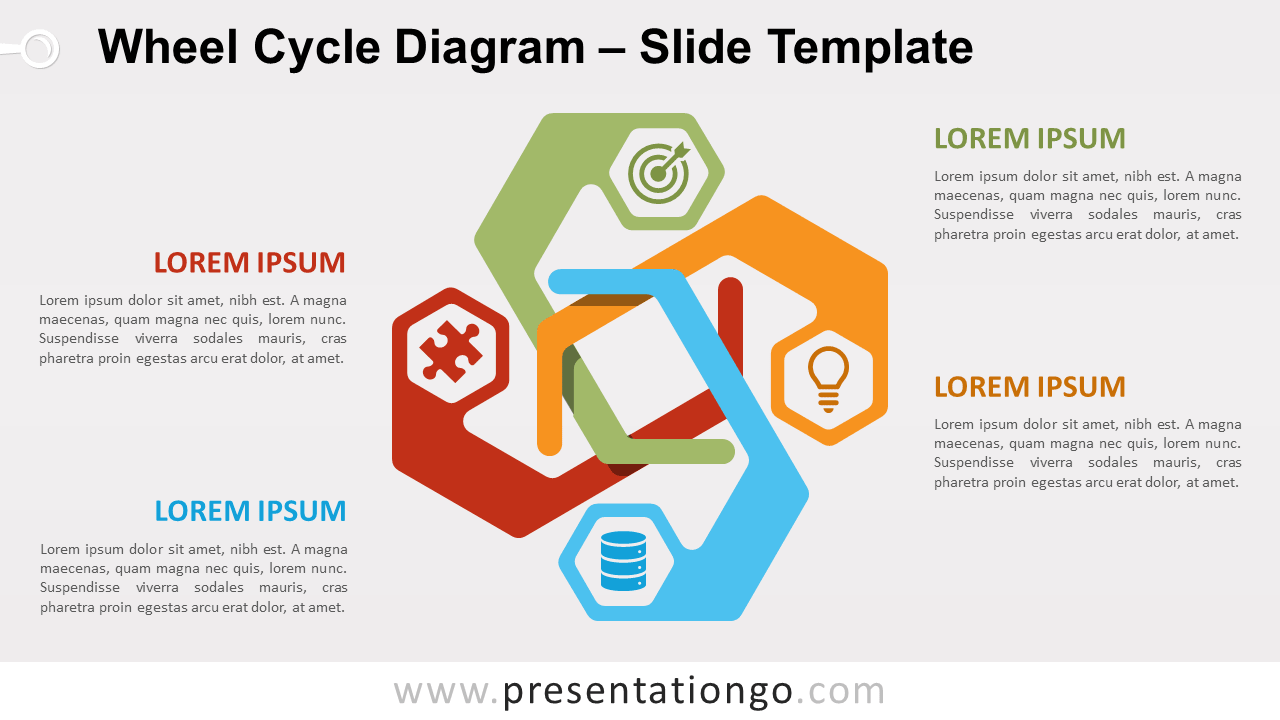
Free wheel cycle diagram for PowerPoint and Google Slides. 4 colorful and modern arcs with circles in a circular flow. Editable graphics. 2 slides.
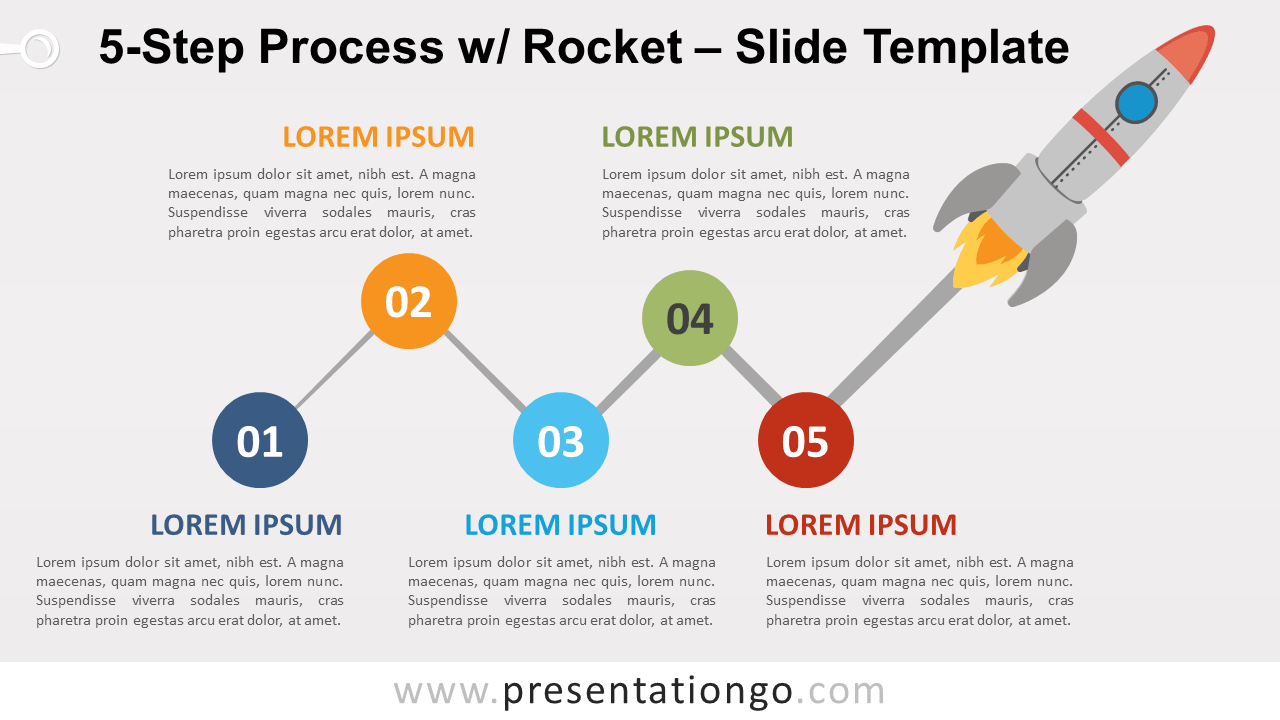
Free 5-step process diagram with rocket for PowerPoint and Google Slides. 5-step alternating horizontal process diagram with flying rocket and smoke trail.
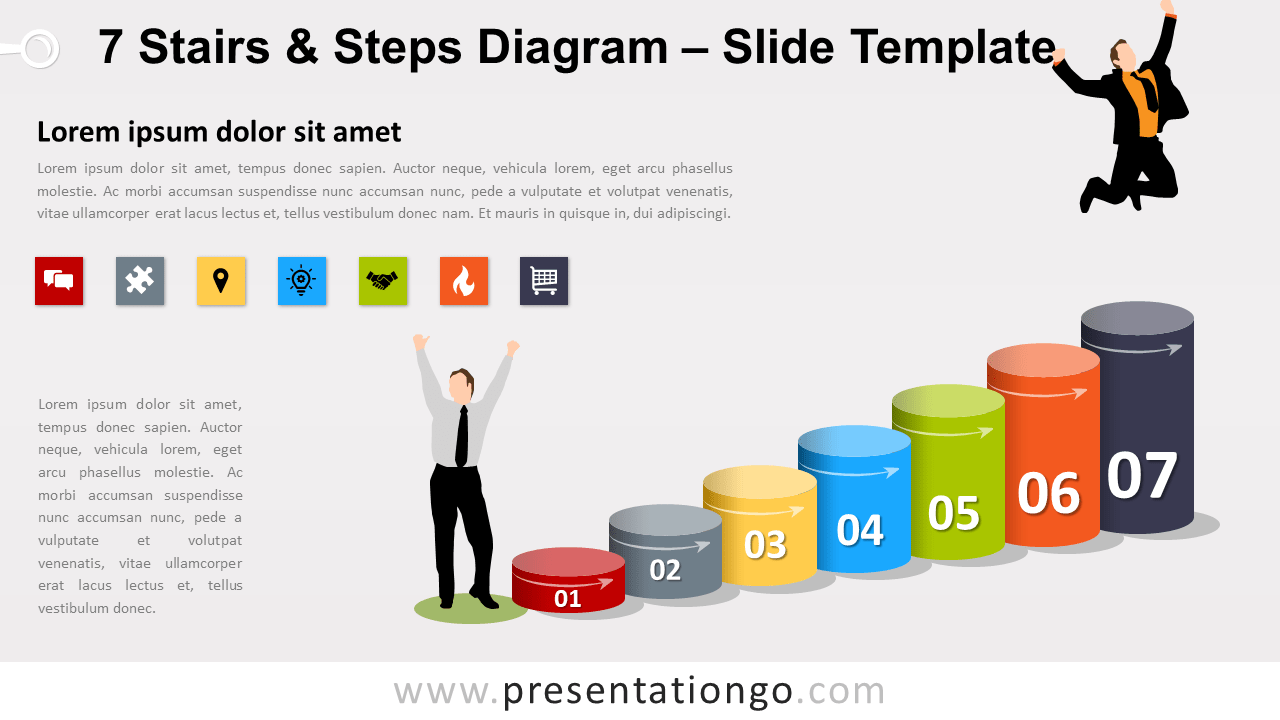
Free diagram with 7 stairs and steps for PowerPoint and Google Slides. An increasing series of 7 cylinders and 2 businessman silhouettes.
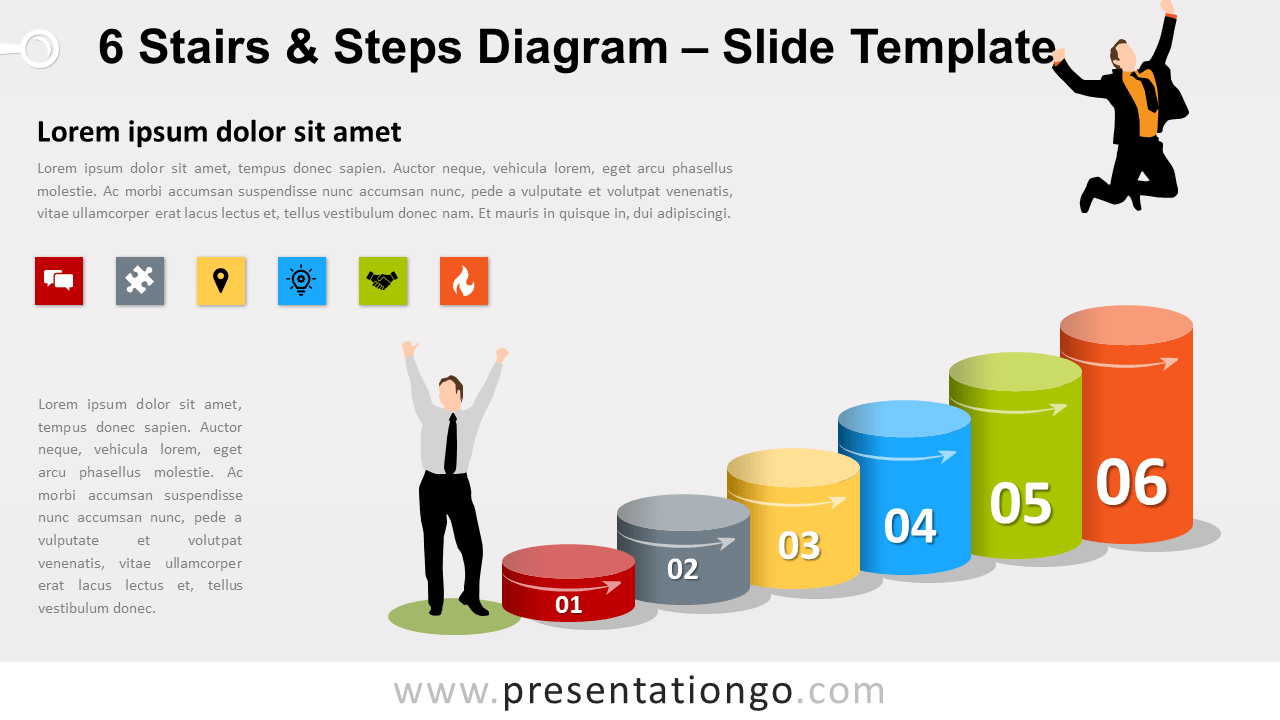
Free diagram with 6 stairs and steps for PowerPoint and Google Slides. An increasing series of 6 cylinders and 2 businessman silhouettes.
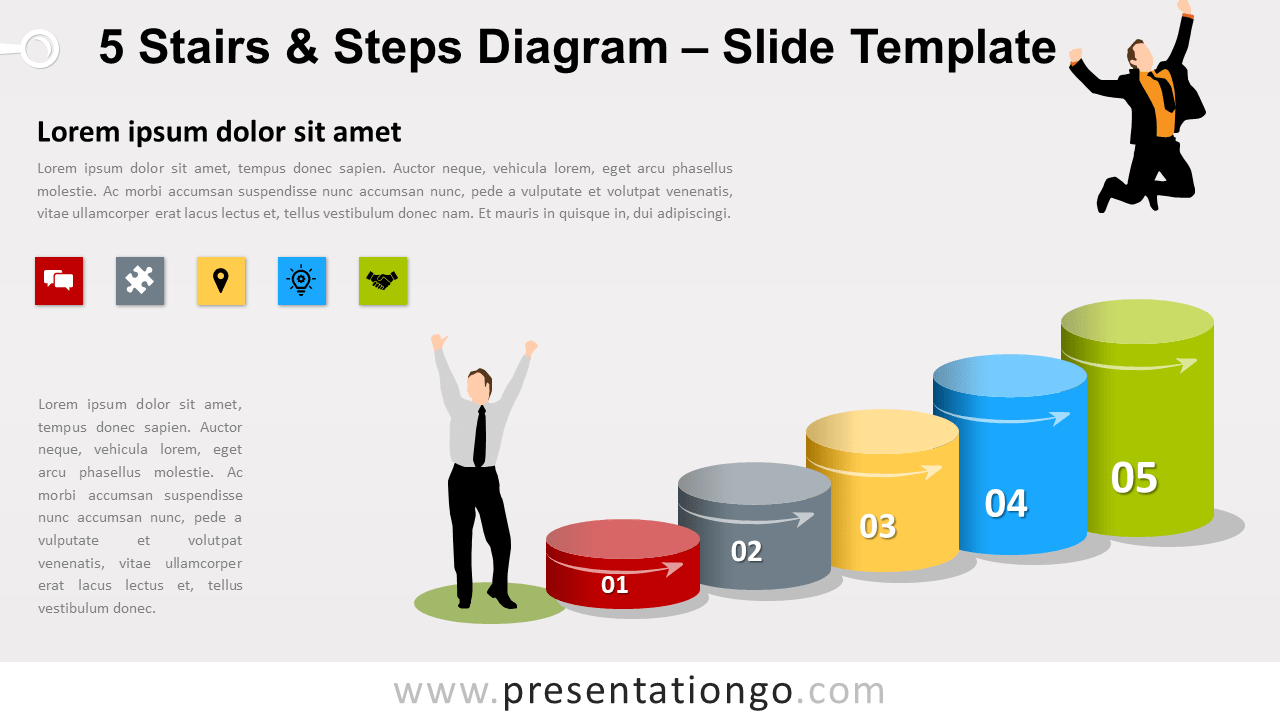
Free diagram with 5 stairs and steps for PowerPoint and Google Slides. Illustration of 5 cylinders and 2 businessman silhouettes. Editable graphics.
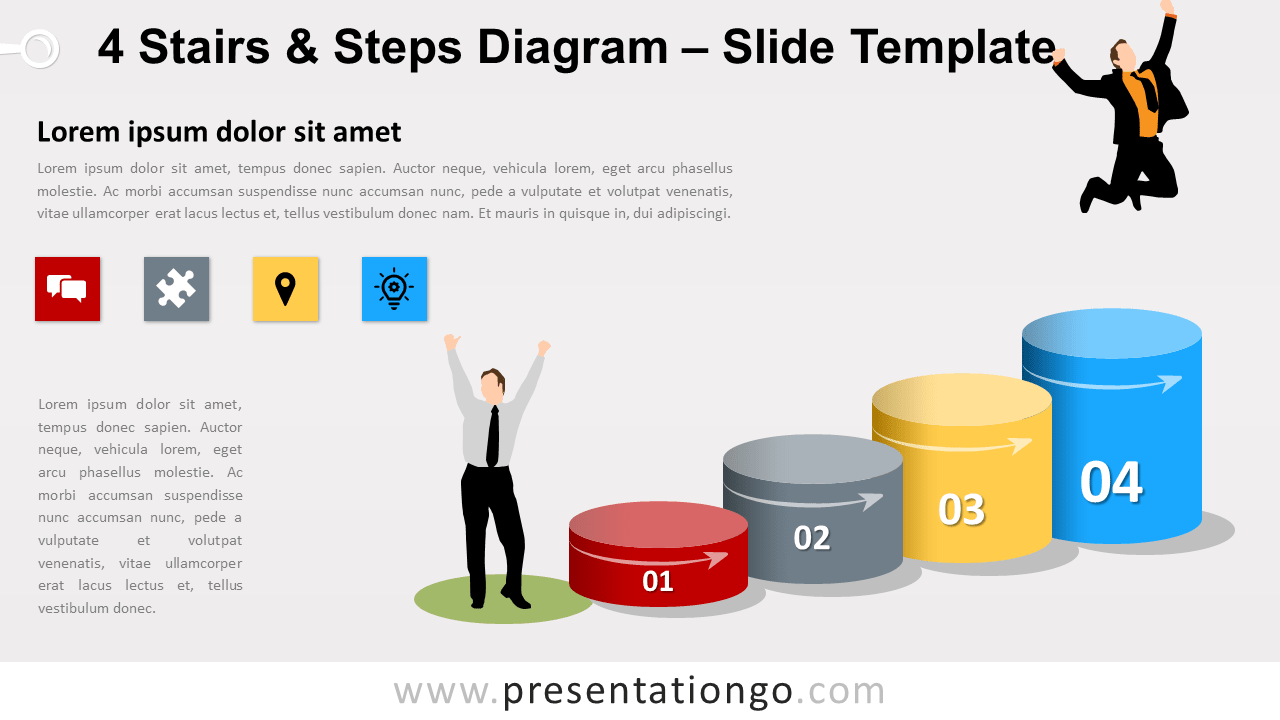
Free diagram with 4 stairs and steps for PowerPoint and Google Slides. Illustration of 4 cylinders and 2 businessman silhouettes. Editable graphics.
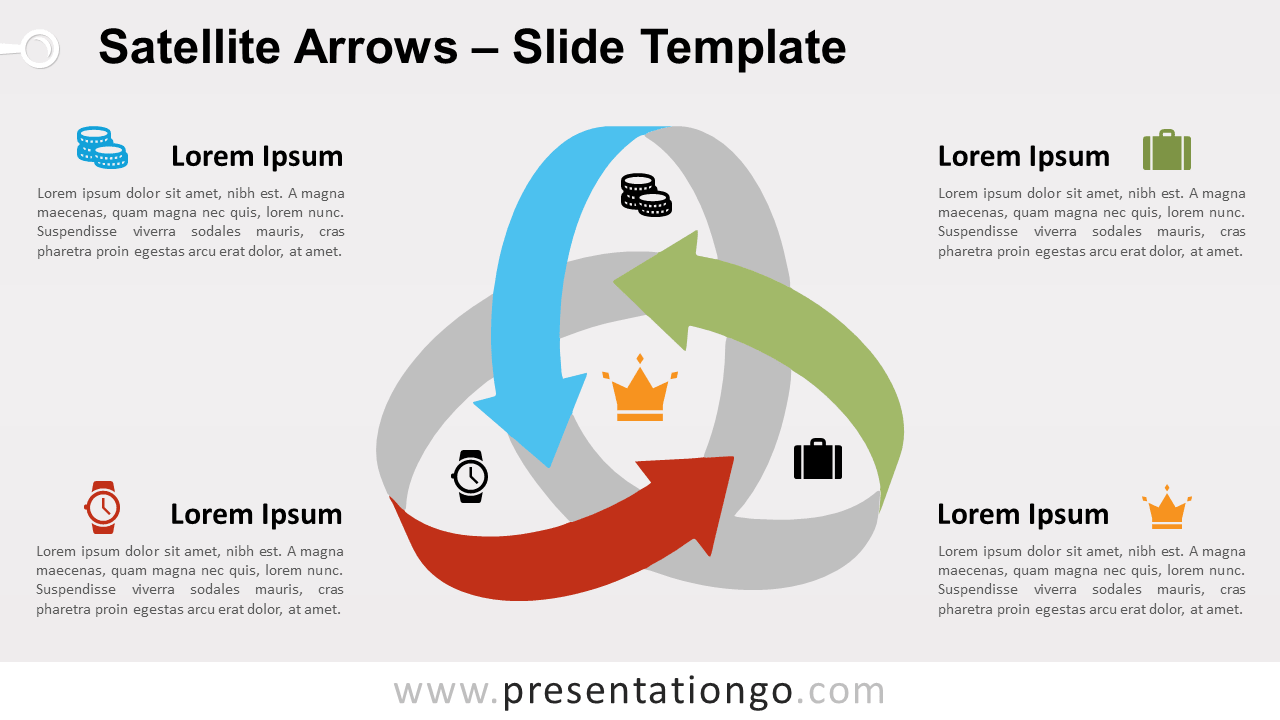
Free satellite arrows for PowerPoint and Google Slides. Continued circular path made with 3 curved arrows (like satellite orbits). Editable graphics.
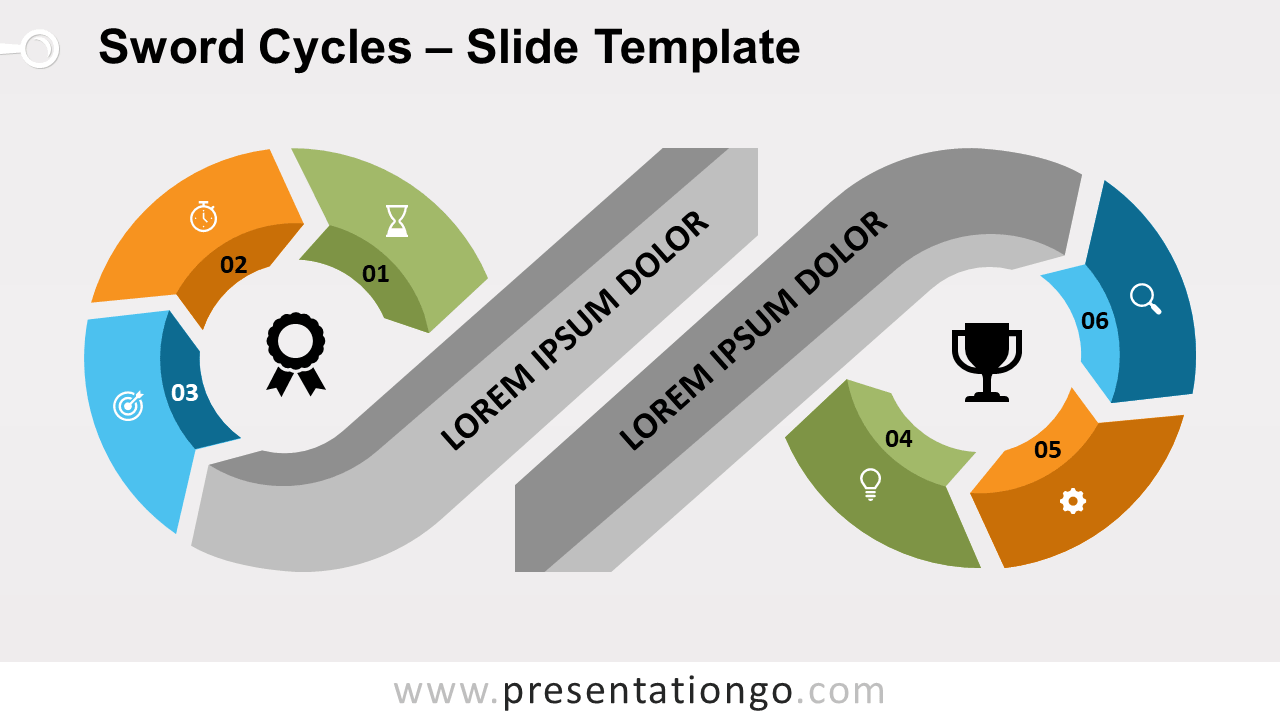
Free sword cycles for PowerPoint and Google Slides. Two 3-step circular diagrams ending with a sword. The 2 editable diagrams make an infinity symbol.
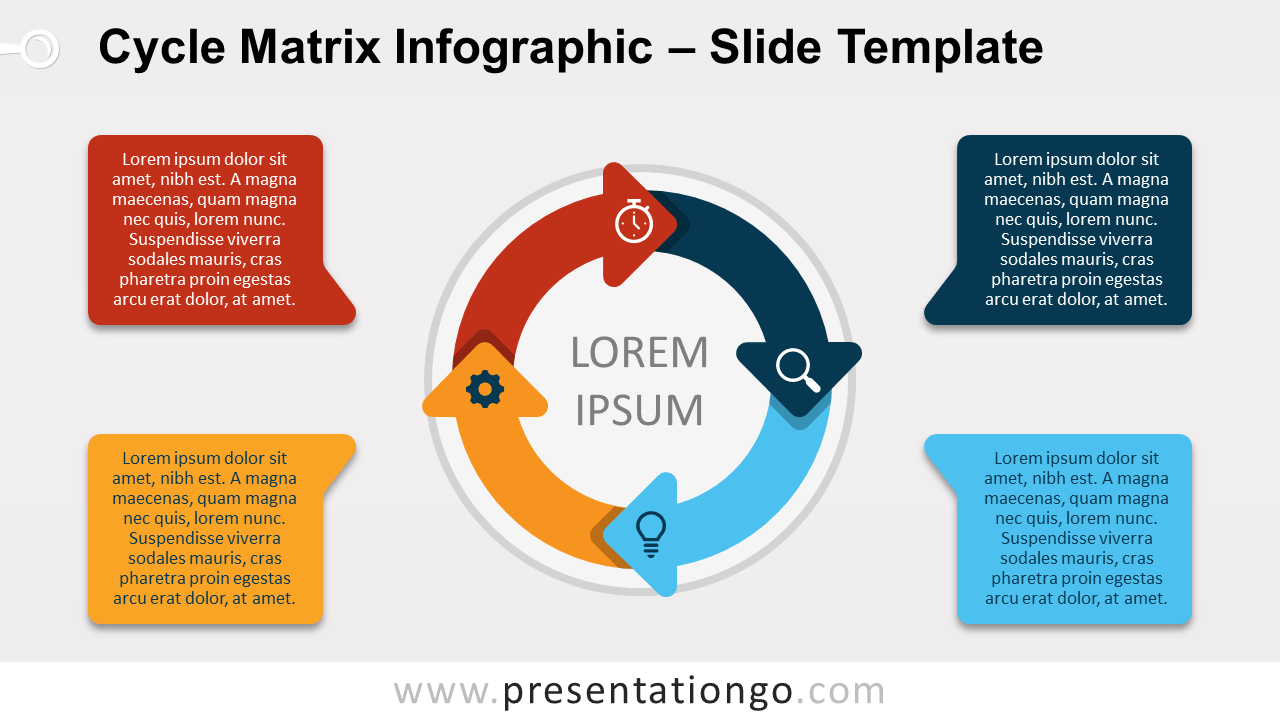
Free cycle matrix infographic for PowerPoint and Google Slides. 4-step circular diagram with curved arrows and speech bubbles. Editable graphics. 2 slides.
Free puzzle cycle with 6 steps for PowerPoint. Donut-like hexagonal shape with 6 puzzle pieces, assembled or interlocked in a circular flow.
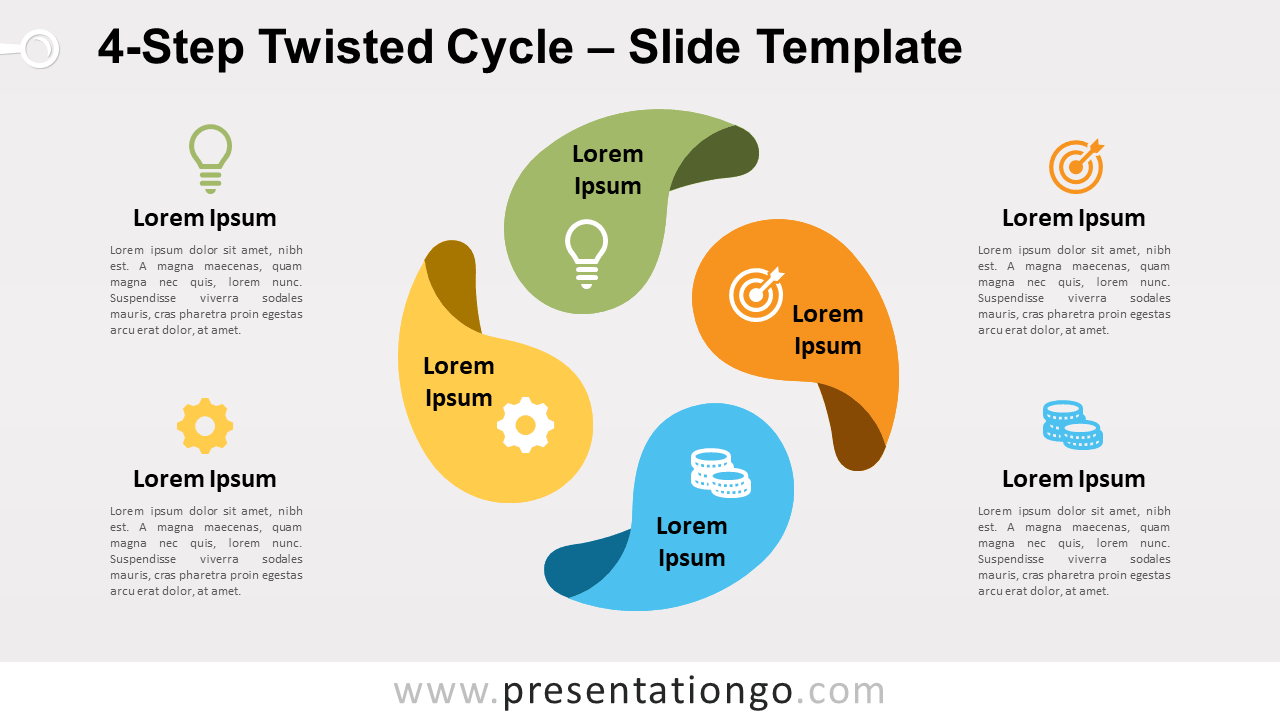
Free cycle diagram with 3 twisted shapes for PowerPoint and Google Slides. 4-step circular diagram. Editable graphics with icons and text placeholders.
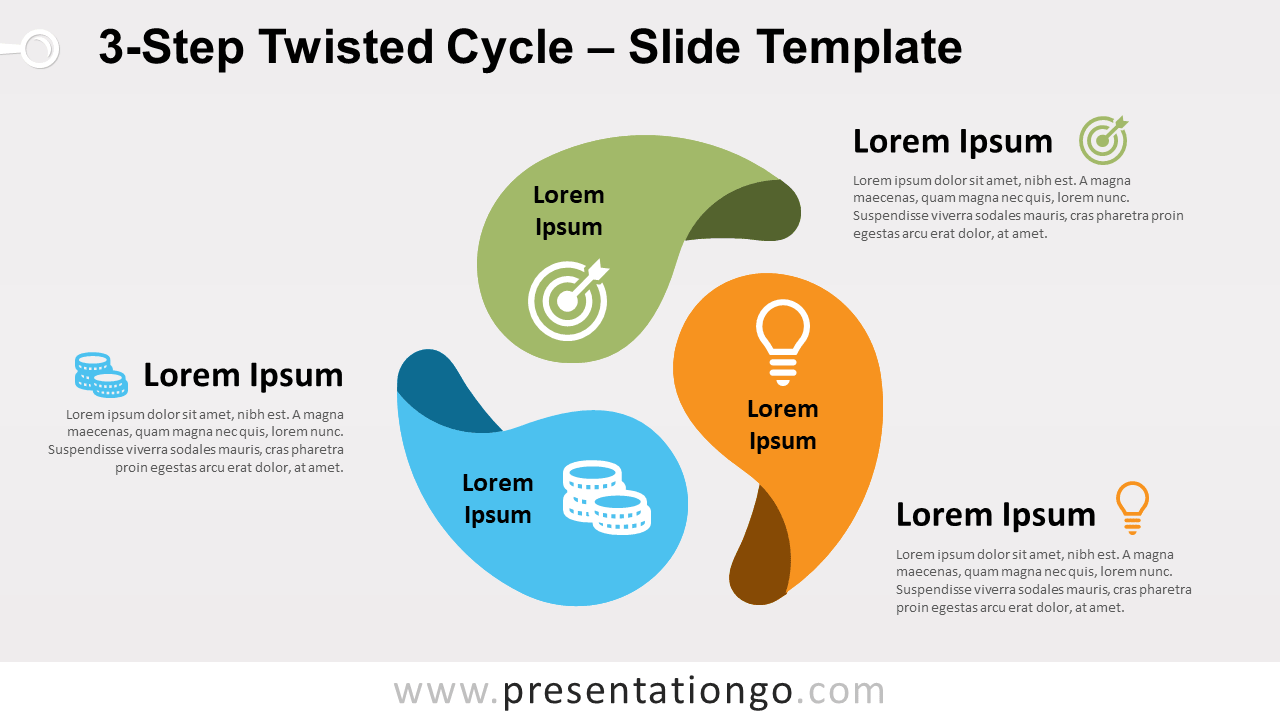
Free cycle diagram with 3 twisted shapes for PowerPoint and Google Slides. 3-step circular diagram. Editable graphics with icons and text placeholders.
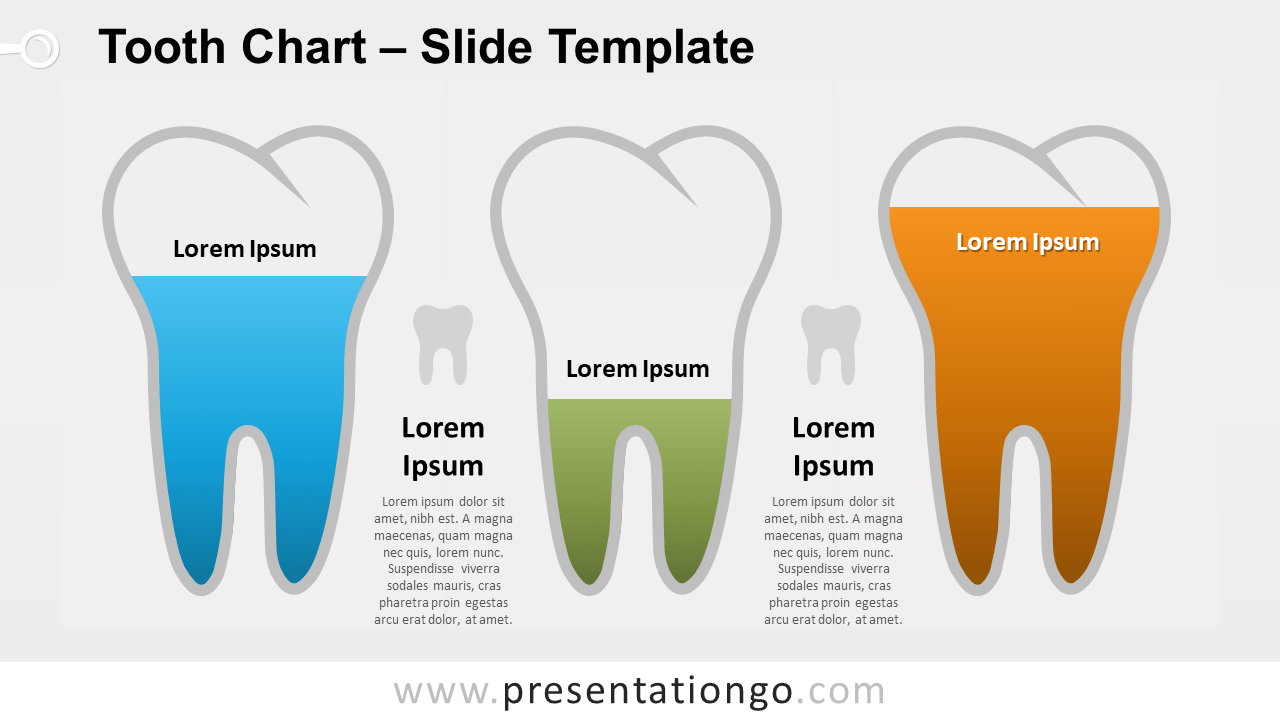
Free tooth chart for PowerPoint and Google Slides. Editable booth illustrations with adjustable fill height. Non-data-driven chart alternative. 2 slides.
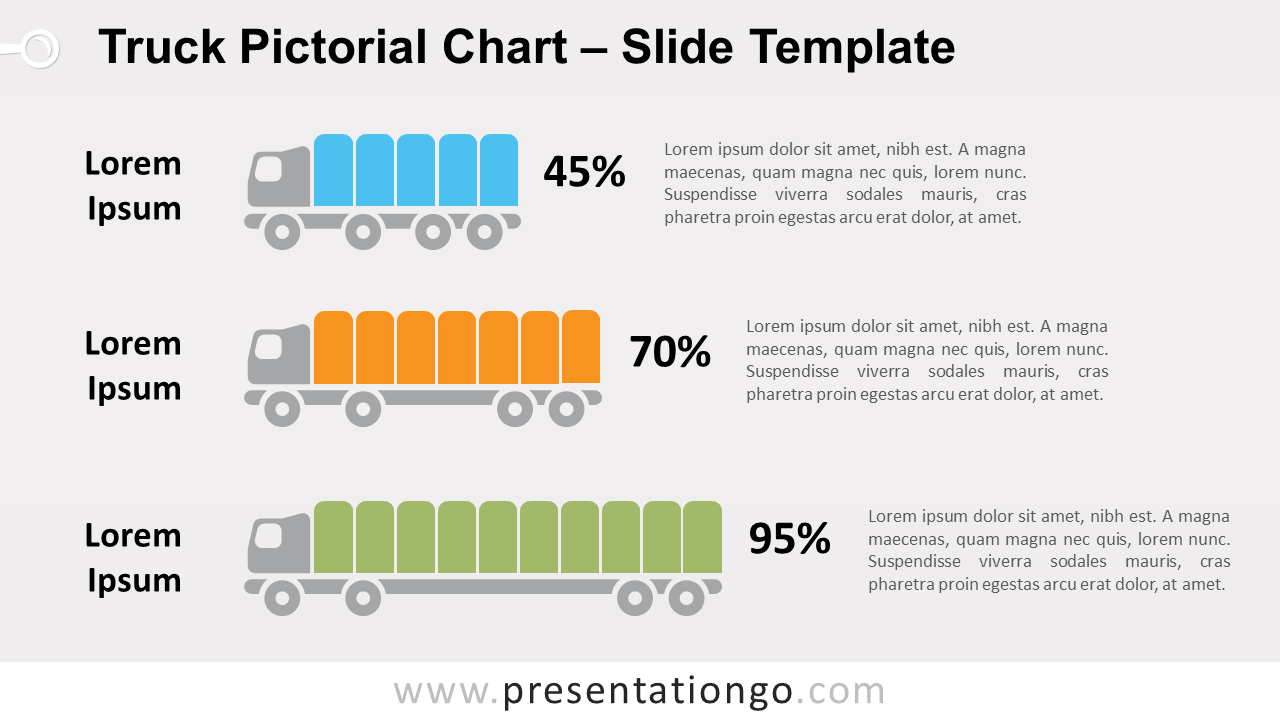
Free truck pictorial chart for PowerPoint and Google Slides. 3 trucks loaded with bars. Non-data-driven chart alternative. Editable graphics.
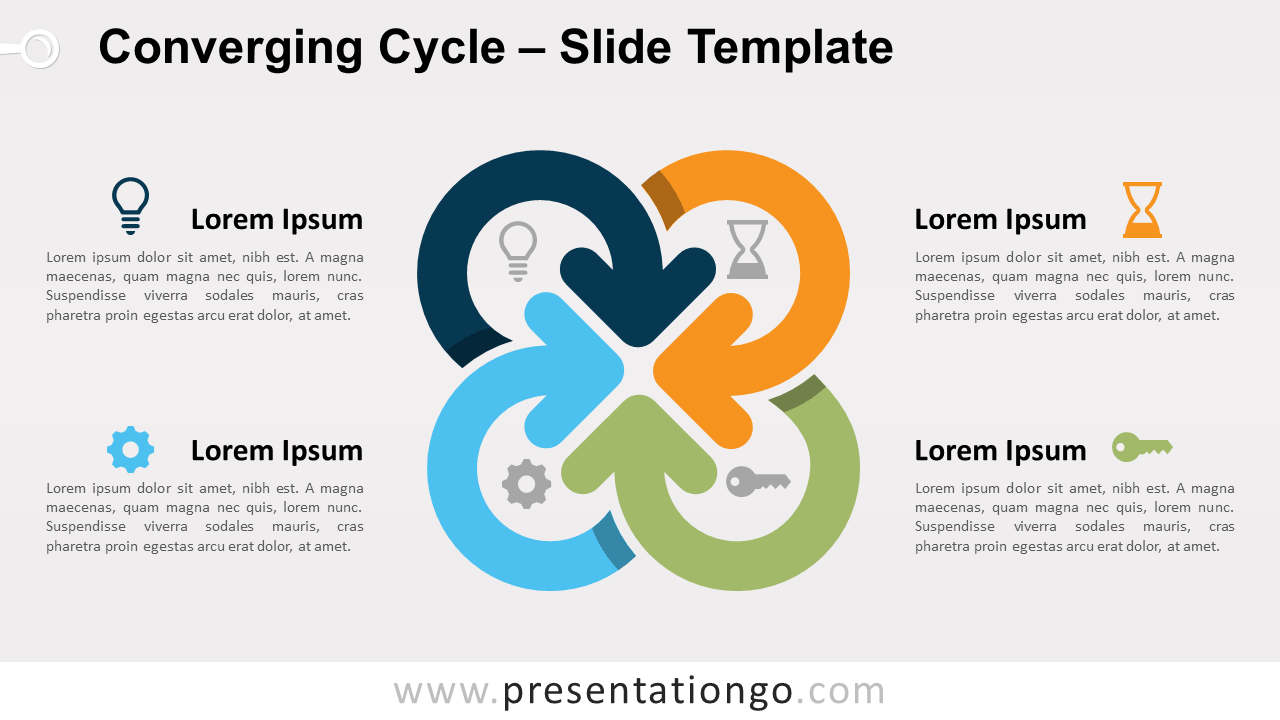
Free converging cycle diagram for PowerPoint and Google Slides. 4 curved arrows converging to a circular shape in the center. Editable graphics.
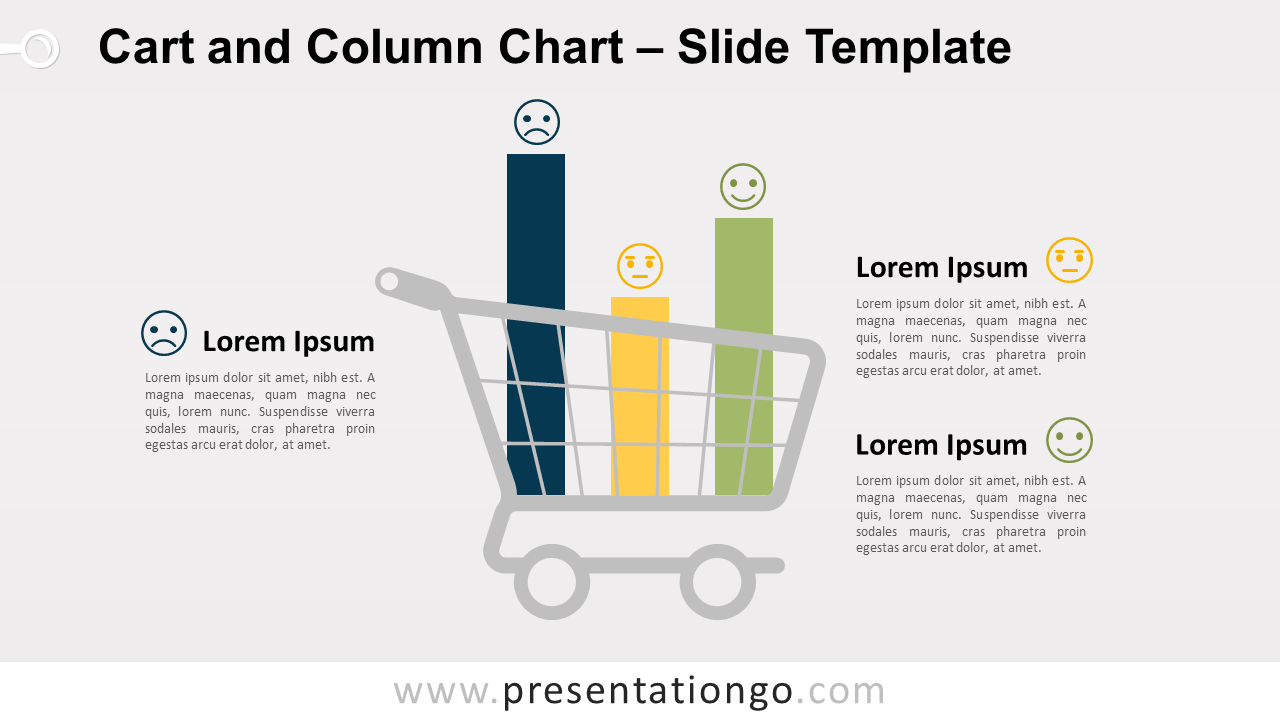
Free cart and column chart for PowerPoint. Data-driven column chart in a shopping cart. Great to illustrate quantitative results about shopping.
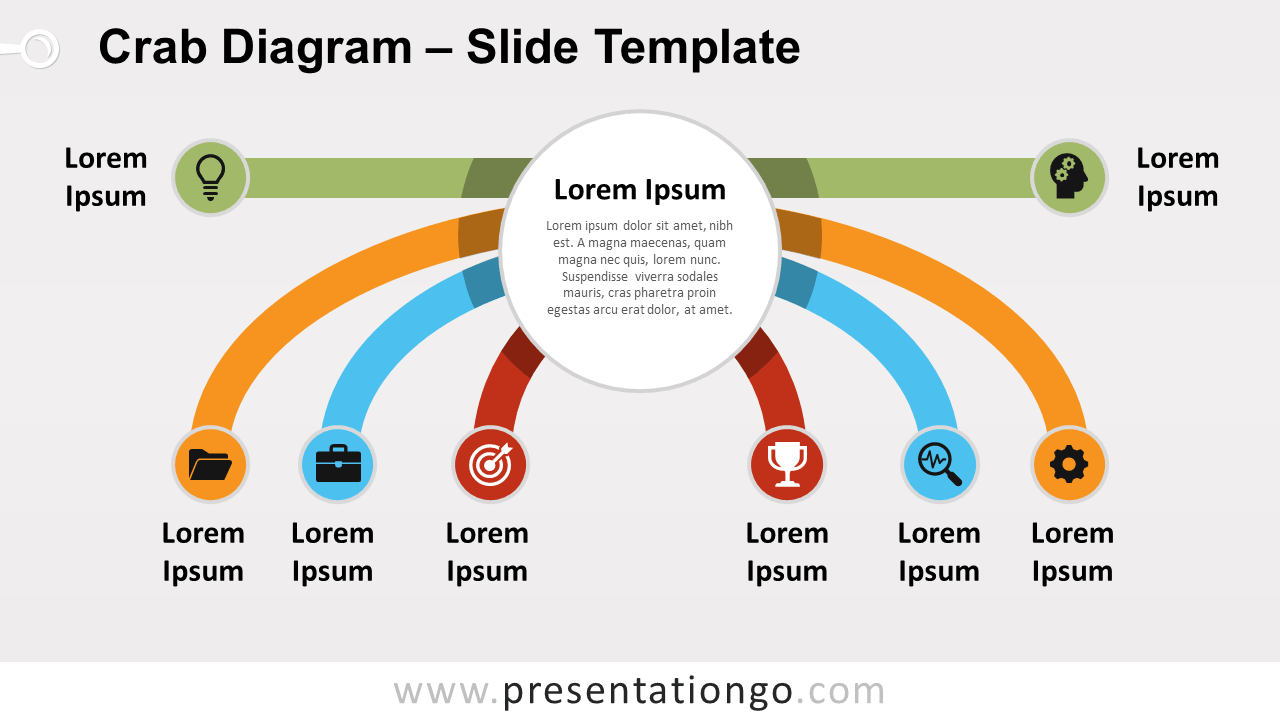
Free crab diagram for PowerPoint and Google Slides. Radial chart with 8 elements connected to a central circle. Use it also as an organization chart.
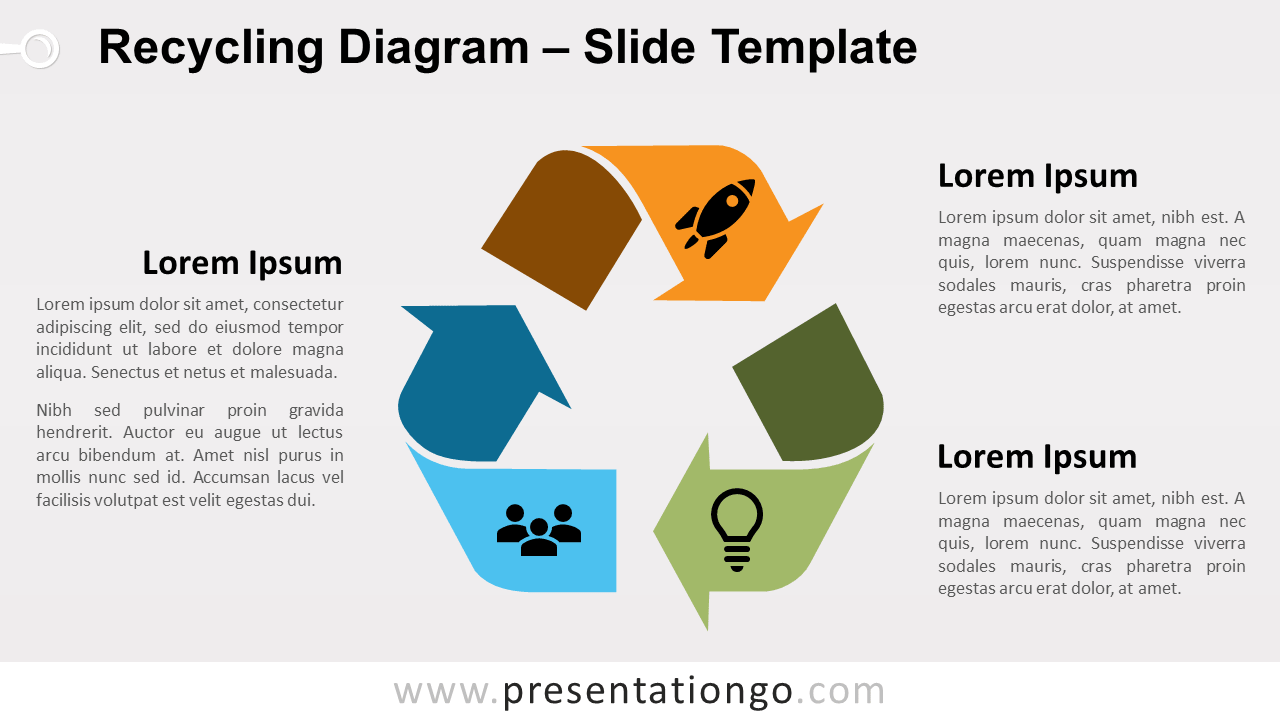
Free recycling diagram for PowerPoint and Google Slides. Colorful illustration of the universal recycling symbol. Editable graphics.
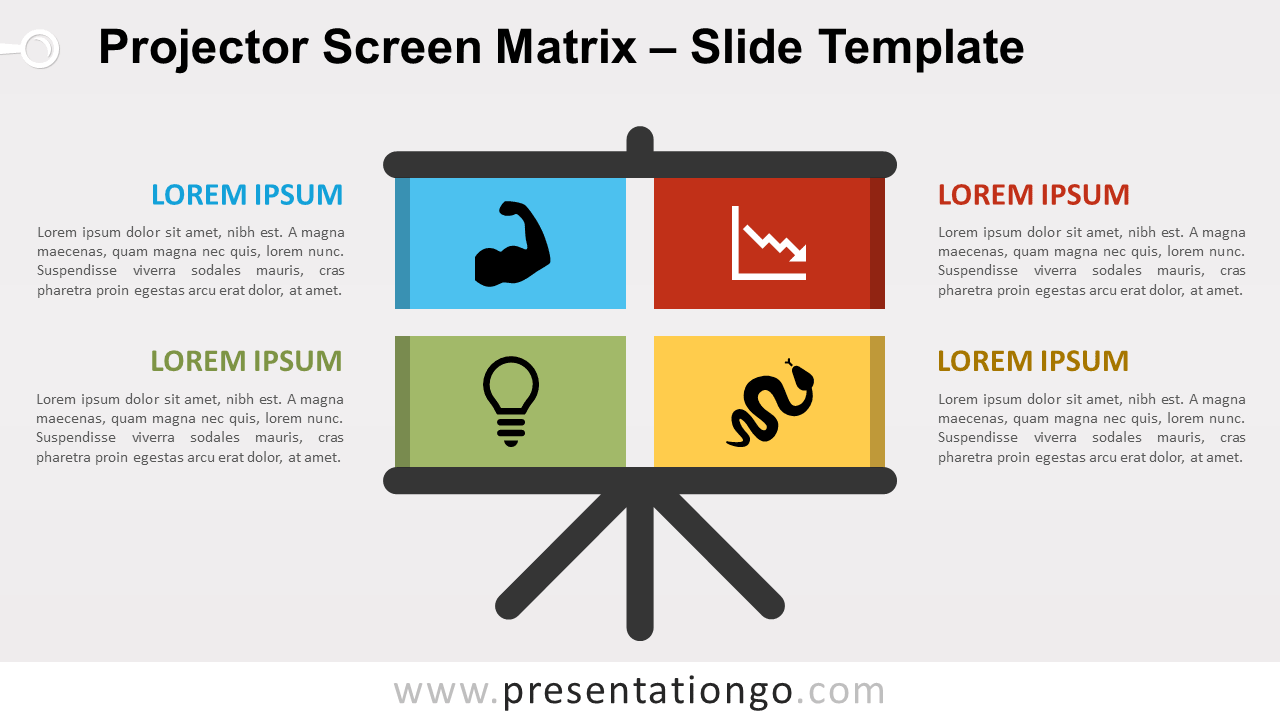
Free projector screen matrix template for PowerPoint. Four-quadrant matrix diagram designed in place of the screen of a projector pictogram. Editable design
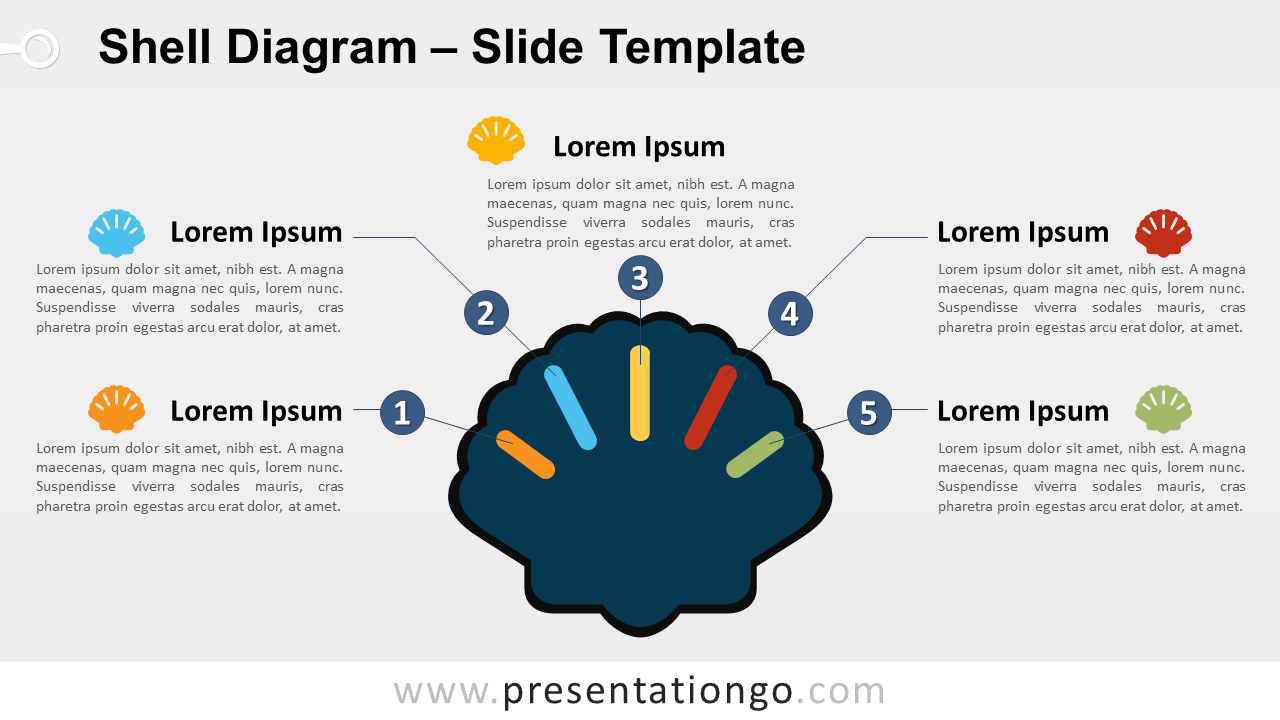
Free shell diagram for PowerPoint and Google Slides. Illustration of an editable scallop shell used as a semi-circular cycle diagram, with 5 colorful stages
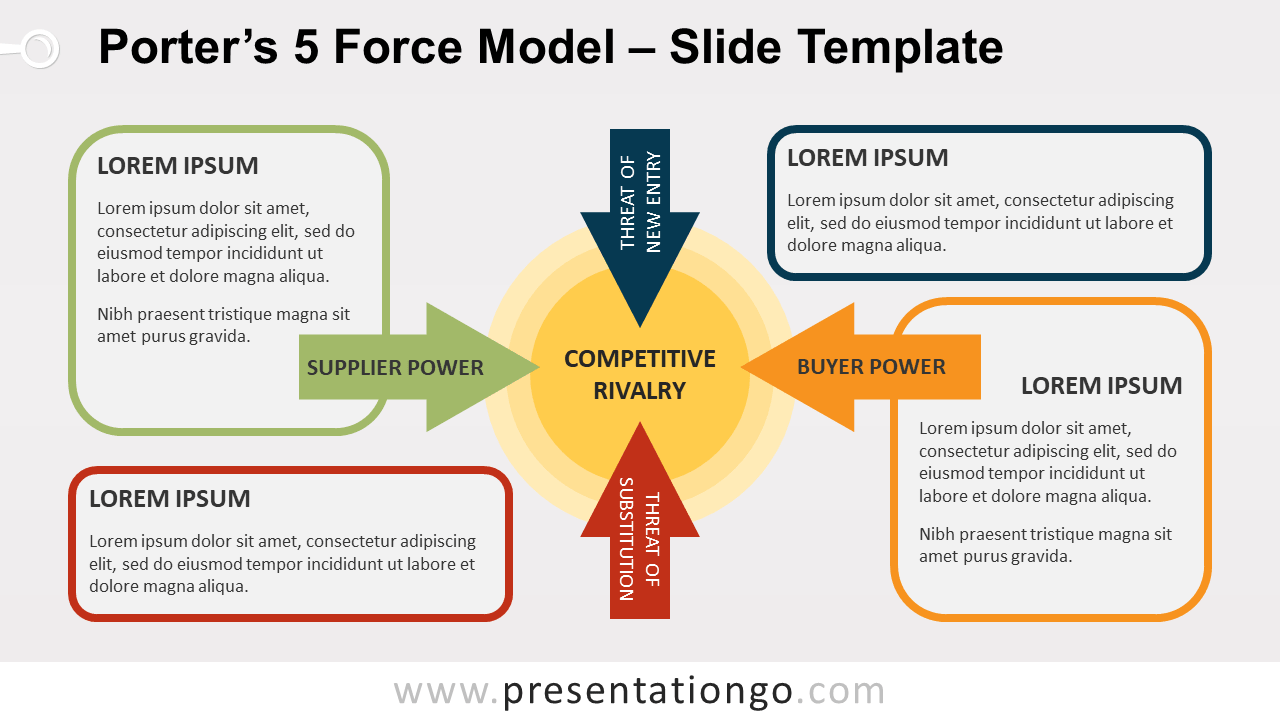
Free Porter's five forces model for PowerPoint and Google Slides. Framework template for evaluating the competitive strength of a business organization.
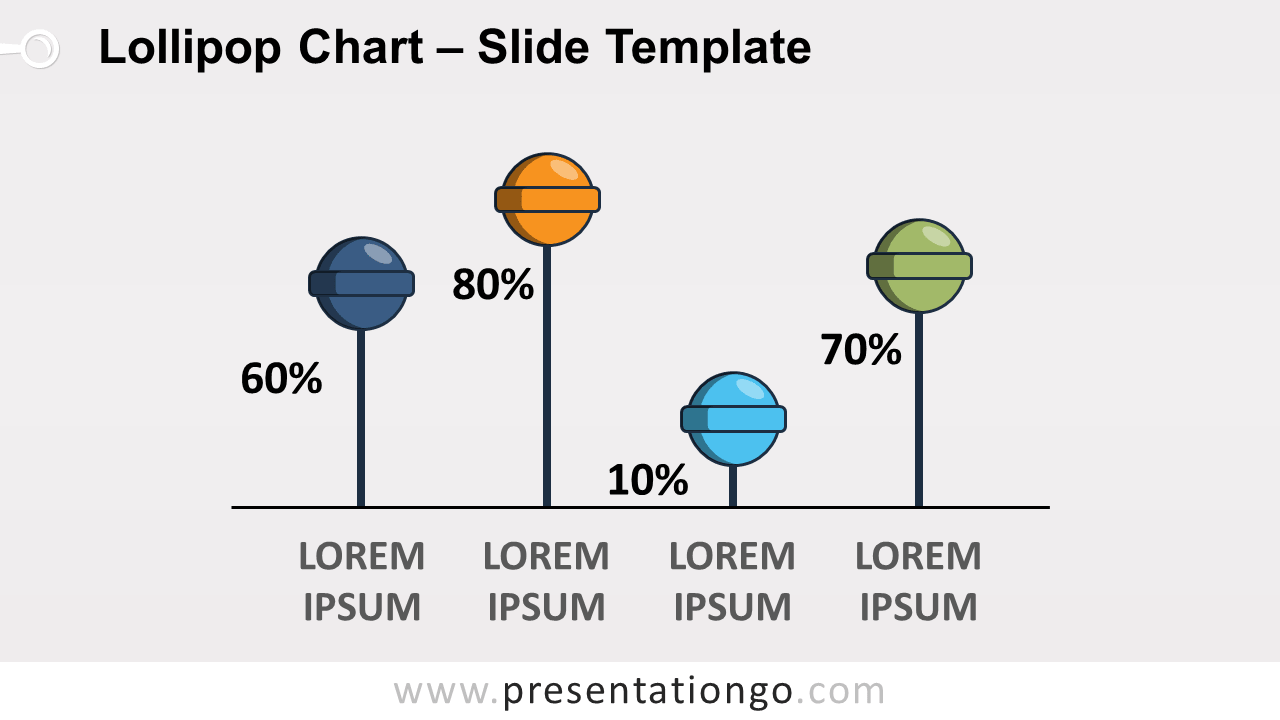
Free lollipop chart for PowerPoint and Google Slides. 4 vertical lollipops with adjustable stick length. Non-data-driven chart. Editable graphics
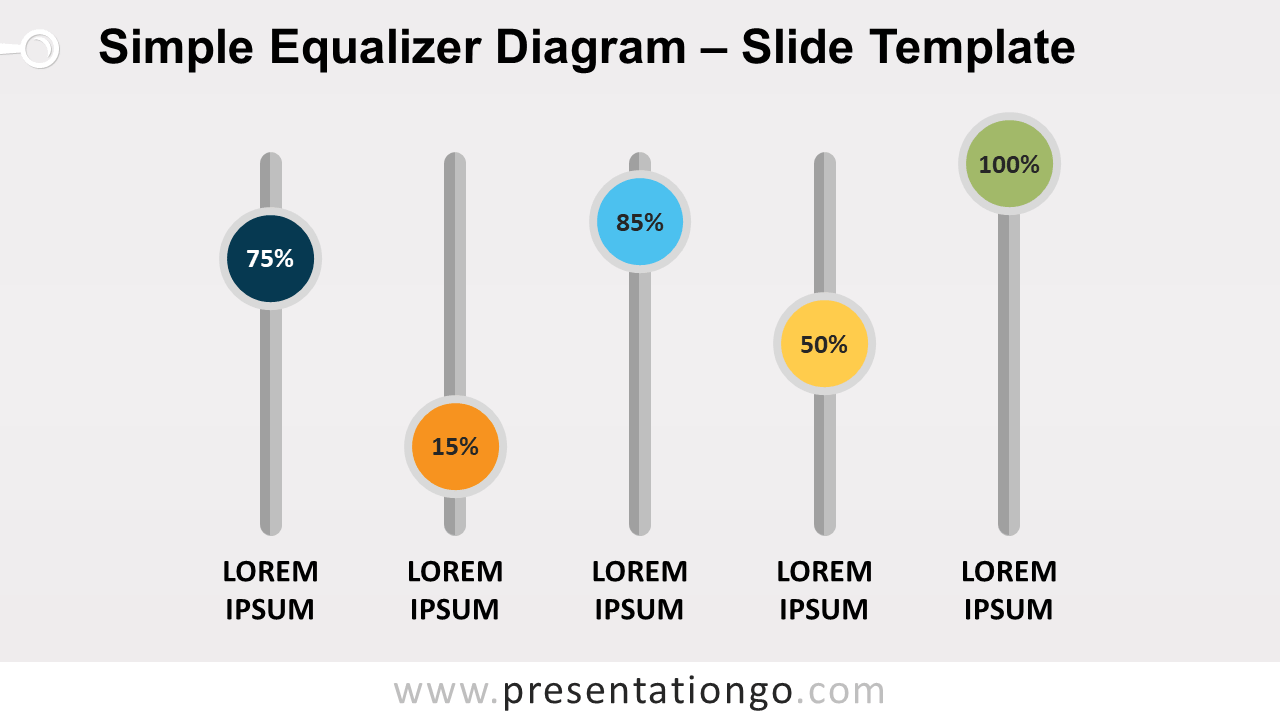
Free simple equalizer diagram for PowerPoint. 5 vertical bars with circles to be manually adjusted for the required (custom) frequency. Editable graphics.
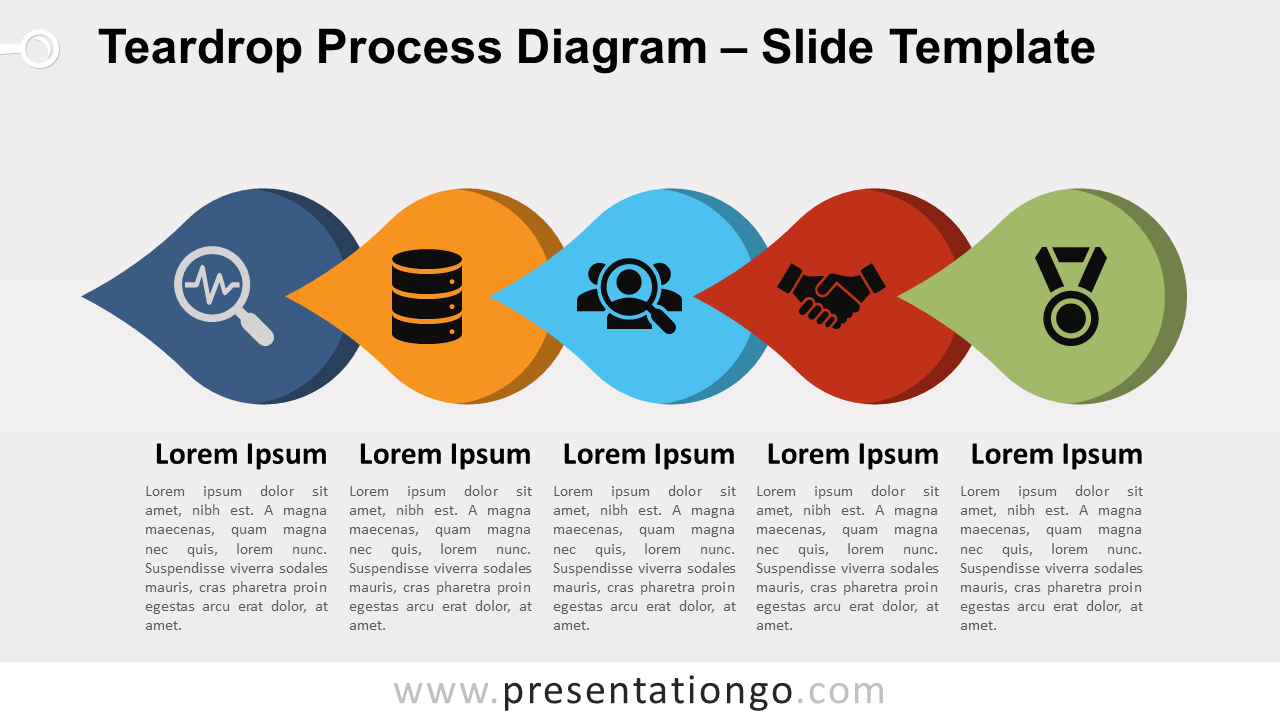
Free teardrop process diagram for PowerPoint and Google Slides. Horizontal process diagram with 5 right teardrop shapes. Editable graphics. 2 slides.