Loading resources…
Total 1760 resources
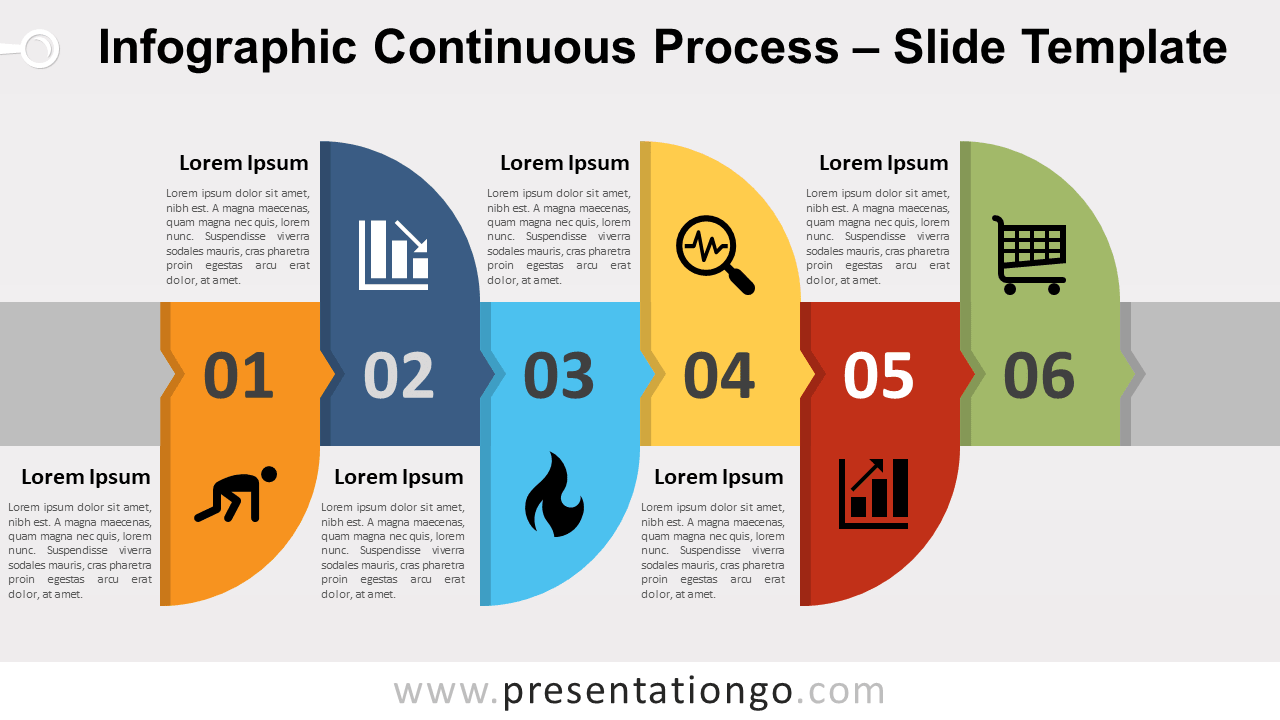
Free infographic continuous process diagram for PowerPoint and Google Slides. Horizontal process diagram with 6 up and down curved daggerboard shapes.
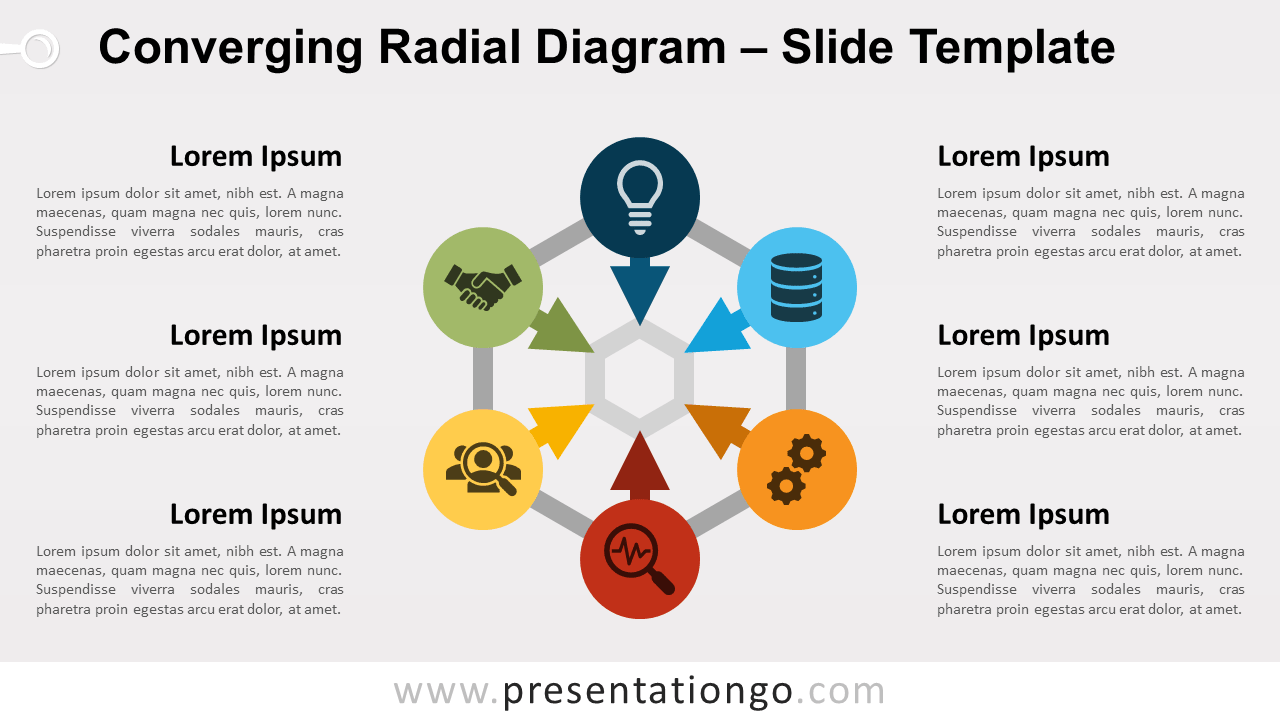
Free converging radial diagram for PowerPoint and Google Slides. Cycle chart w 6 circles and arrows converging to a hexagon in the center. Editable graphics
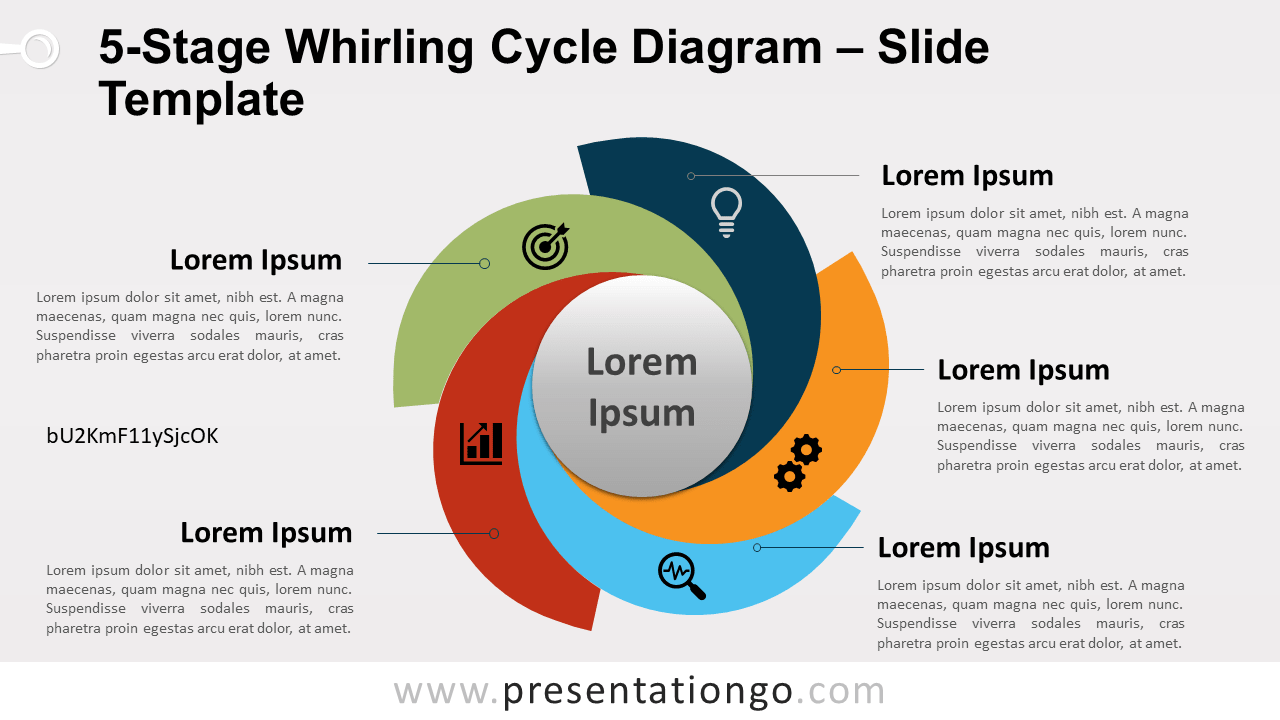
Free whirling cycle diagram with 5 stages for PowerPoint and Google Slides. Editable circular diagram with a swirling pattern, and a circle in the middle.
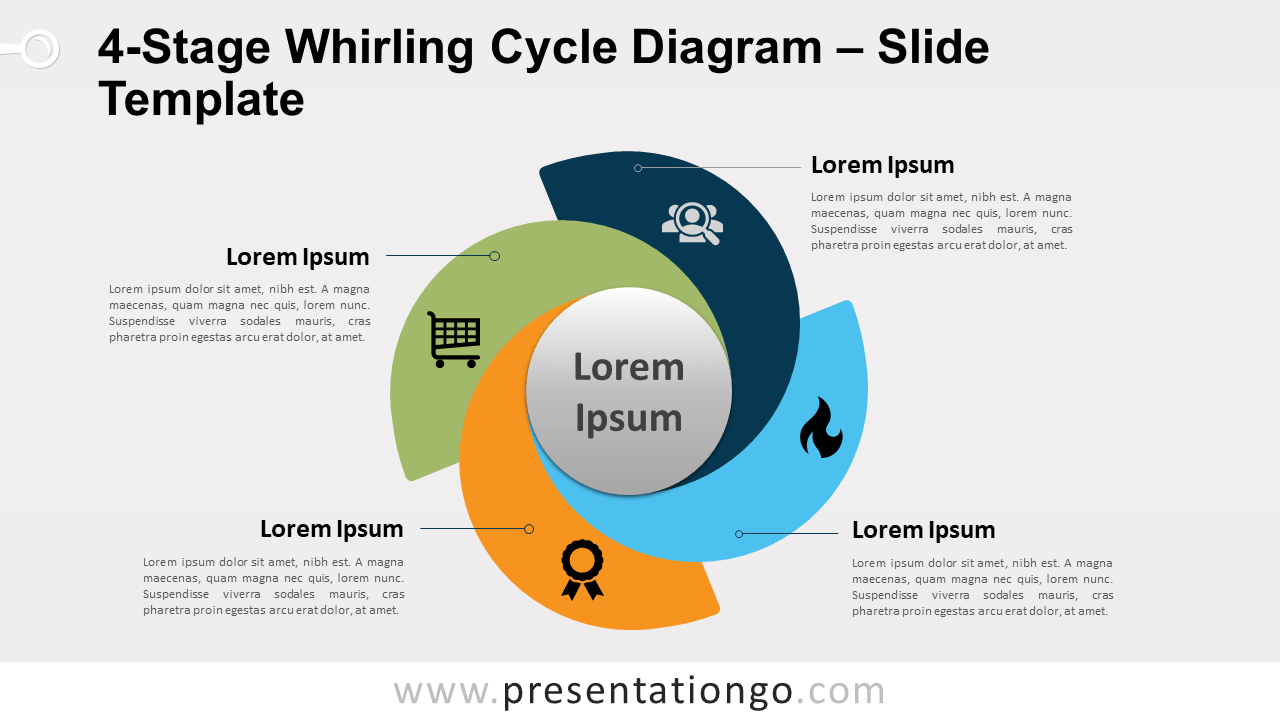
Free whirling cycle diagram with 4 stages for PowerPoint and Google Slides. Editable circular diagram with a swirling pattern, and a circle in the middle.
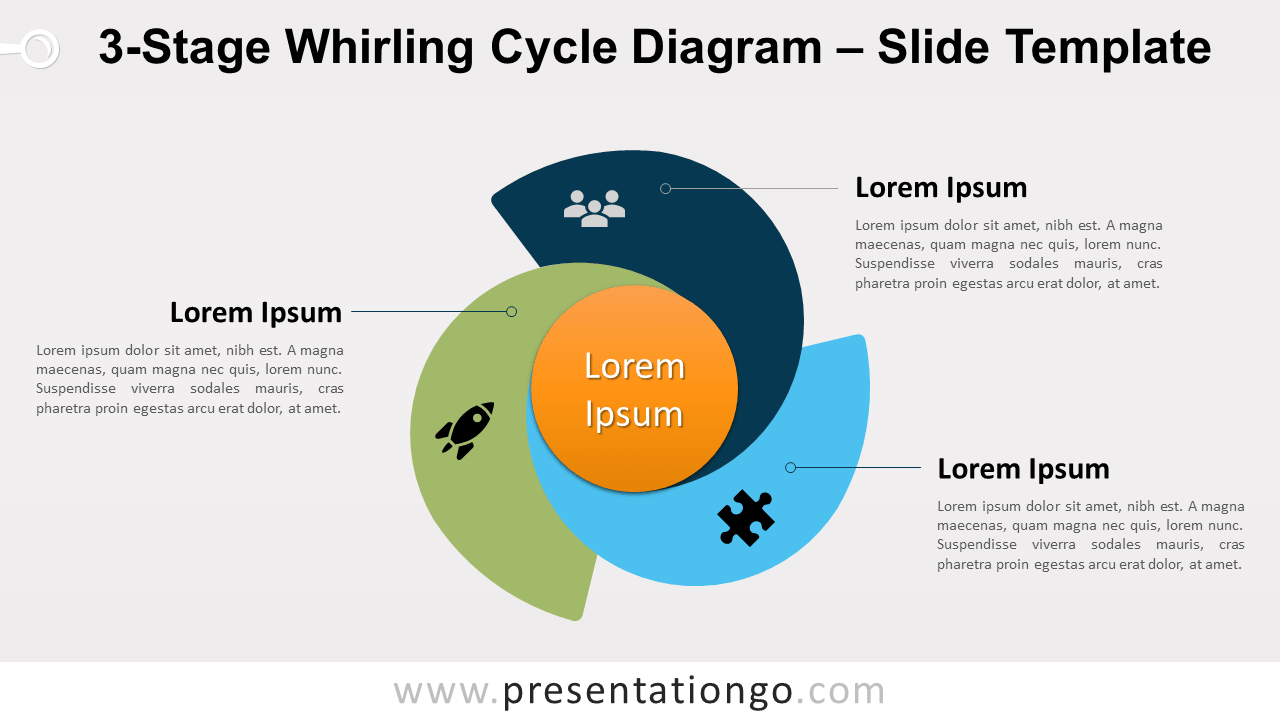
Free whirling cycle diagram with 3 stages for PowerPoint and Google Slides. Editable circular diagram with a swirling pattern, and a circle in the middle.
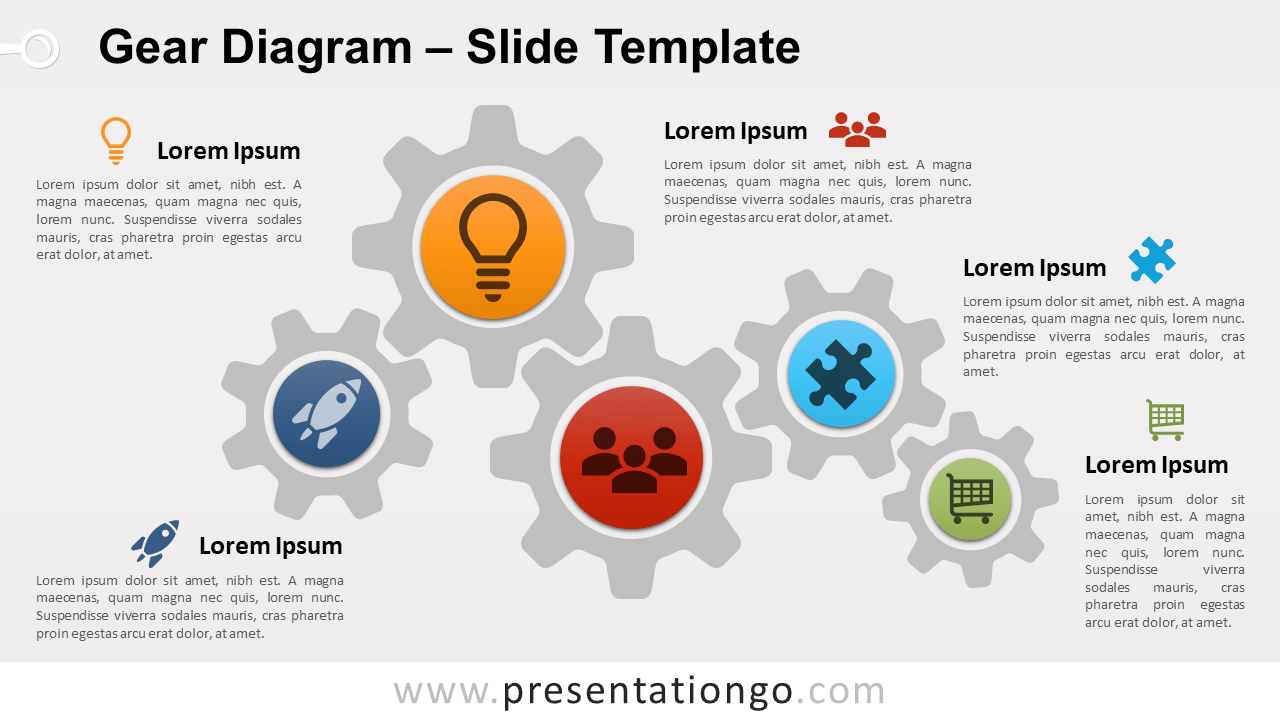
Free gear diagram for PowerPoint and Google Slides. Five horizontally-alined interlocked gears with colorful circles. Editable graphics.
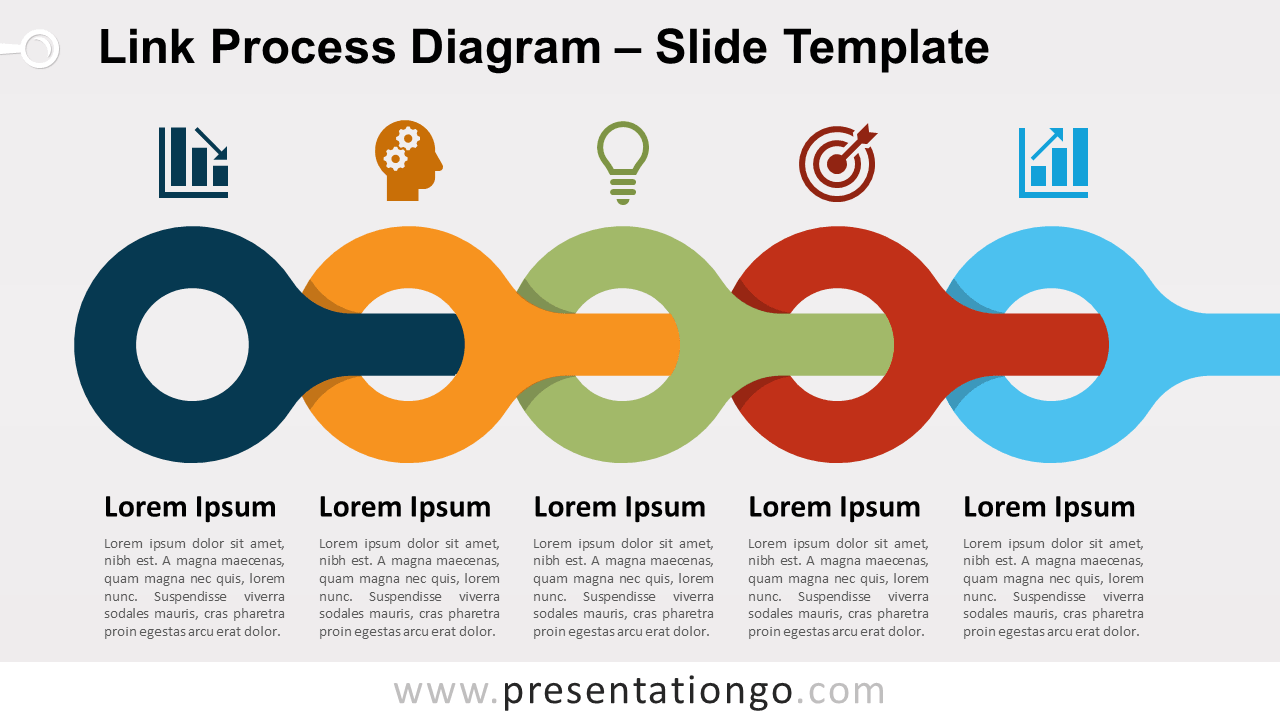
Free link process diagram for PowerPoint and Google Slides. Horizontal process diagram with 5 interlinked magnifier-alike shapes.
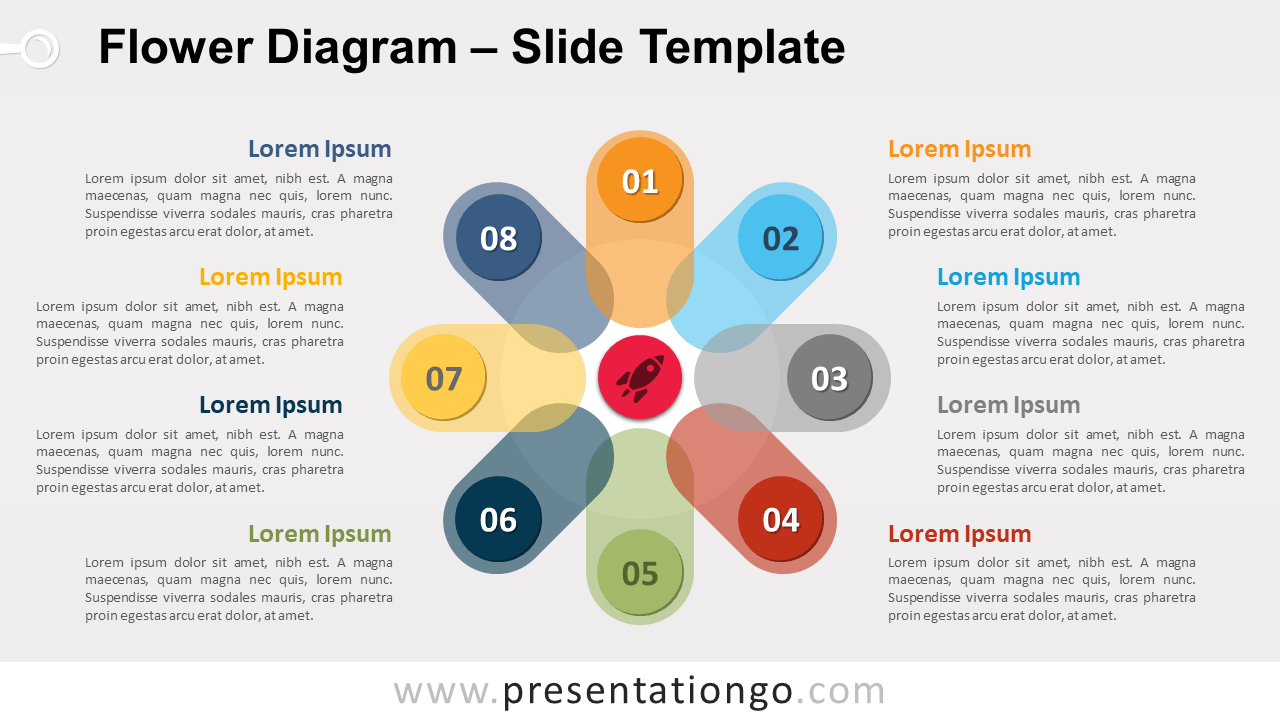
Free flower diagram for PowerPoint and Google Slides. Circular illustration made w 8 rounded rectangle shapes and a circle in the middle. Editable graphics.
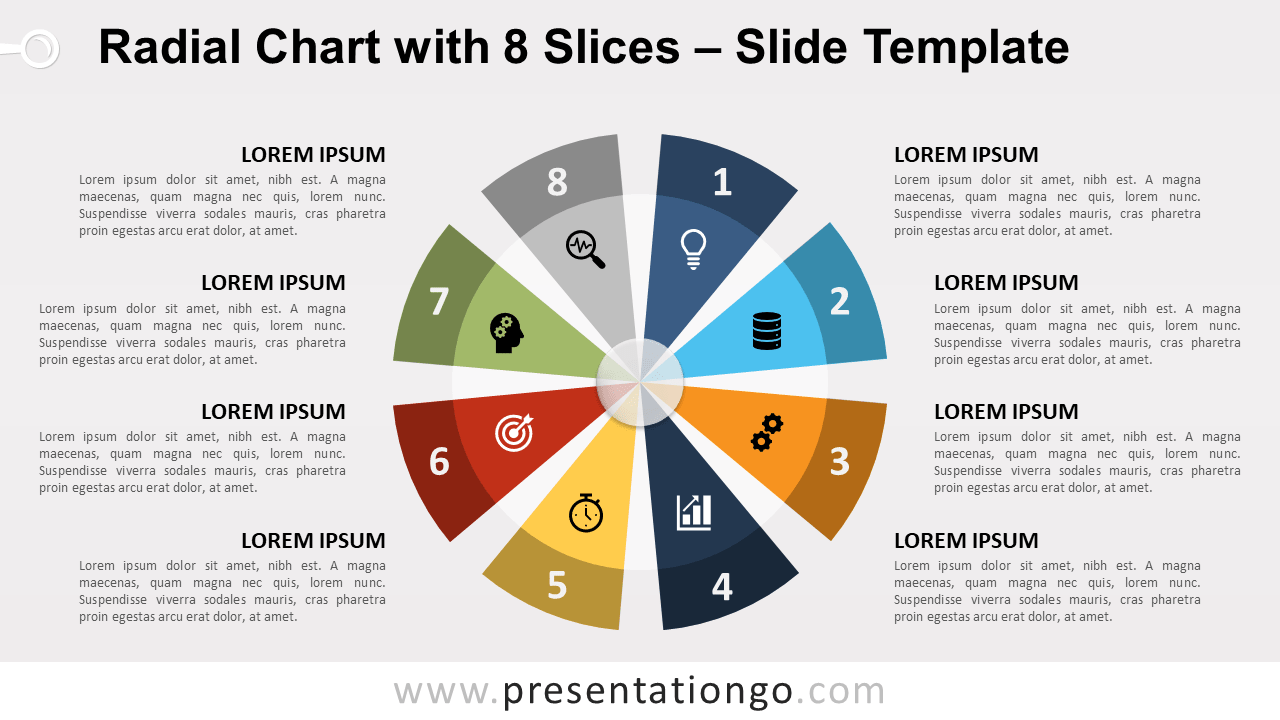
Free radial chart with 8 slices for PowerPoint and Google Slides. Circle chart with 8 equal slices and empty spaces in-between. Editable graphics.
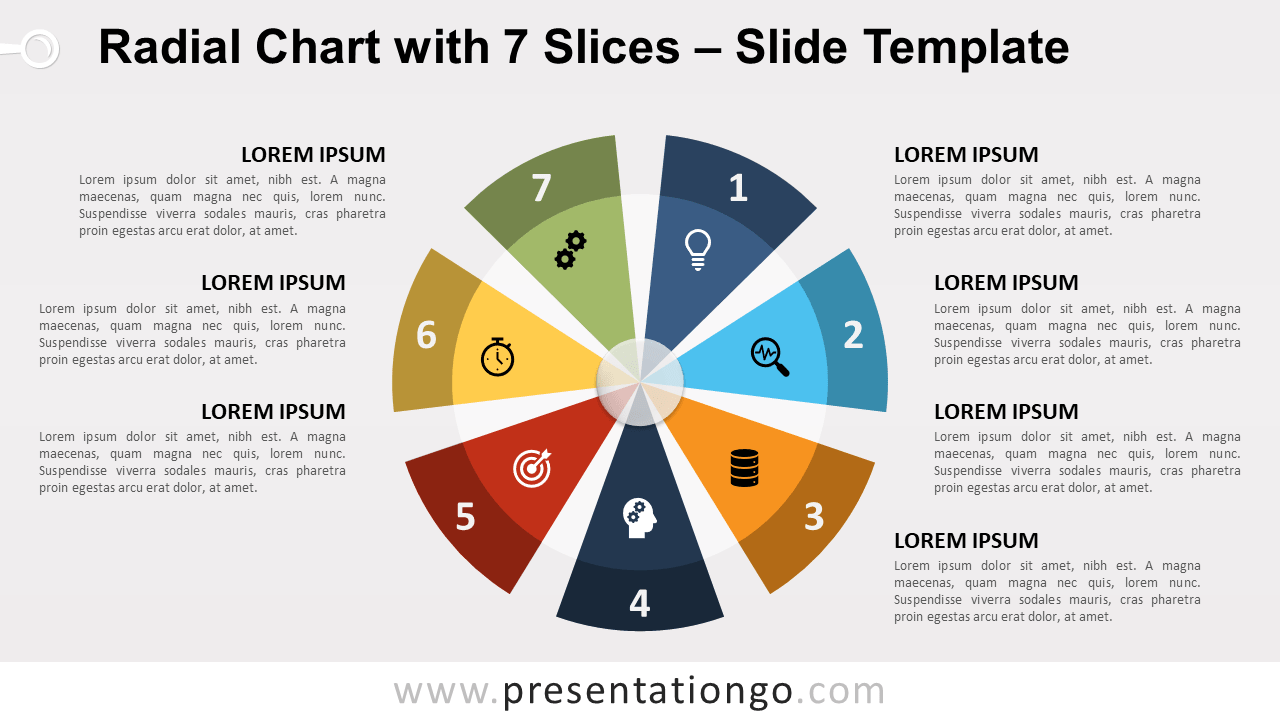
Free radial chart with 7 slices for PowerPoint and Google Slides. Circle chart with 7 equal slices and empty spaces in-between. Editable graphics.
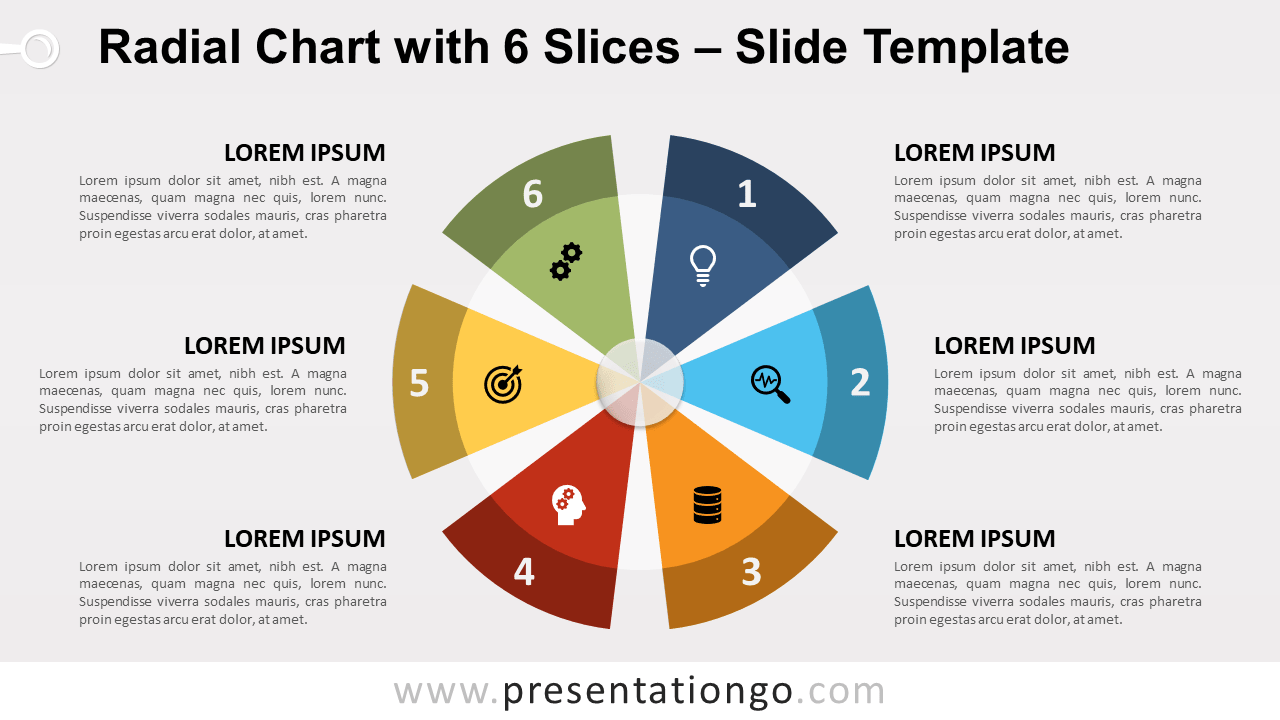
Free radial chart with 6 slices for PowerPoint and Google Slides. Circle chart with 6 equal slices and empty spaces in-between. Editable graphics.
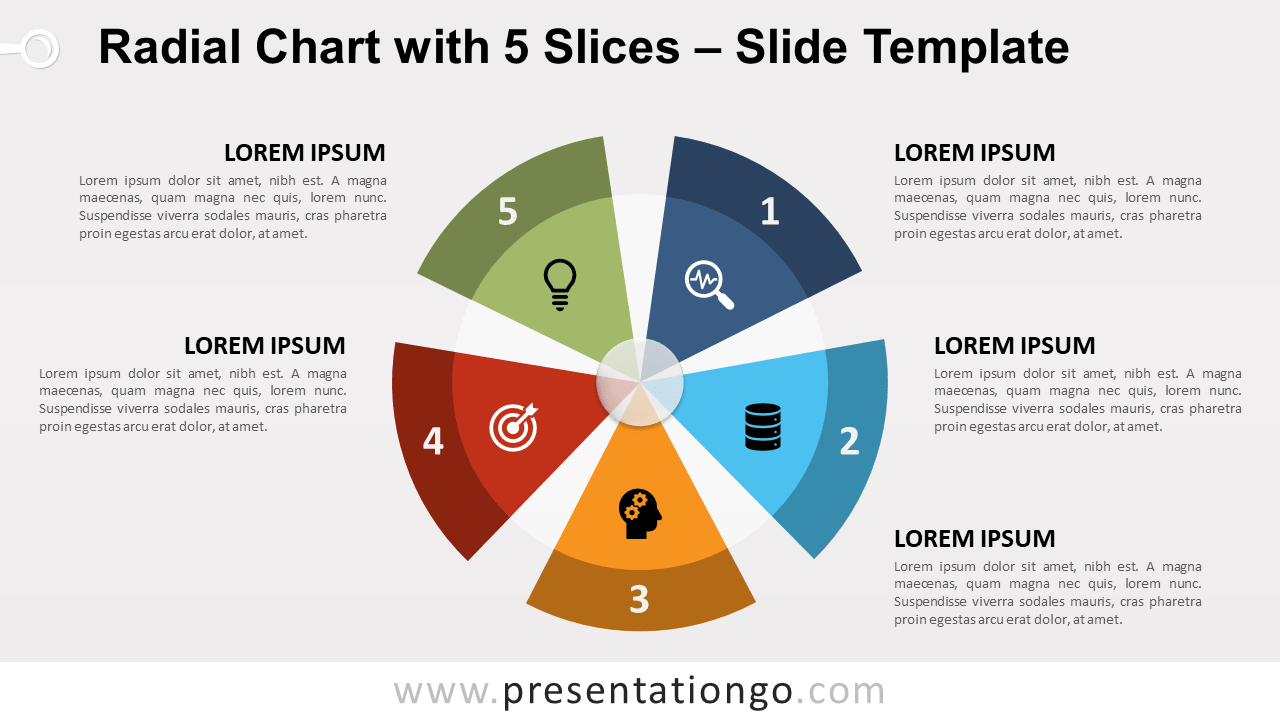
Free radial chart with 5 slices for PowerPoint and Google Slides. Circle chart with 5 equal slices and empty spaces in-between. Editable graphics.
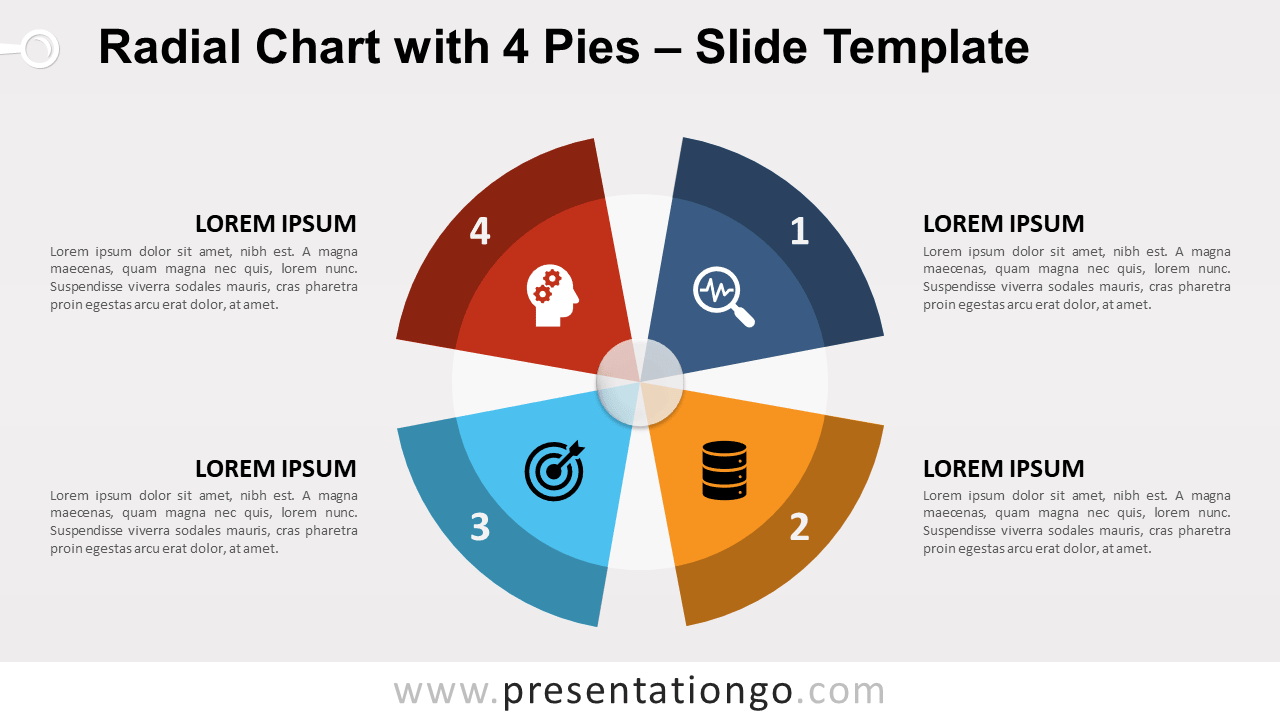
Free radial chart with 4 slices for PowerPoint and Google Slides. Circle chart with 4 equal slices and empty spaces in-between. Editable graphics.
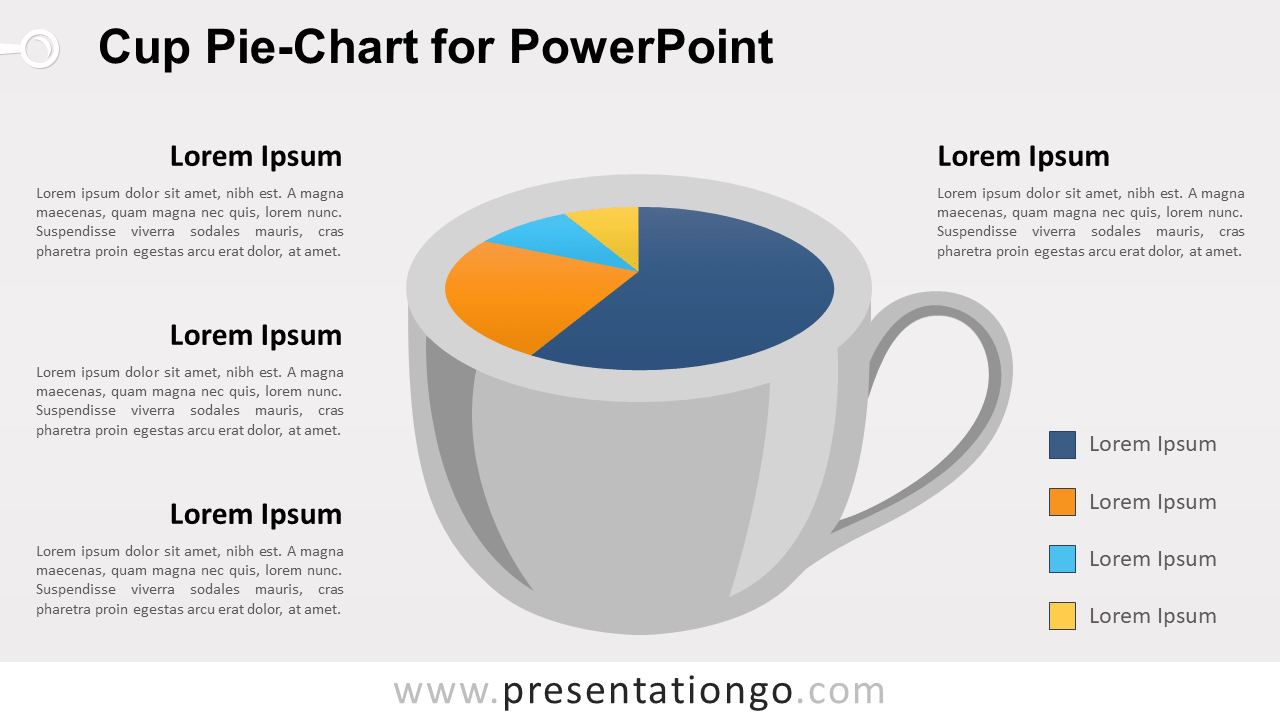
Free cup chart for PowerPoint. Coffee cup illustration with data-driven 3-D pie chart. To illustrate quantitative results about drinks, or about coffee.
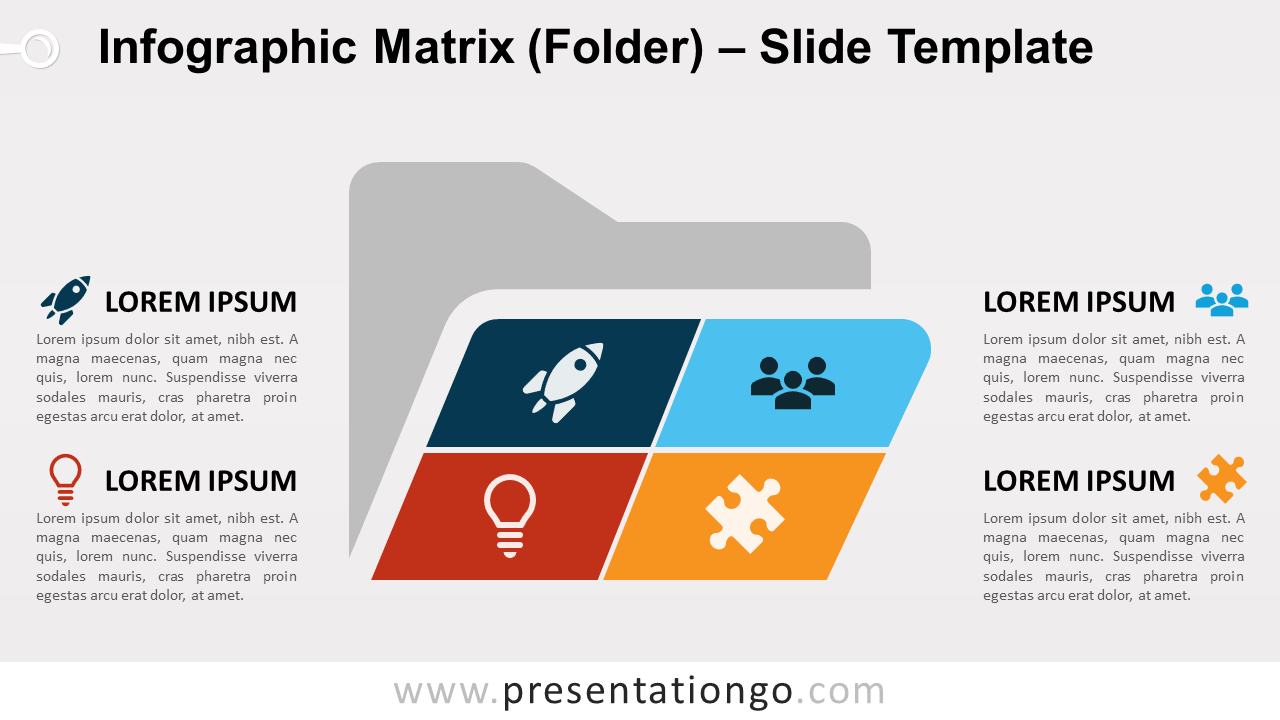
Free infographic matrix folder template for PowerPoint. Four-quadrant matrix diagram designed in an oversized open folder pictogram. Editable graphics.
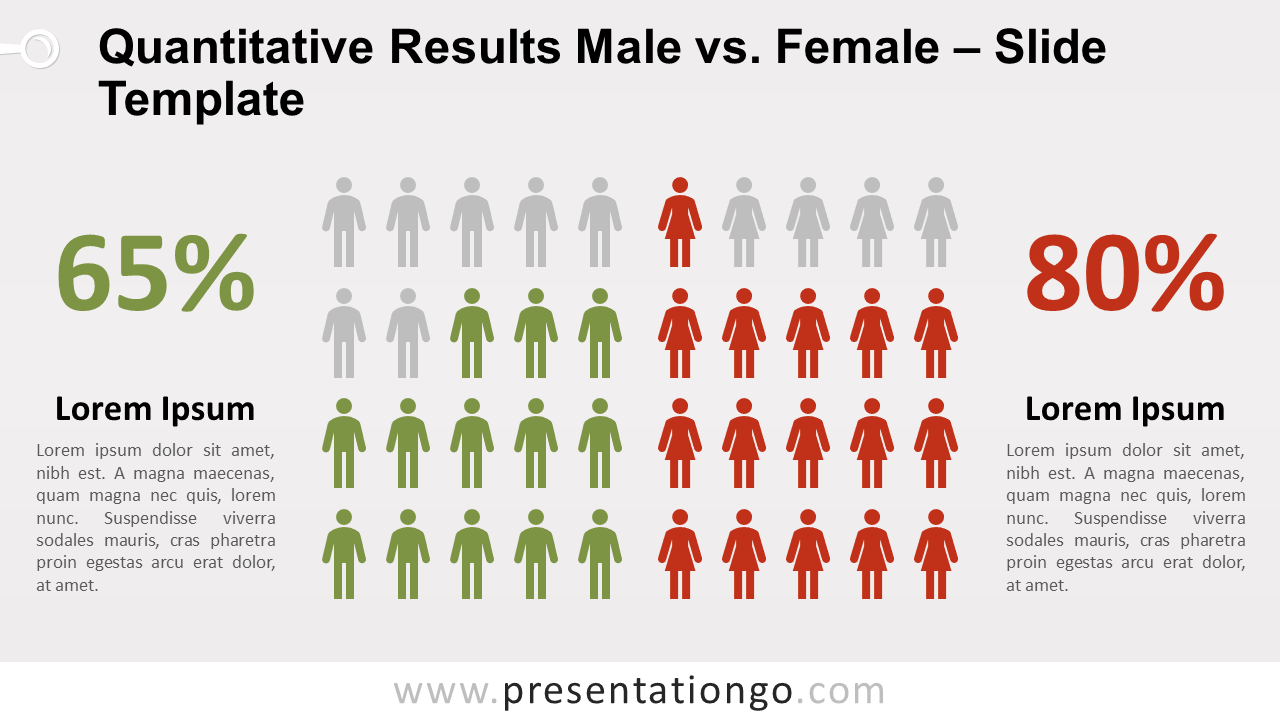
Free male vs female template for PowerPoint and Google Slides. Infographic slide template w male and female pictograms to show fractions of each population.
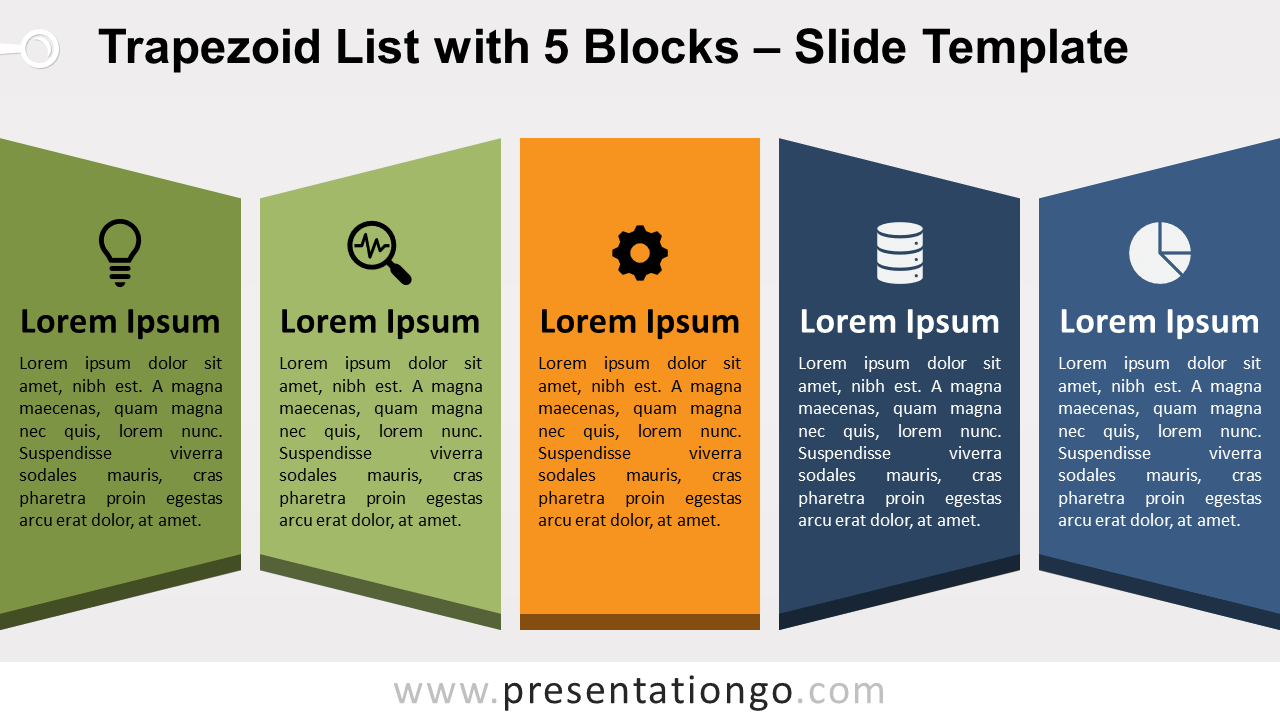
Free trapezoid list with 5 blocks for PowerPoint and Google Slides. 5-panel accordion fold paper with 4 isosceles trapezoid shapes and a central rectangle.
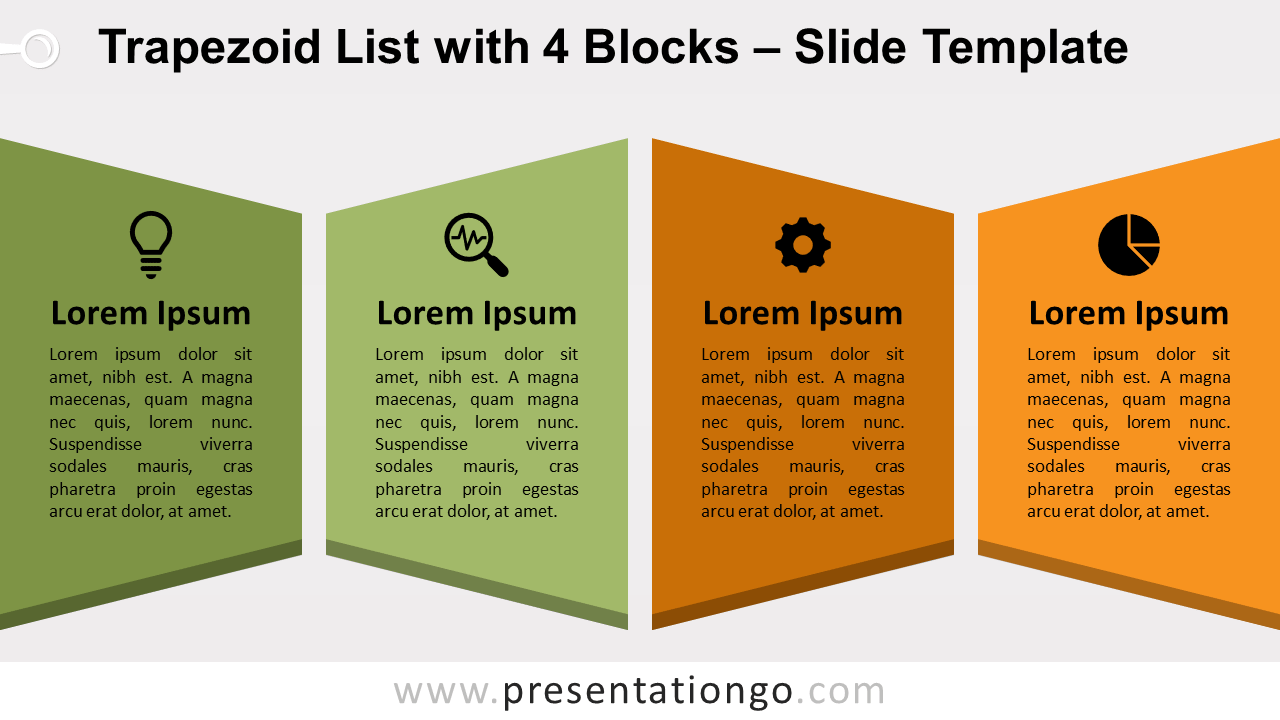
Free trapezoid list with 4 blocks for PowerPoint and Google Slides. 4-panel accordion fold made with isosceles trapezoid shapes. Editable graphics.
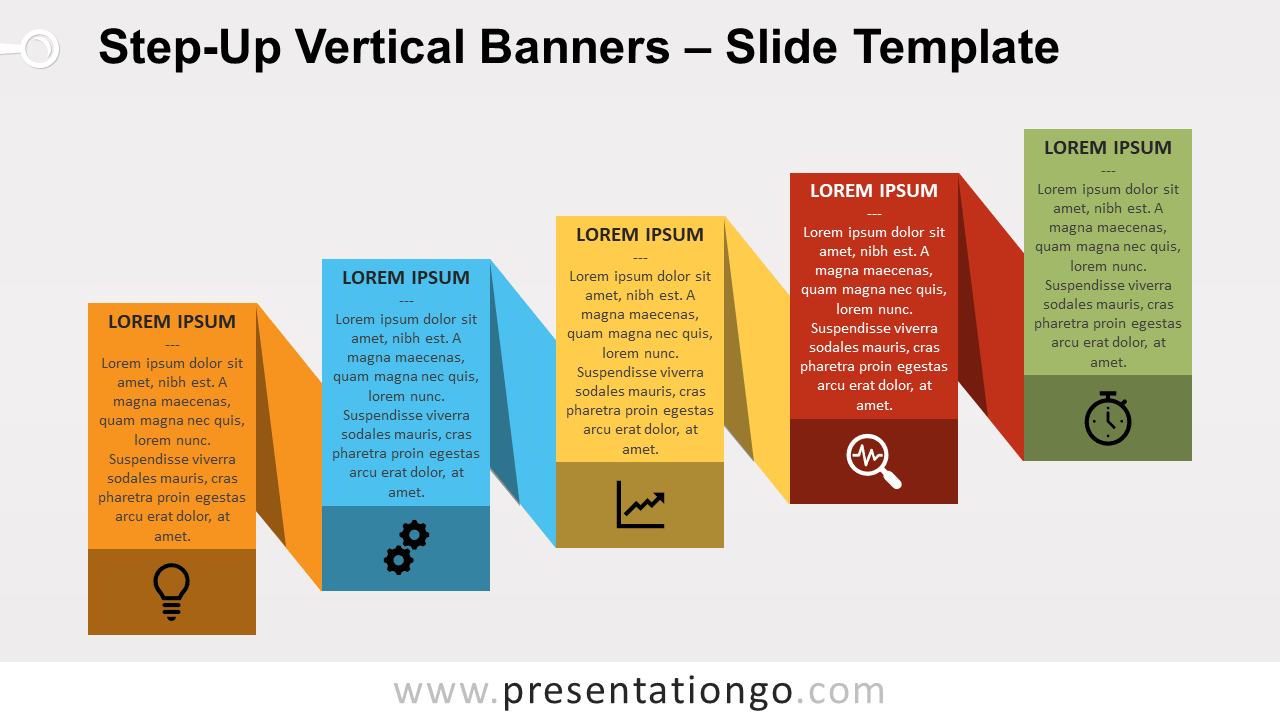
Free step-up vertical banners for PowerPoint and Google Slides. Ascending process diagram with 5 folded banners. Editable graphics.
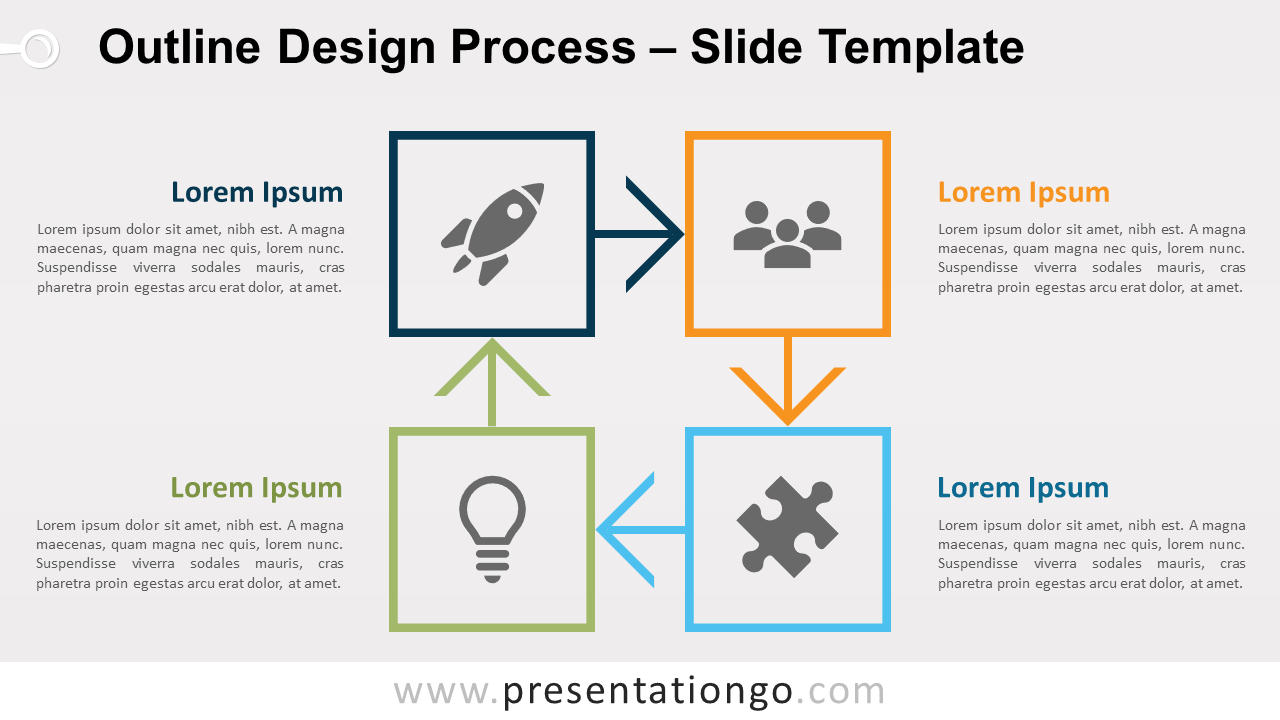
Free outline design process for PowerPoint and Google Slides. Continuous process made with 4 square outline shapes, and arrows. Editable graphics.
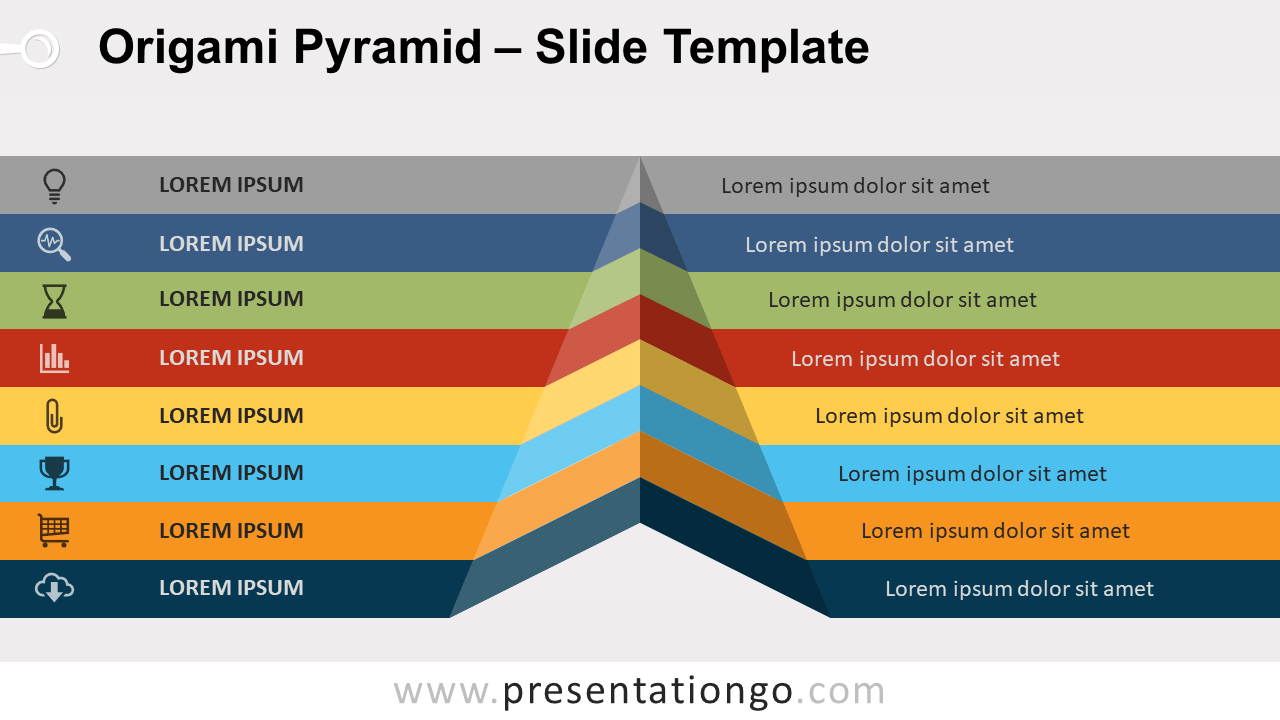
Free origami pyramid for PowerPoint and Google Slides. Illustration of a lying pyramid made with 8 folded paper banners. Editable graphics.
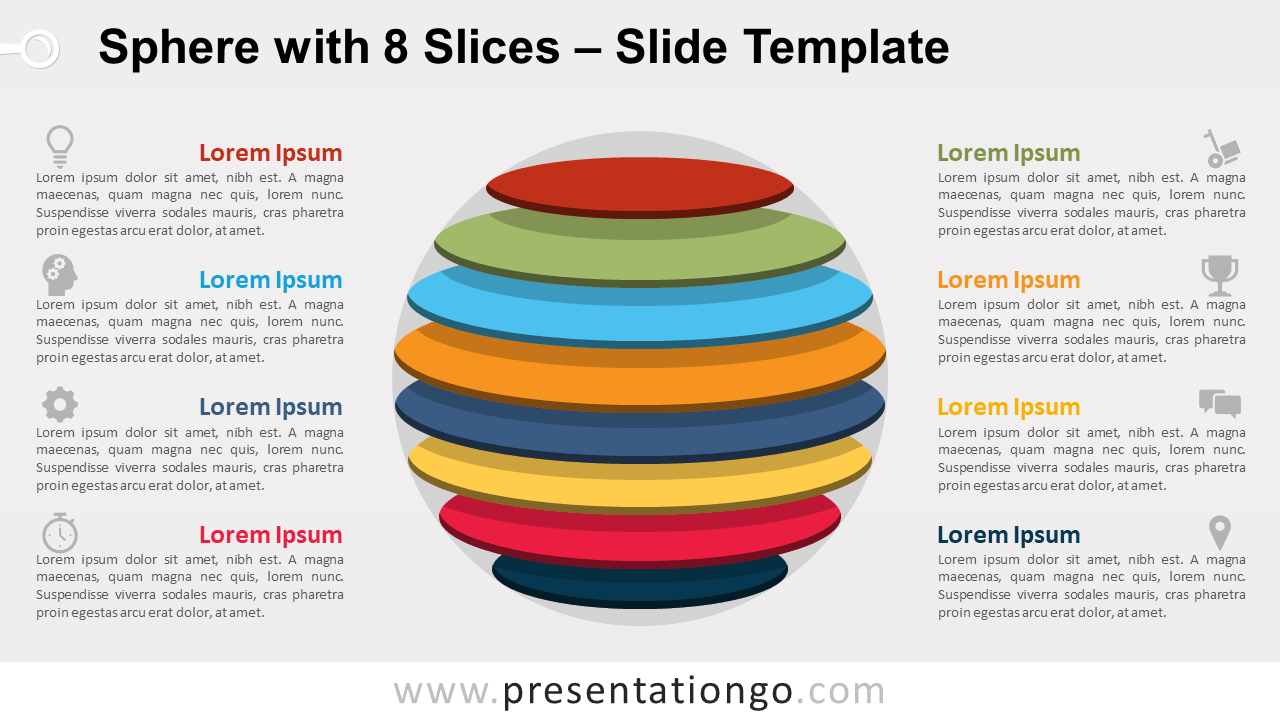
Free sphere with 8 slices for PowerPoint and Google Slides. Sphere or globe cut-up into 8 horizontal colorful section slices or layers. Editable graphics.
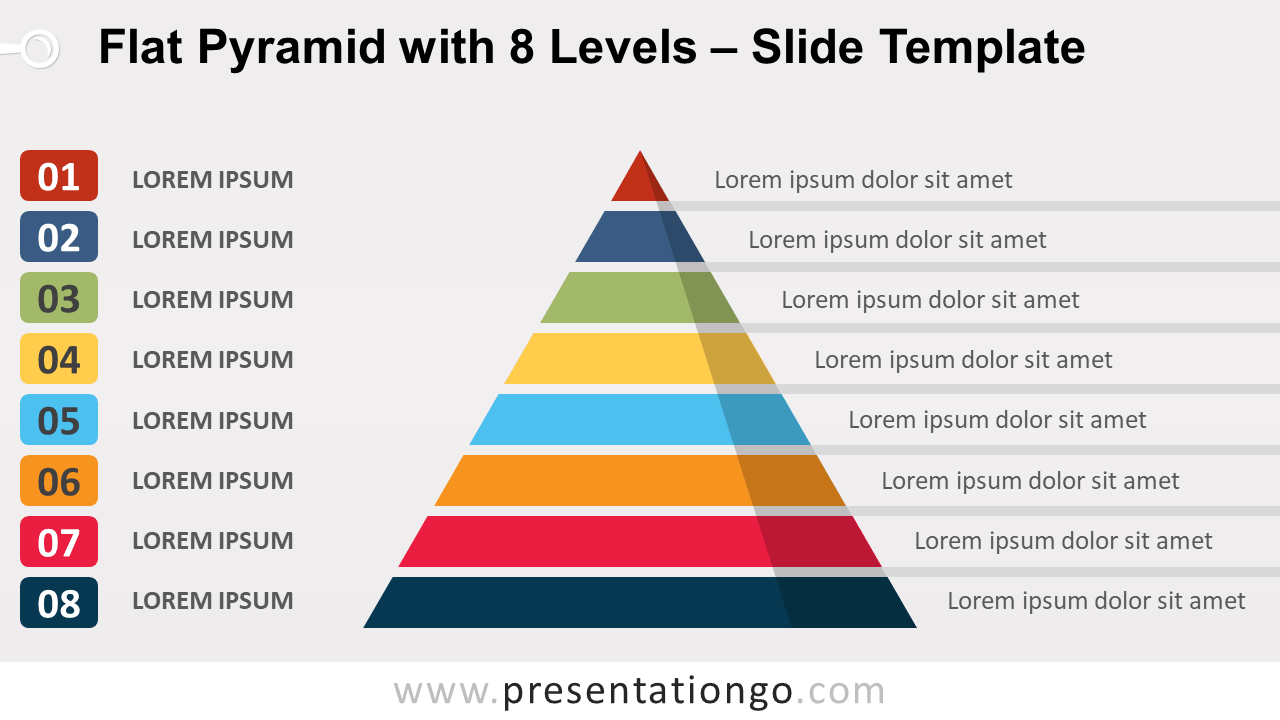
Free flat pyramid with 8 levels for PowerPoint and Google Slides. Flat design illustration of a basic pyramid made with 8 banners. Editable graphics.
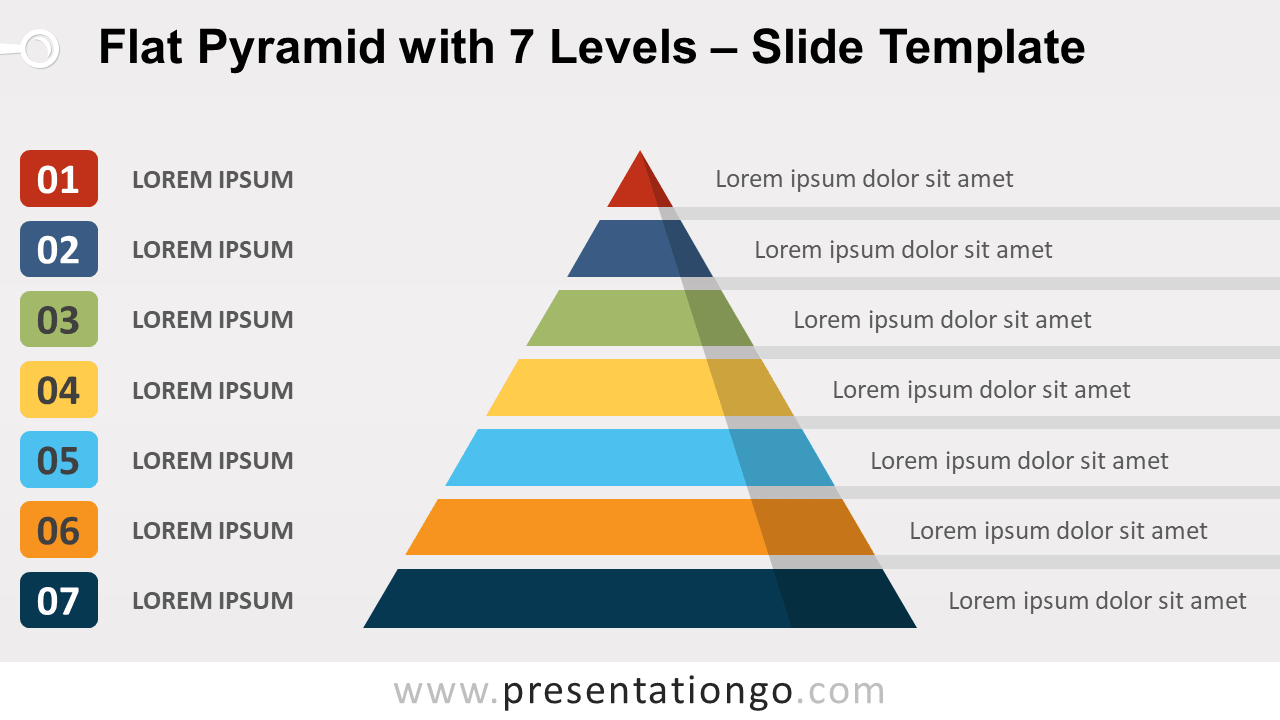
Free flat pyramid with 7 levels for PowerPoint and Google Slides. Flat design illustration of a basic pyramid made with 7 banners. Editable graphics.