Loading resources…
Total 1760 resources
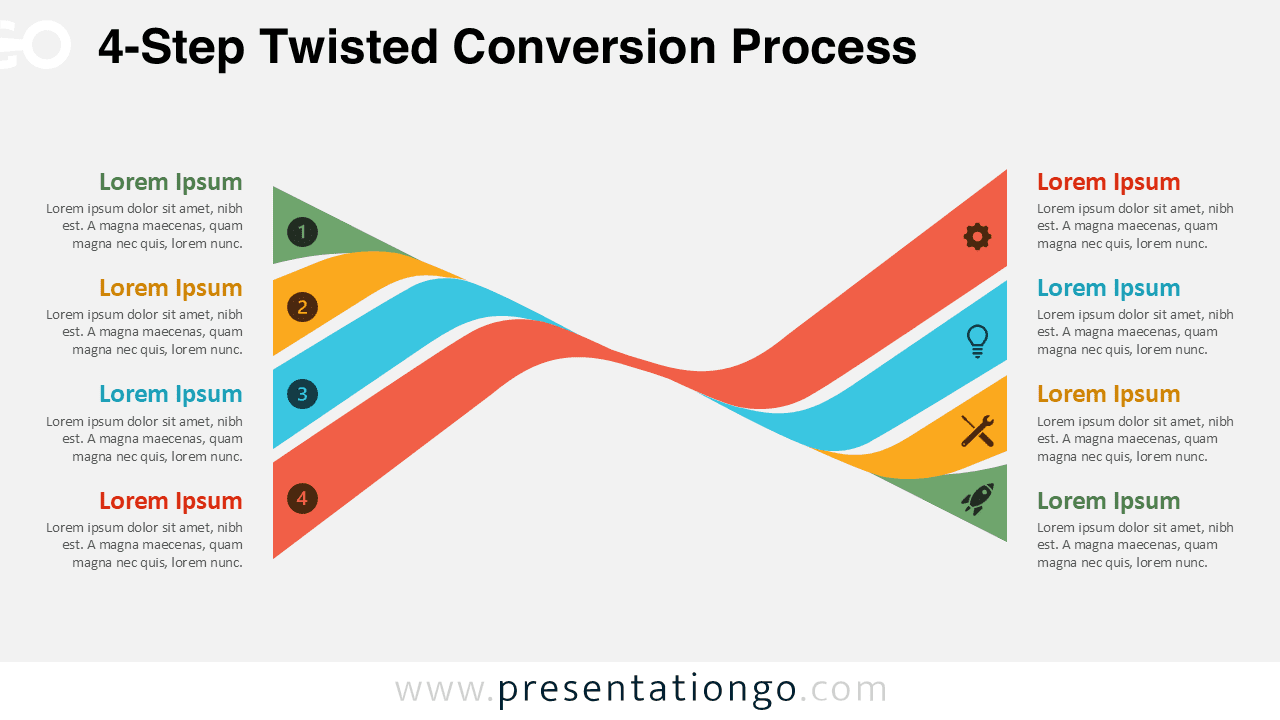
Use the 4-Step Twisted Conversion Process diagram in PowerPoint and Google Slides to explain four conversion phases with a modern flowing layout.
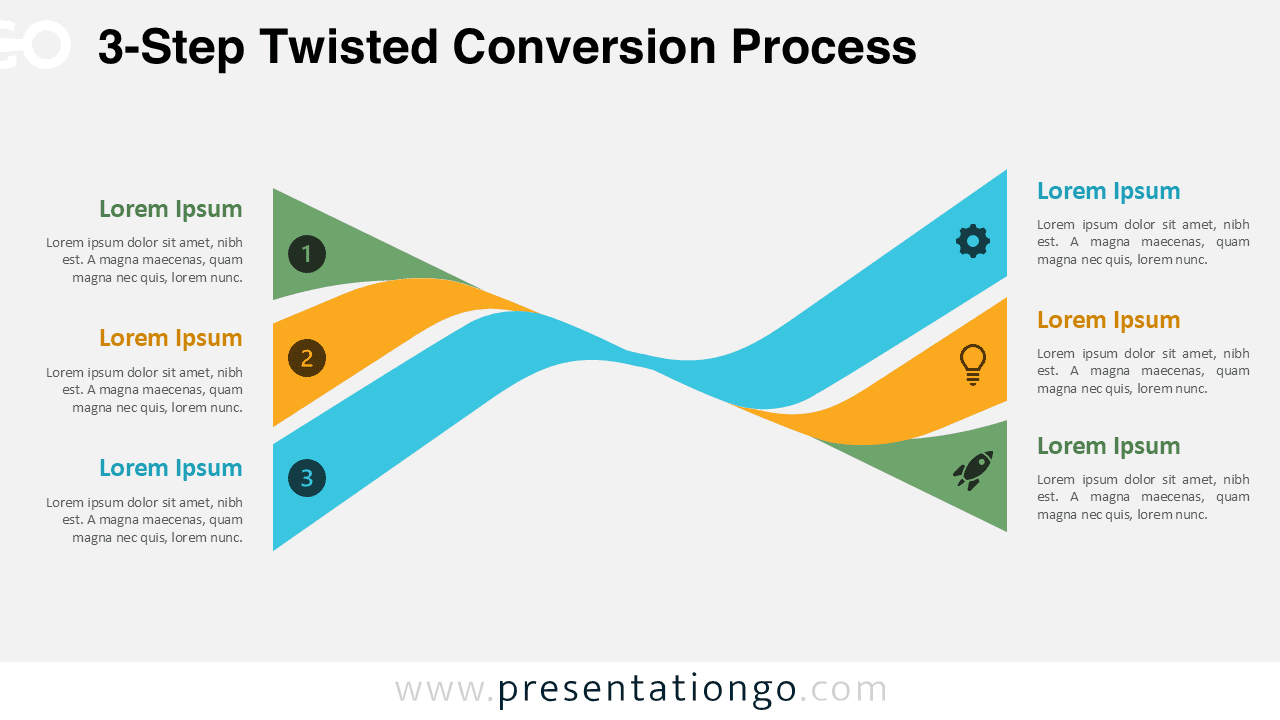
Download the 3-Step Twisted Conversion Process diagram for PowerPoint and Google Slides. Show three conversion stages with editable text and icons.
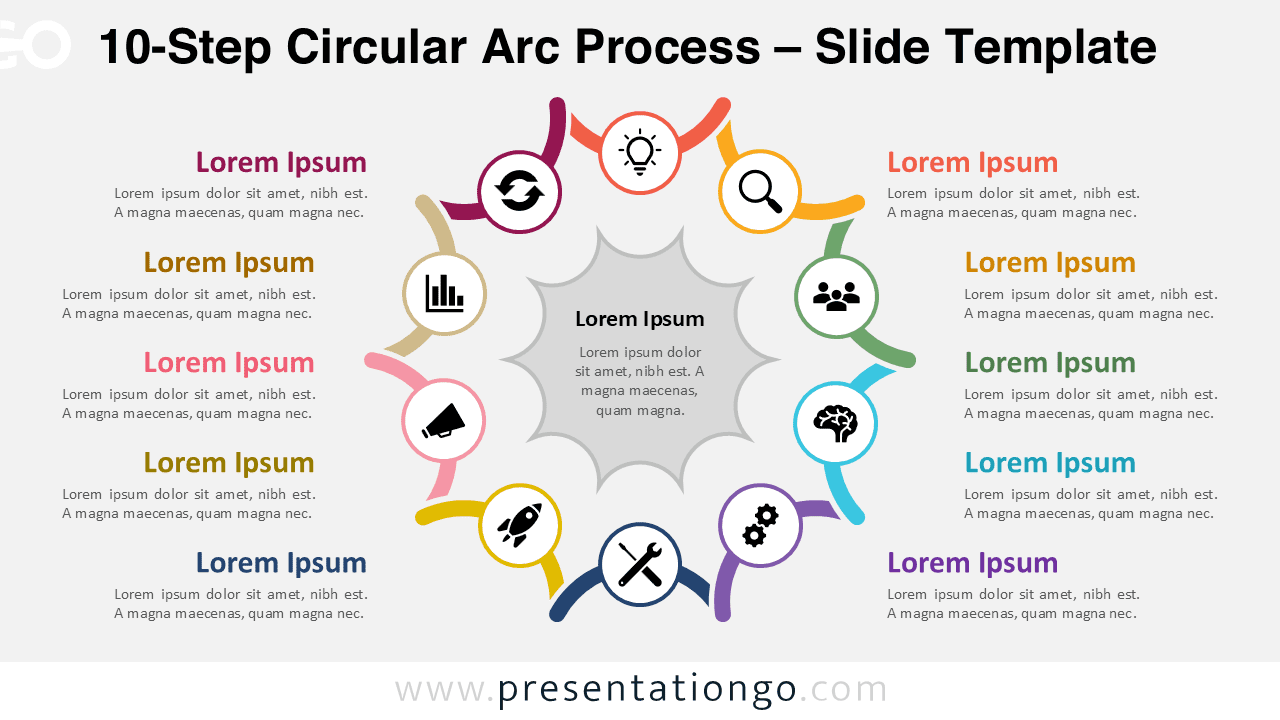
Present detailed workflows with this 10-step circular arc diagram for PowerPoint and Google Slides. Fully editable and easy to customize.
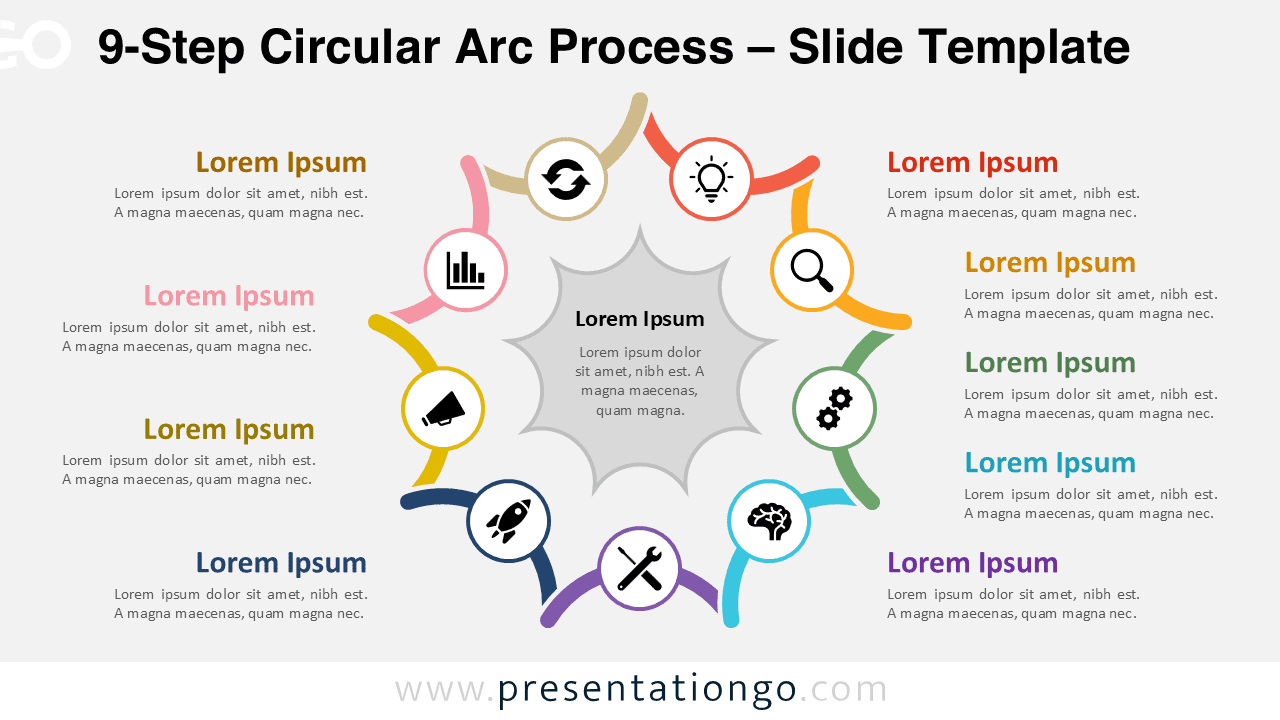
Download this 9-step circular arc process diagram for PowerPoint and Google Slides. Ideal for complex workflows, cycles, and strategies.
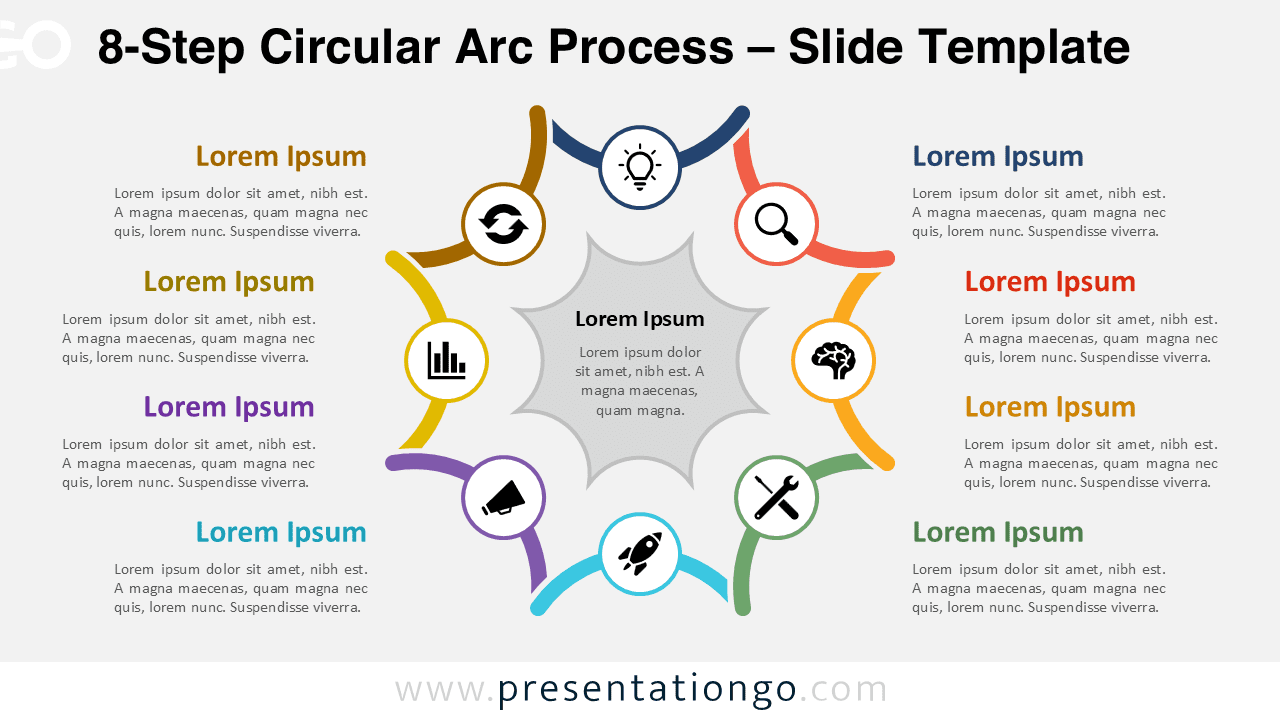
Visualize complex workflows with this 8-step circular arc diagram for PowerPoint and Google Slides. Fully editable and easy to customize.
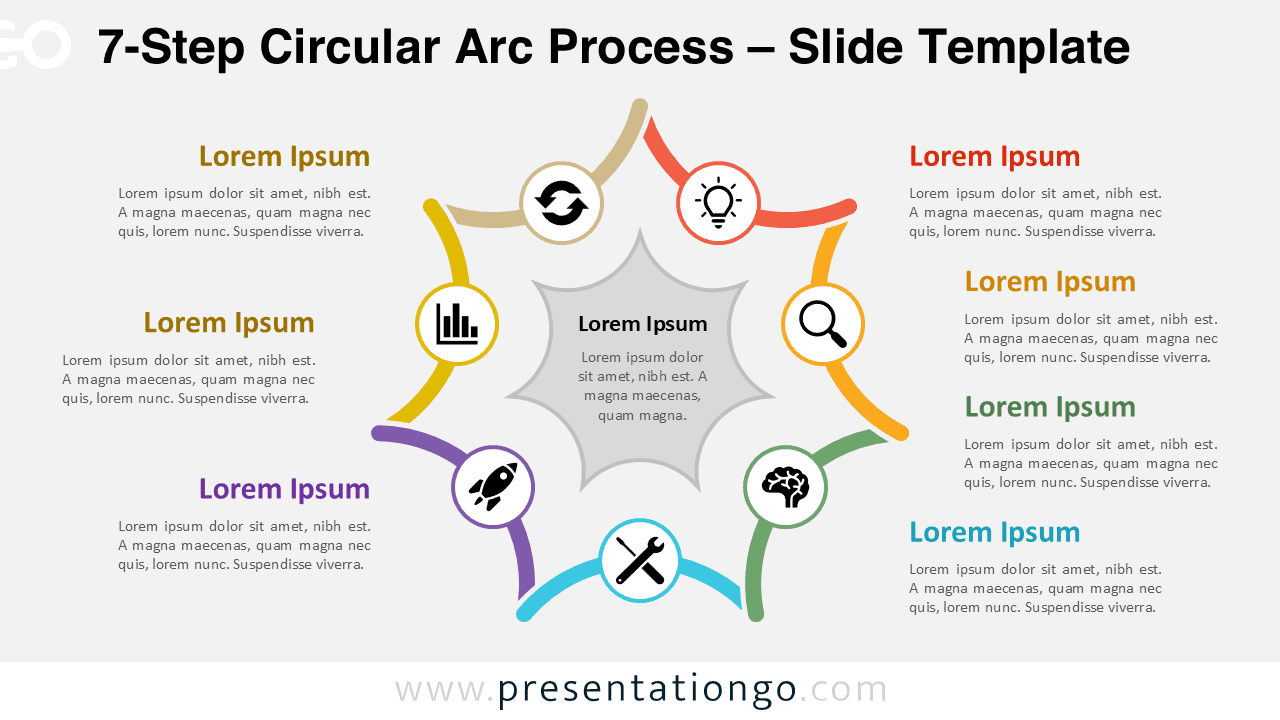
Download this 7-step circular arc process diagram for PowerPoint and Google Slides. Ideal for workflows, cycles, and structured strategies.
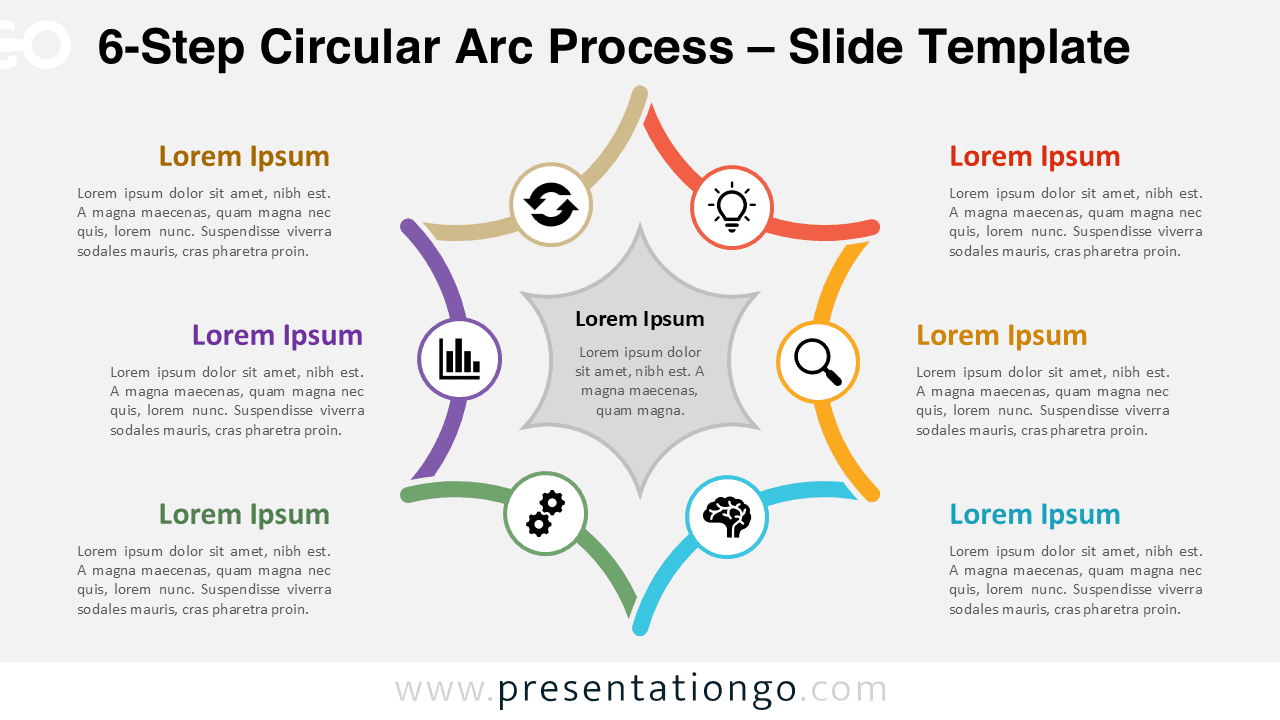
Present workflows clearly with this 6-step circular arc diagram for PowerPoint and Google Slides. Fully editable and easy to customize.
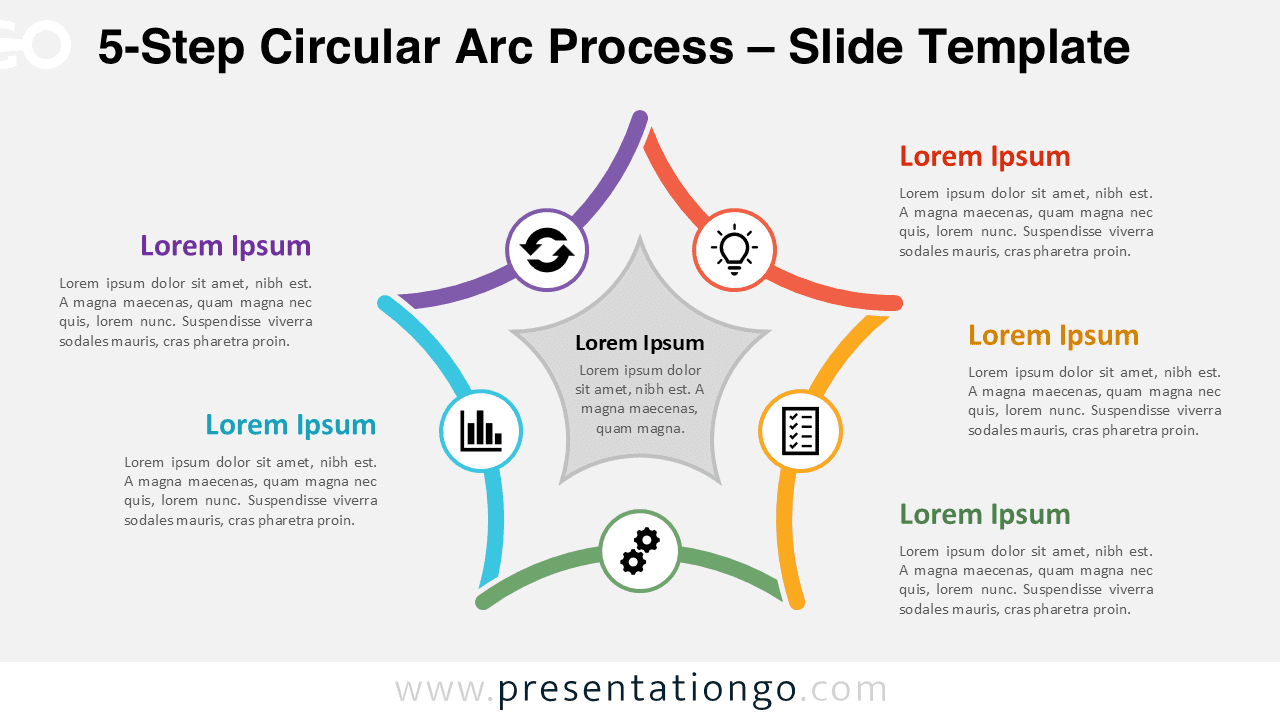
Download this 5-step circular arc process diagram for PowerPoint and Google Slides. Ideal for workflows, cycles, and business strategies.
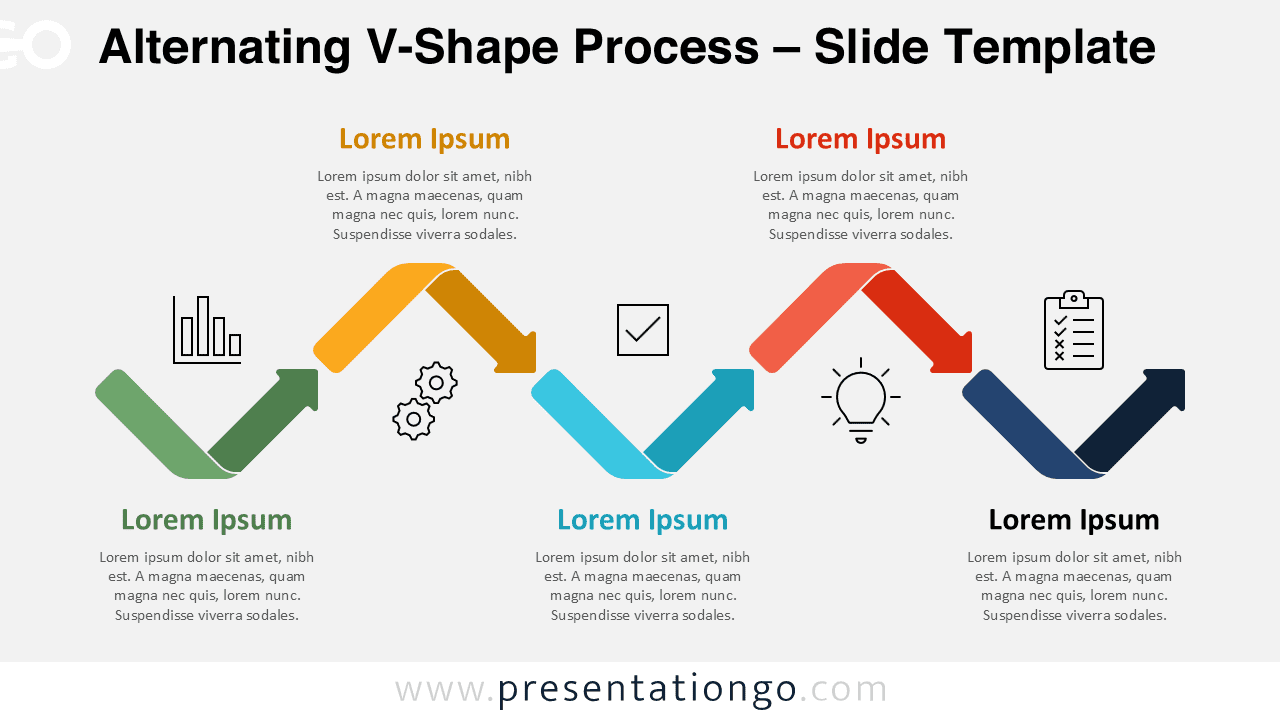
Download this alternating V-shape process diagram for PowerPoint and Google Slides. Fully editable and ideal for workflows and strategies.
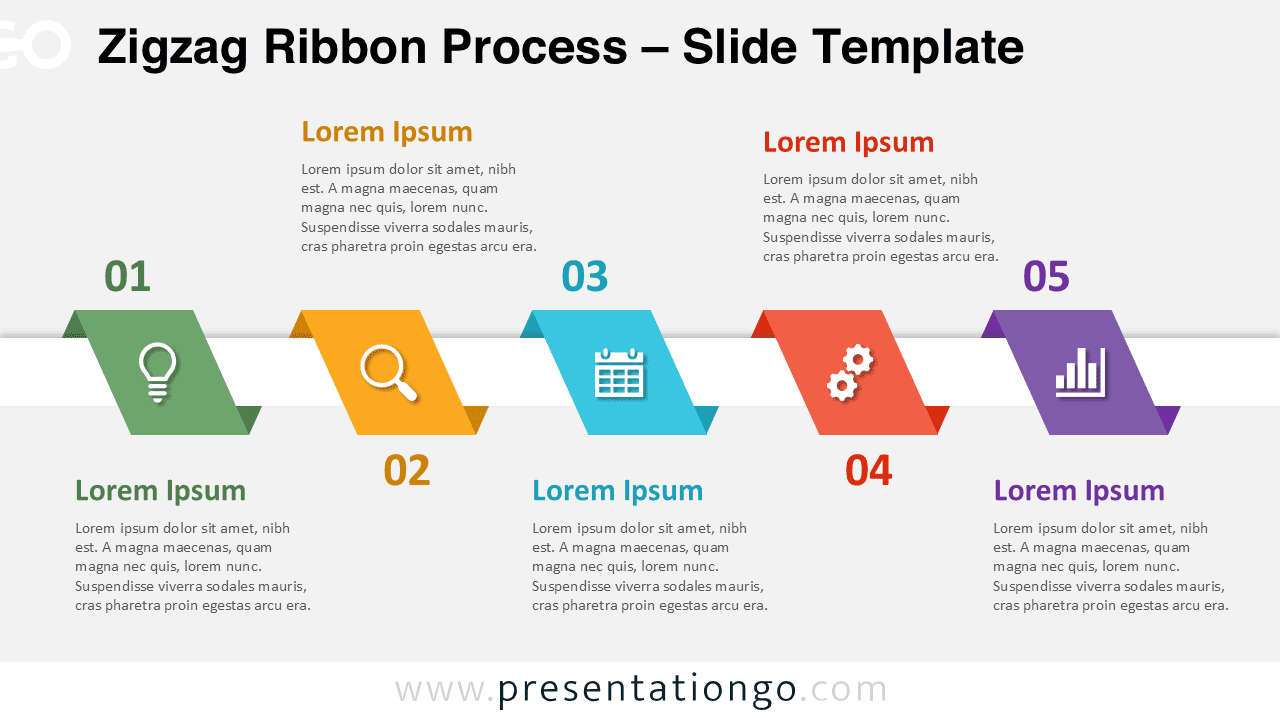
Download this zigzag ribbon process diagram for PowerPoint and Google Slides. Showcase 5-step workflows with colorful segments and editable icons.
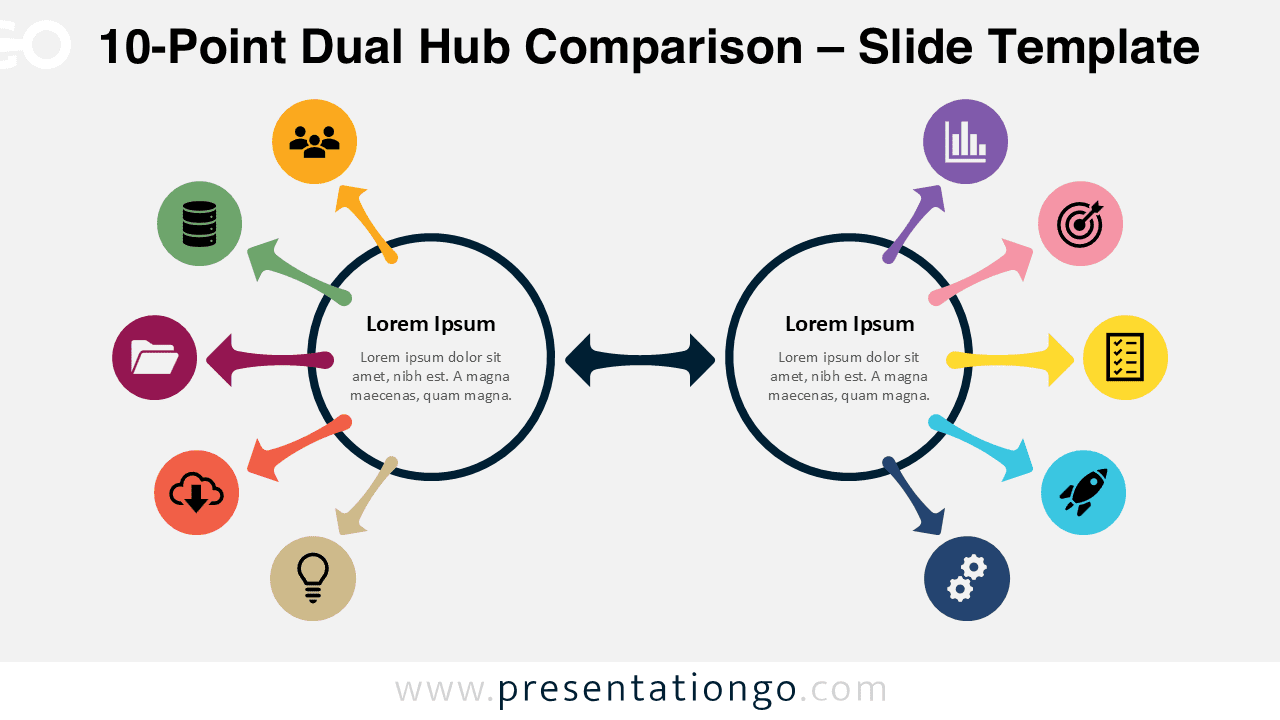
Download this 10-point dual hub comparison diagram for PowerPoint and Google Slides. Perfect for detailed analysis, workflows, and complex visual comparisons.
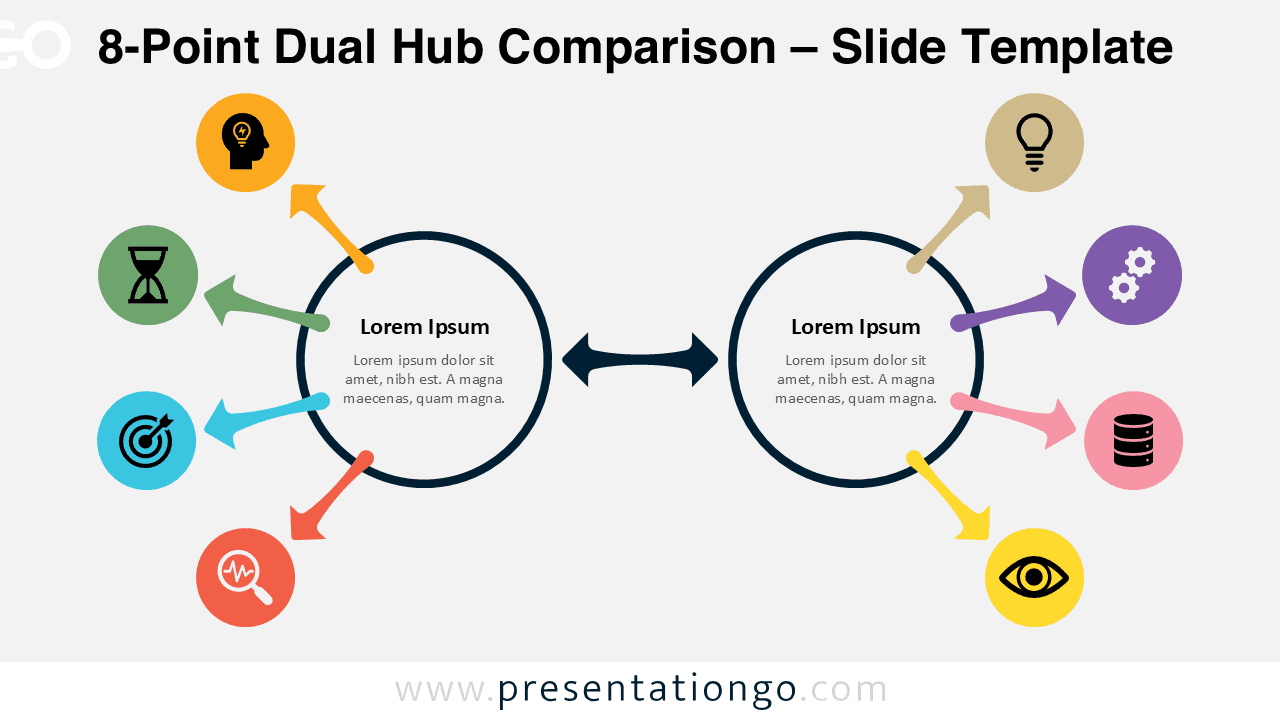
Download this 8-point dual hub comparison diagram for PowerPoint and Google Slides. Perfect for structured analysis, workflows, and visual comparisons.
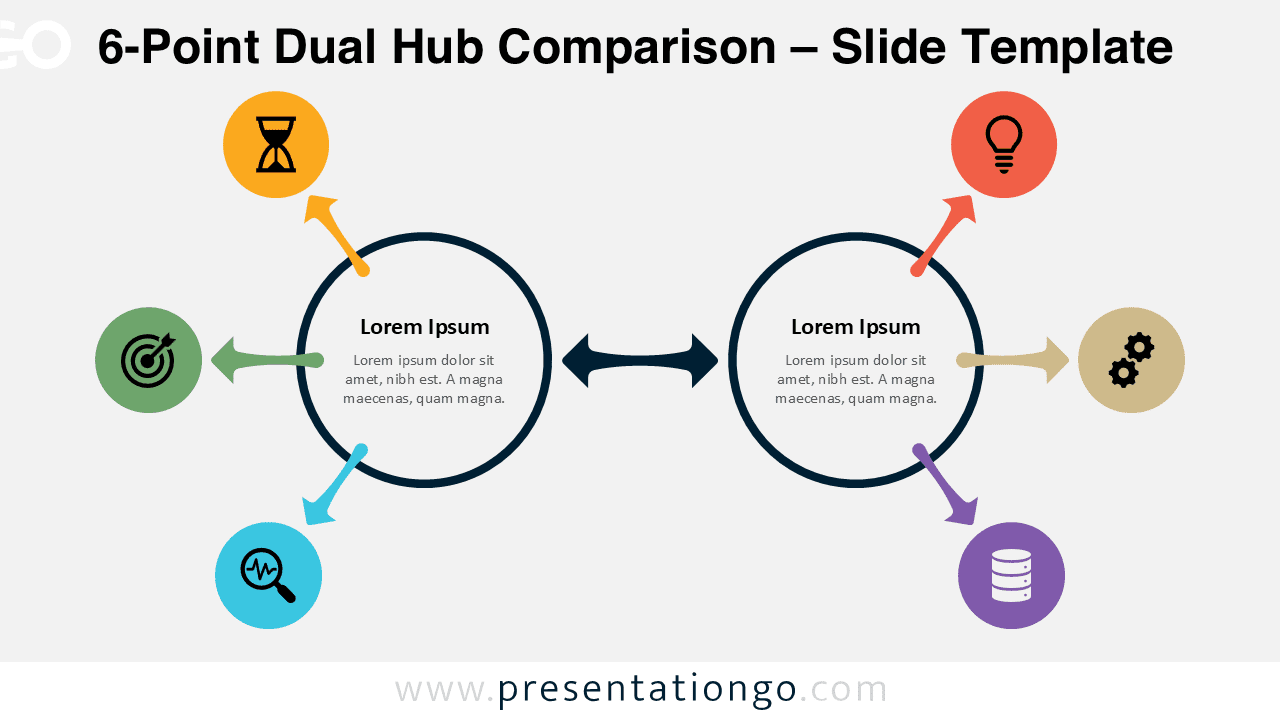
Download this 6-point dual hub comparison diagram for PowerPoint and Google Slides. Ideal for visualizing relationships, processes, and structured comparisons.
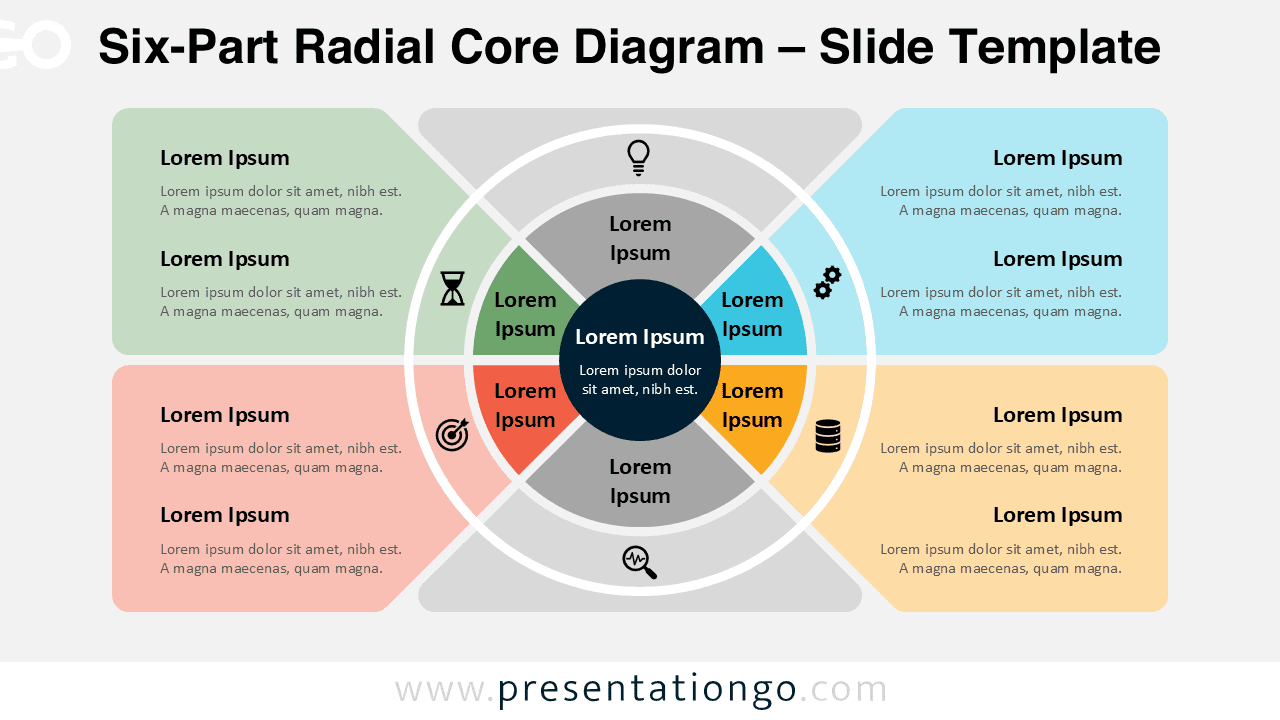
Download this six-part radial core diagram for PowerPoint and Google Slides. Ideal for complex frameworks and multi-step processes.
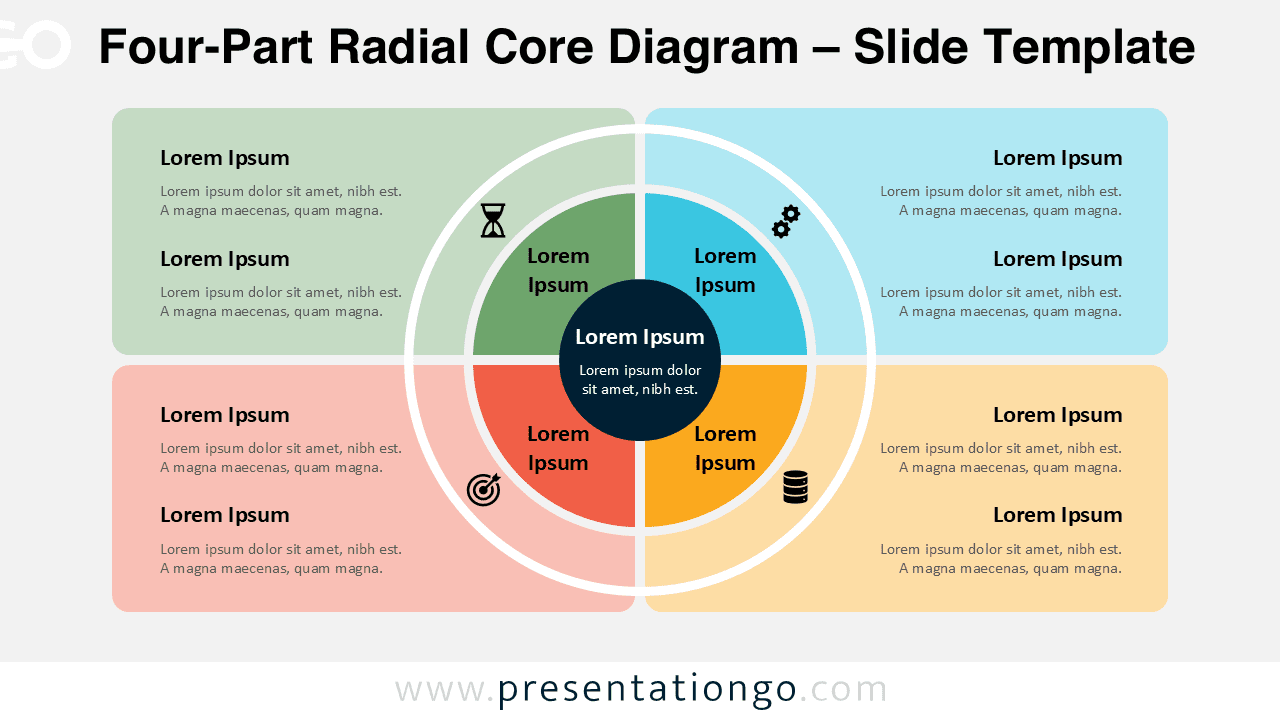
Download this four-part radial core diagram for PowerPoint and Google Slides. Clean circular layout with editable segments and icons for business use.
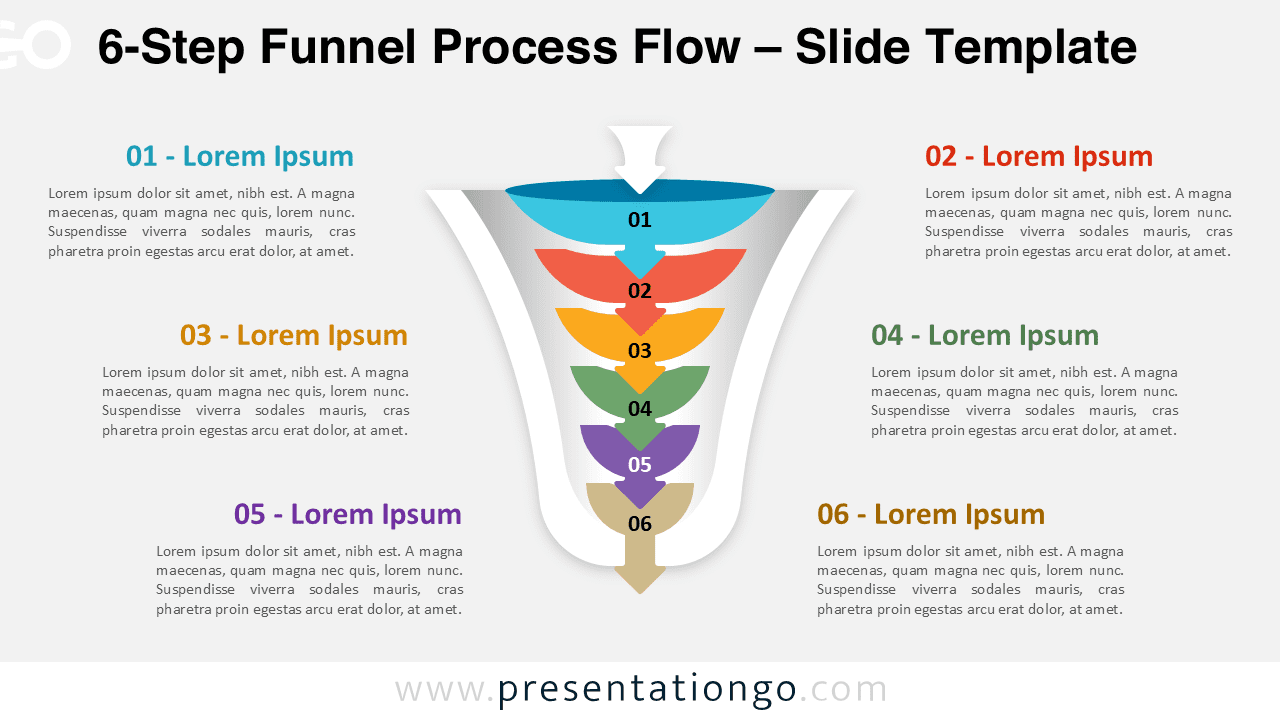
Download this 6-step funnel process flow diagram for PowerPoint and Google Slides. Ideal for complex workflows and detailed multi-stage processes.
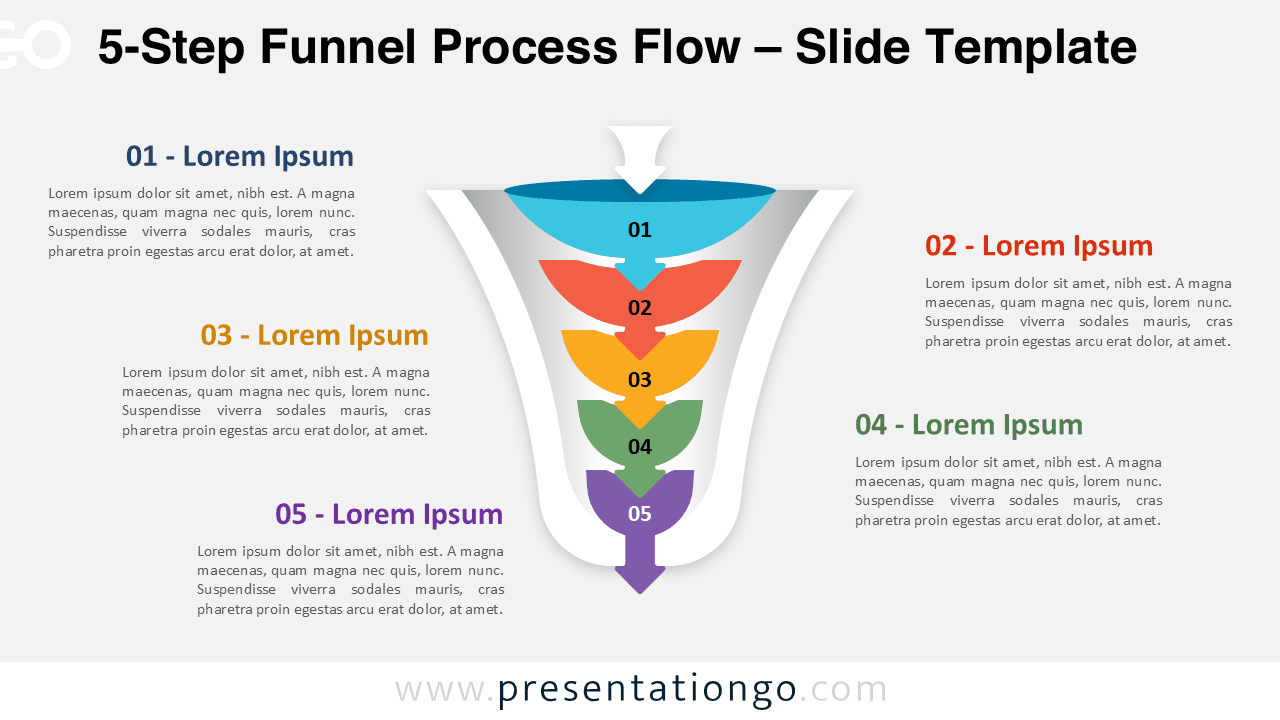
Visualize complex workflows with this 5-step funnel diagram for PowerPoint and Google Slides. Fully editable and ideal for strategy presentations.
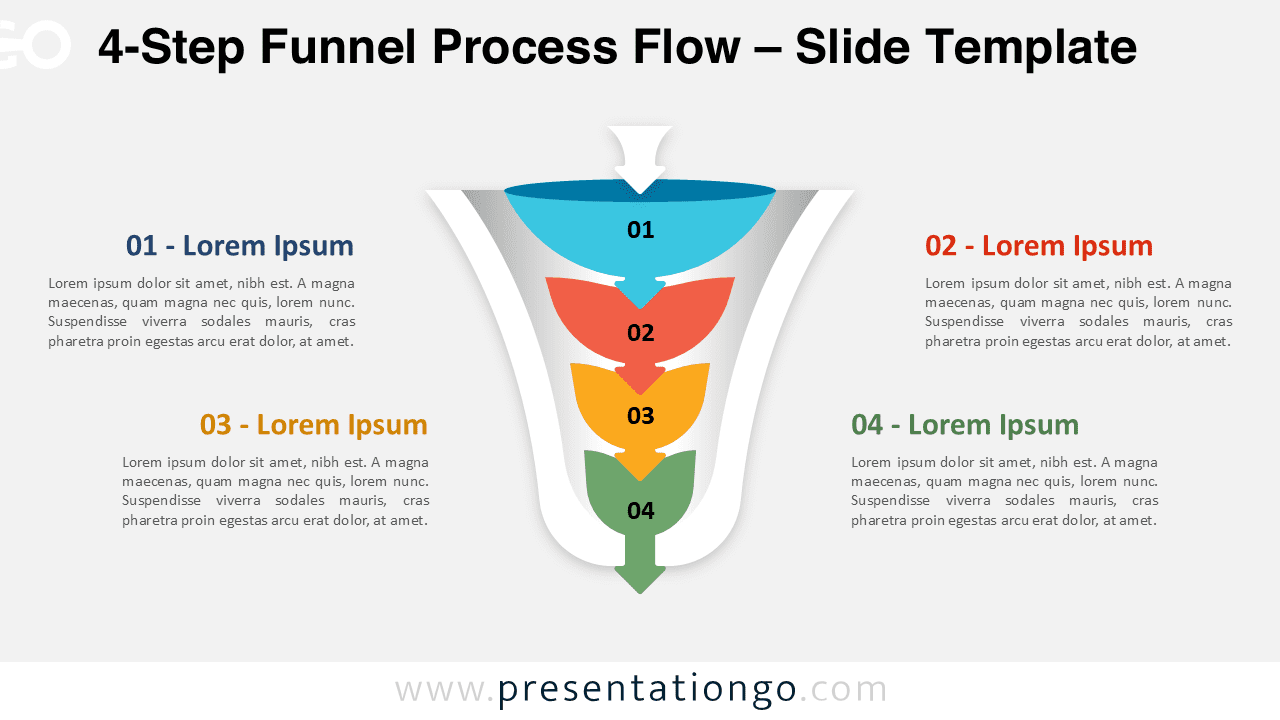
Showcase multi-stage processes with this 4-step funnel diagram for PowerPoint and Google Slides. Ideal for strategy, marketing, and project planning.
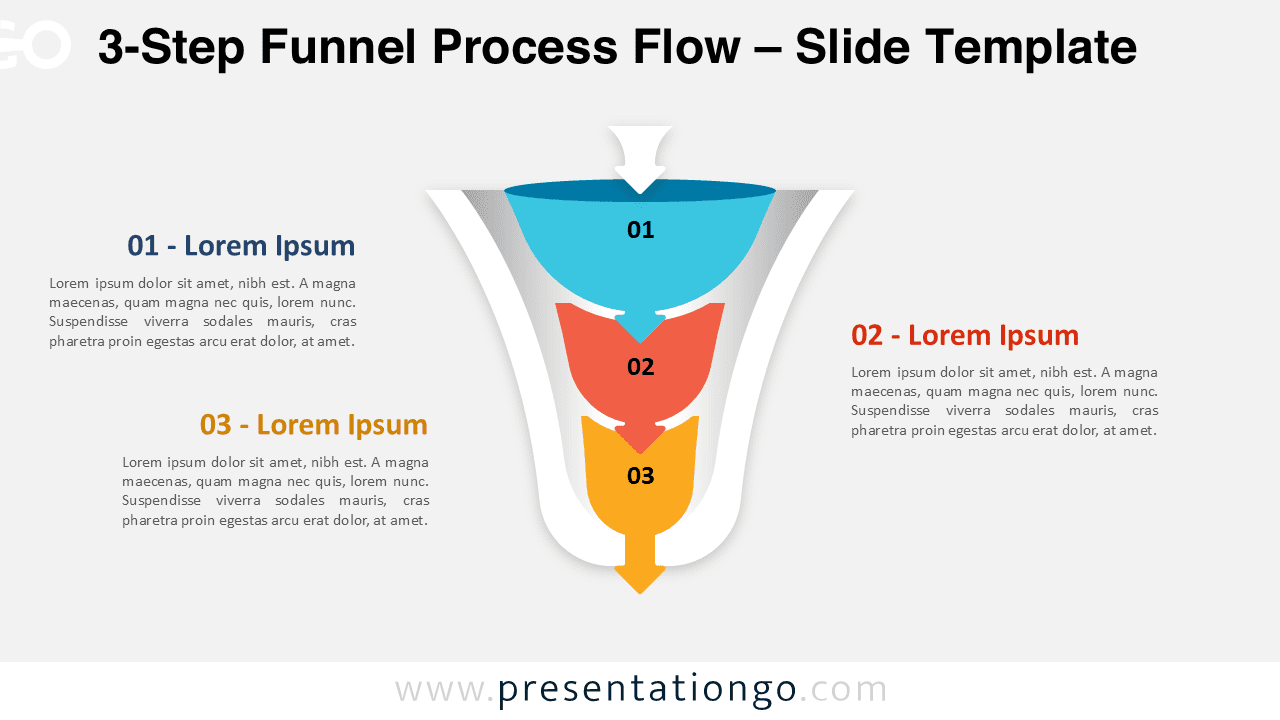
Download this 3-step funnel process flow diagram for PowerPoint and Google Slides. Ideal for visualizing simple workflows and conversion stages.
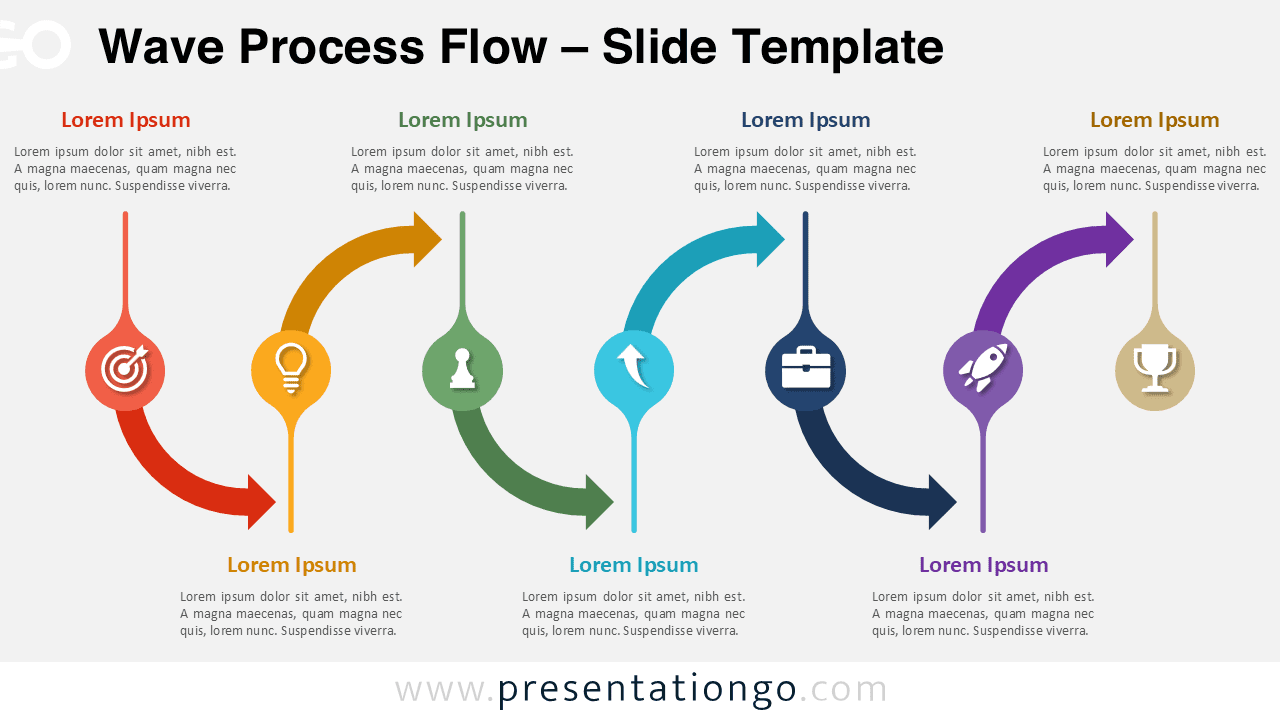
Download this Wave Process Flow diagram for PowerPoint and Google Slides. A modern curved workflow design with icons for clear step-by-step presentations.
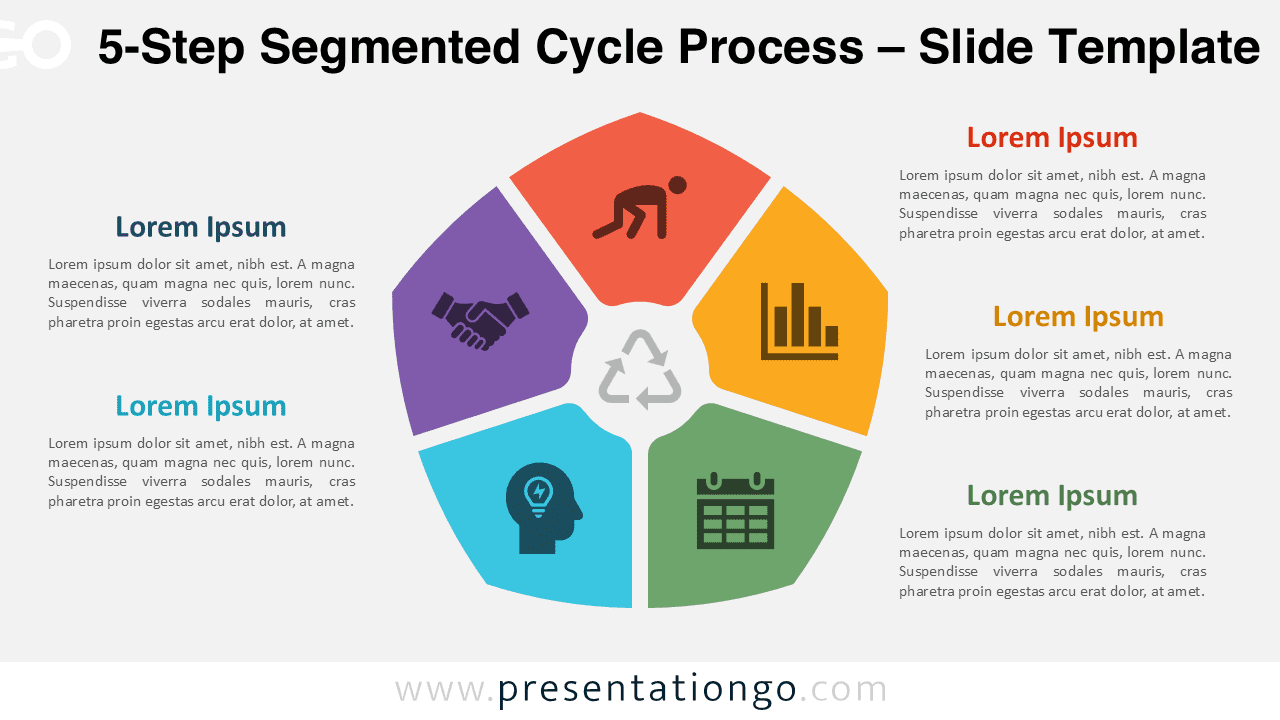
Download the 5-Step Segmented Cycle Process diagram for PowerPoint and Google Slides. Perfect for explaining workflows, strategies, and continuous improvement cycles.
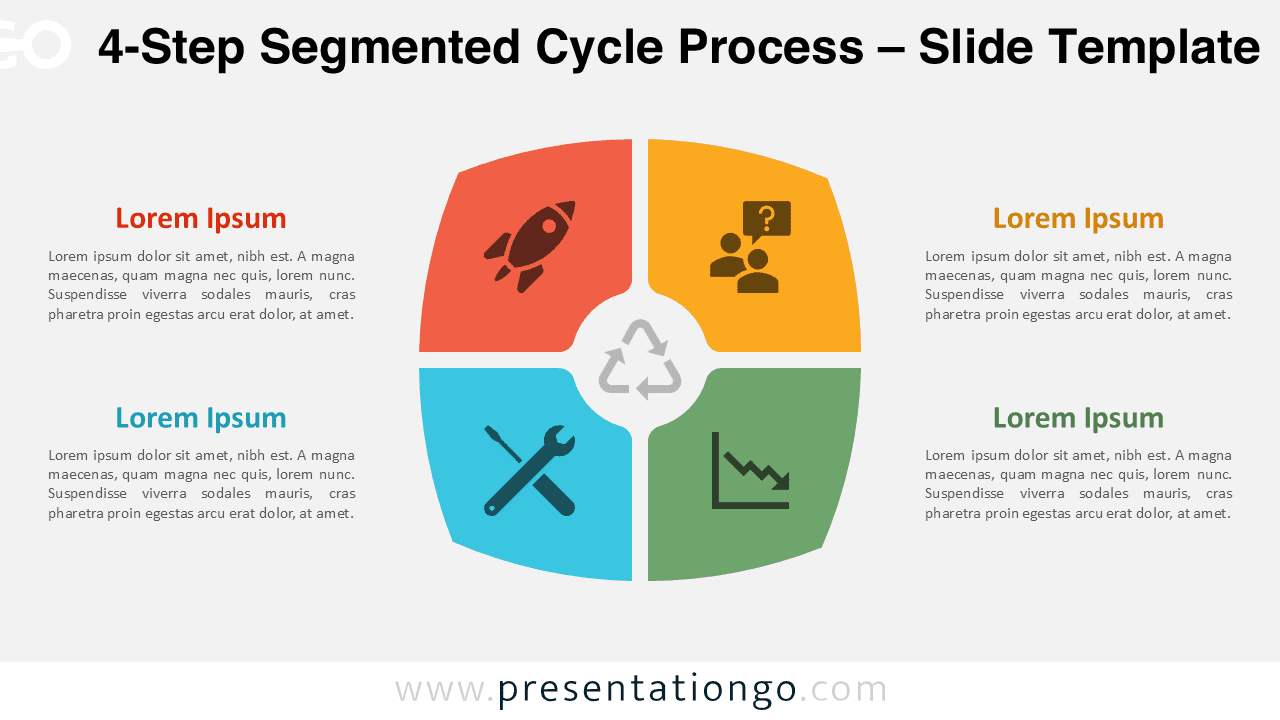
Free 4-step circular workflow diagram for PowerPoint and Google Slides. Ideal for business processes, project cycles, and strategy presentations.
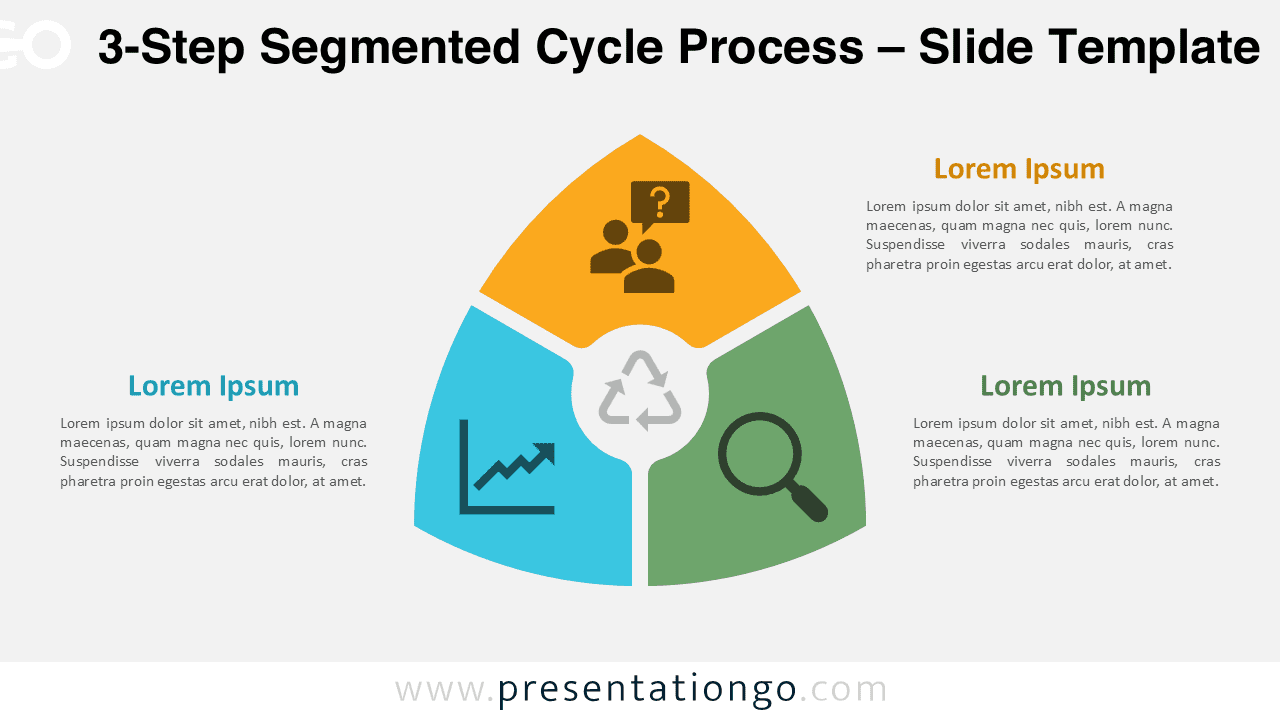
Download the 3-Step Segmented Cycle Process diagram for PowerPoint and Google Slides. Perfect for presenting workflows, strategies, and continuous improvement.
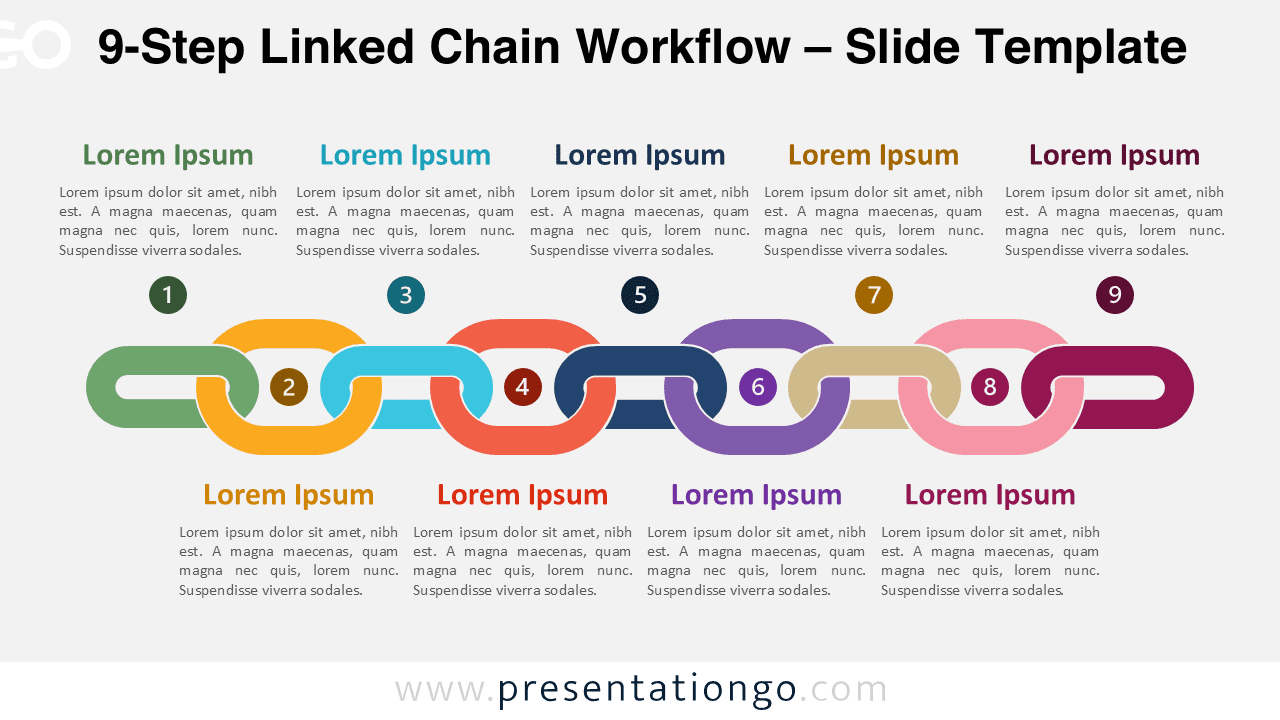
Download the 9-Step Linked Chain Workflow diagram for PowerPoint and Google Slides. Present complex workflows using a modern chain link infographic.