Loading resources…
Total 1760 resources
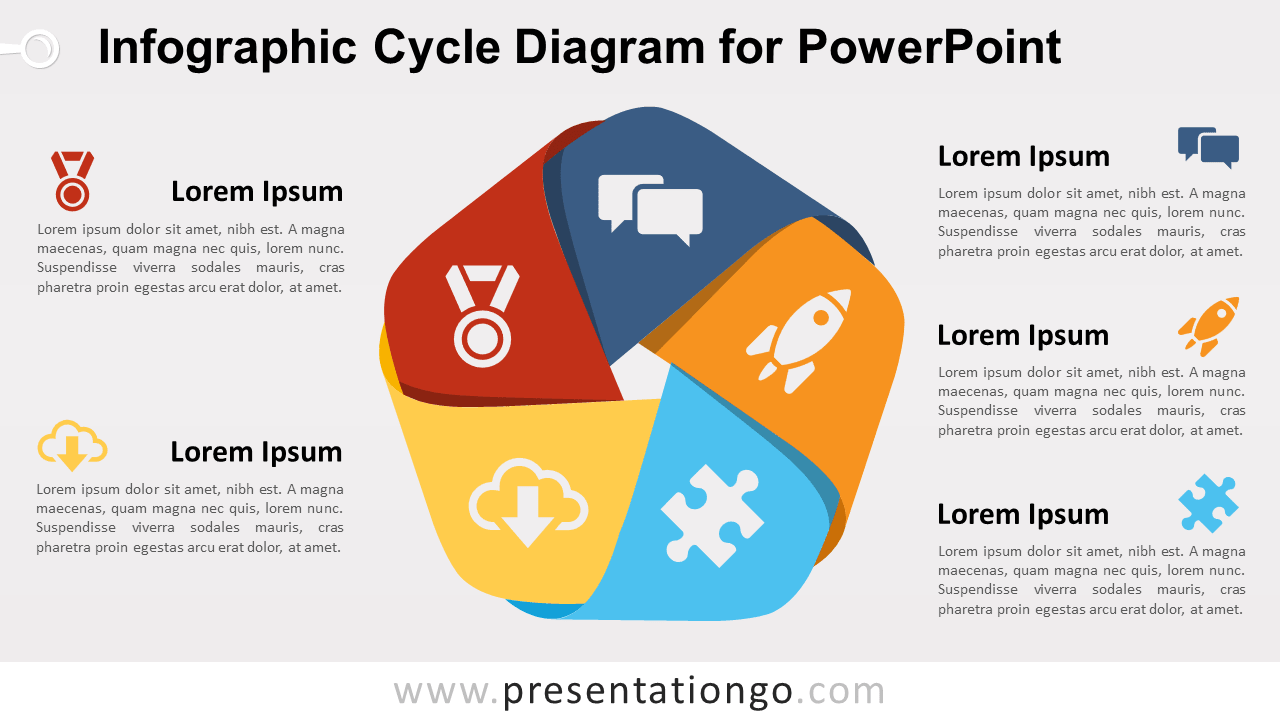
Free infographic cycle diagram for PowerPoint. Colorful cycle design with 5 stages, looking like braided strips. Editable graphics with text placeholder.
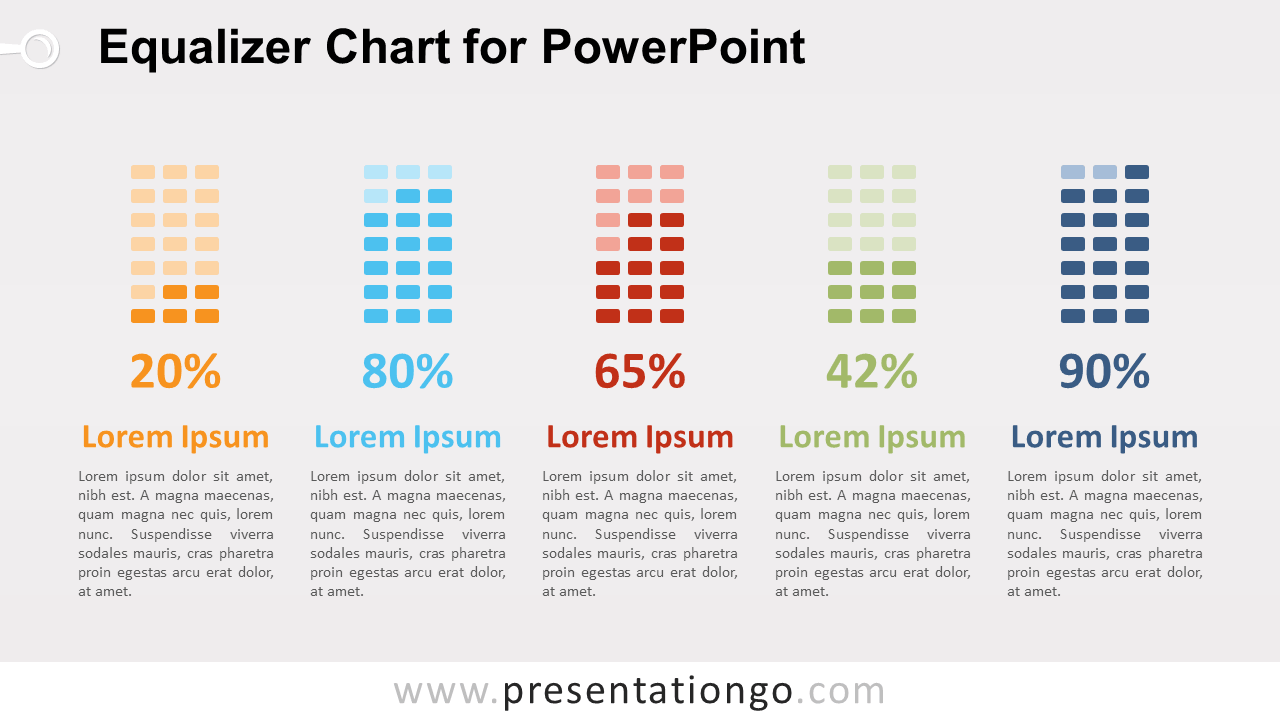
Free equalizer chart for PowerPoint with 5 vertical level indicators. Editable graphics with text placeholder. Use this diagram to compare quantitative data
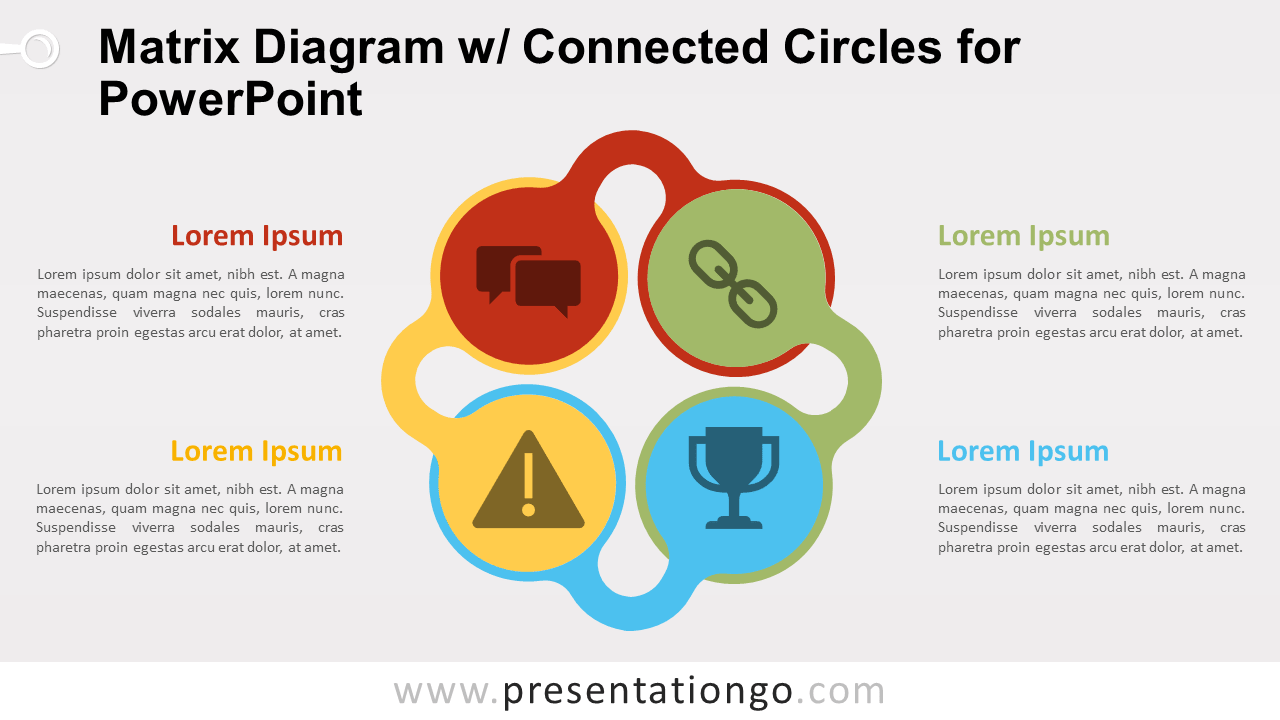
Free matrix diagram with connected circles for PowerPoint. Colorful design with 4 circular shapes, or 4 stages. Editable graphics with text placeholder.
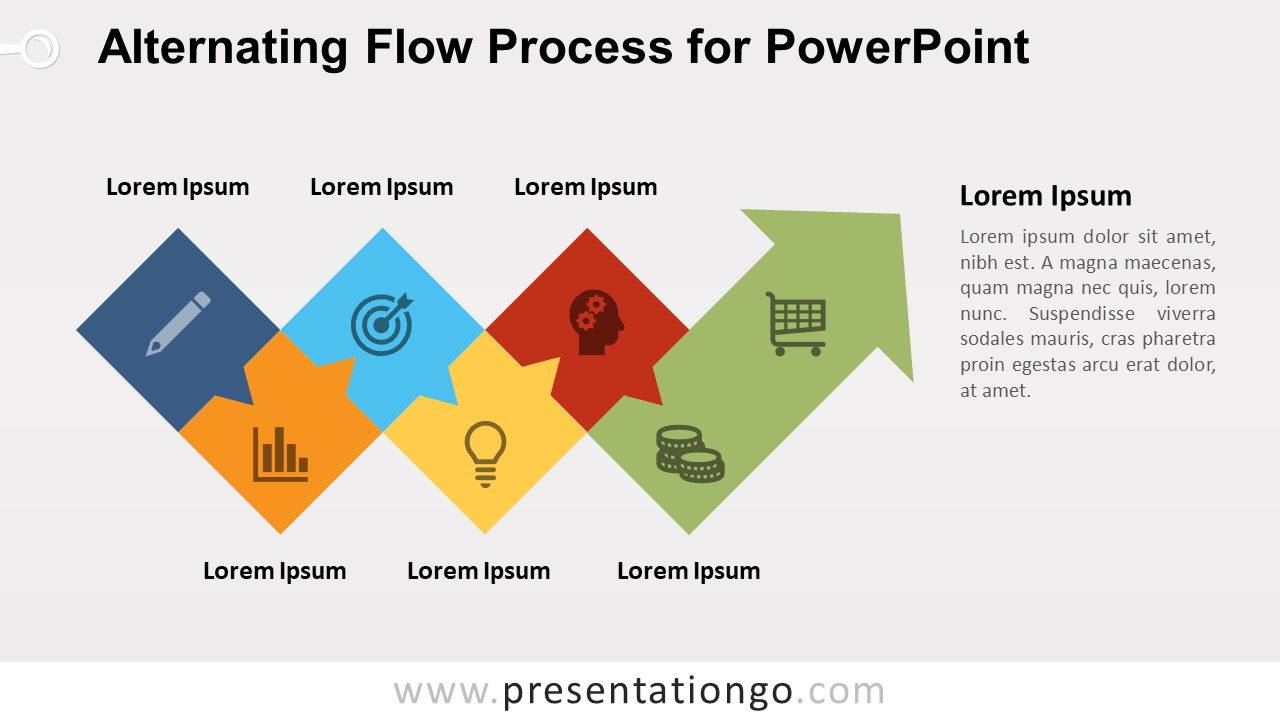
Free alternating flow process for PowerPoint. 6 or 7-step horizontal process diagram with colorful square shapes. Editable graphics with text placeholder.
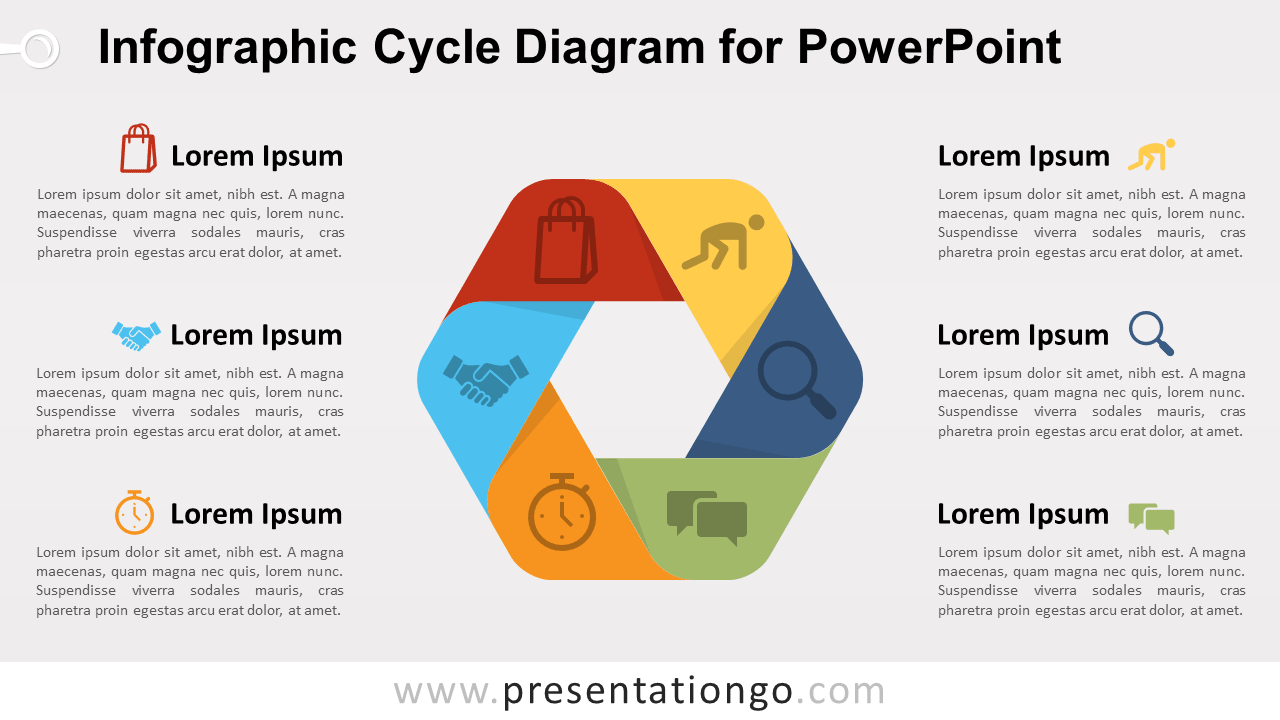
Free infographic cycle diagram for PowerPoint. Colorful cycle design with 6 stages, making a hexagon shape. Editable graphics with text placeholder.
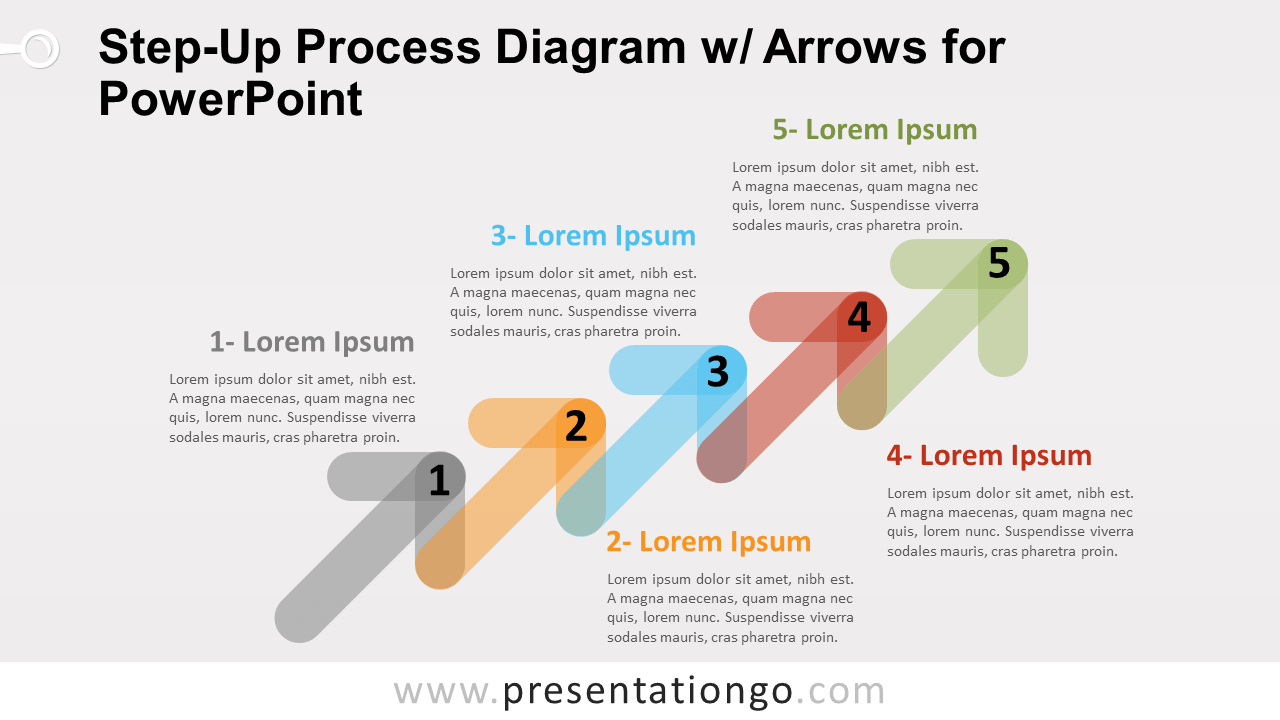
Free step-up process diagram for PowerPoint with arrows. Colored graphic design with ascending series of 5 steps. Editable graphics with text placeholder.
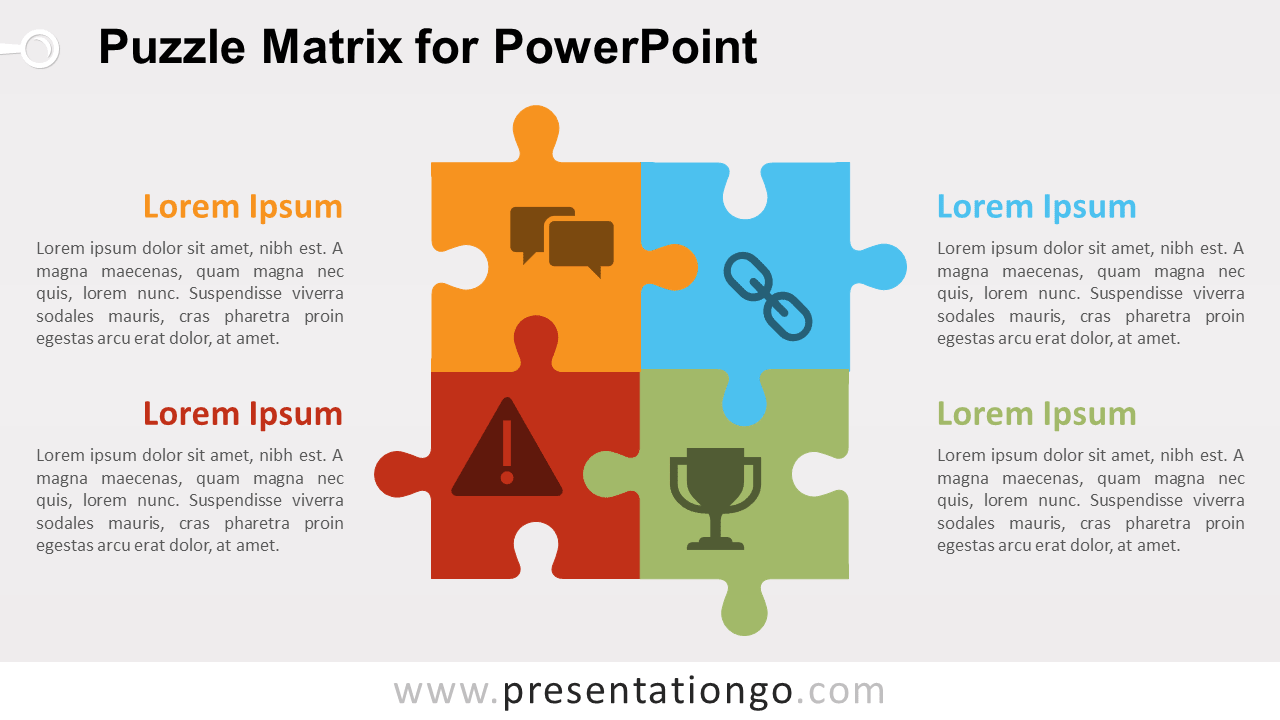
Free puzzle matrix for PowerPoint. Matrix with colored graphic design, 4 puzzle pieces (2x2 cells) and icons. Editable graphics with text placeholder.
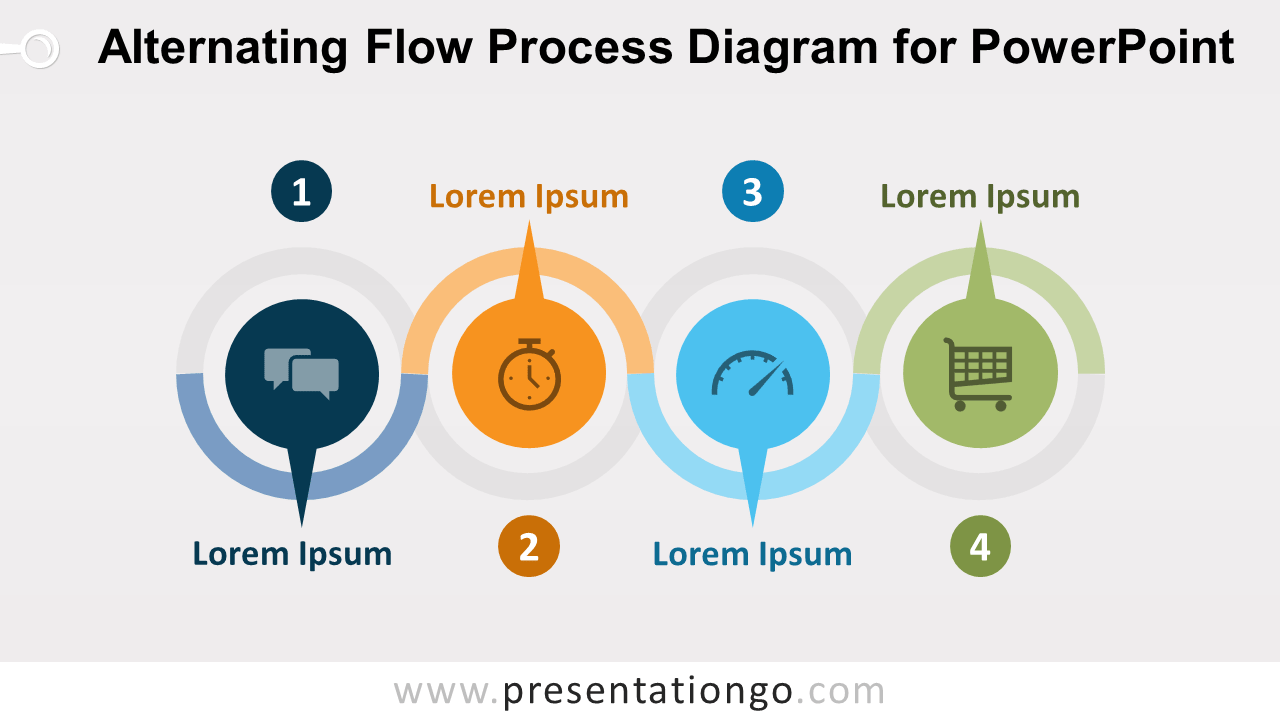
Free alternating flow process diagram for PowerPoint. Editable 4-step horizontal process diagram. To show 4 sequential steps in a task, process, workflow.
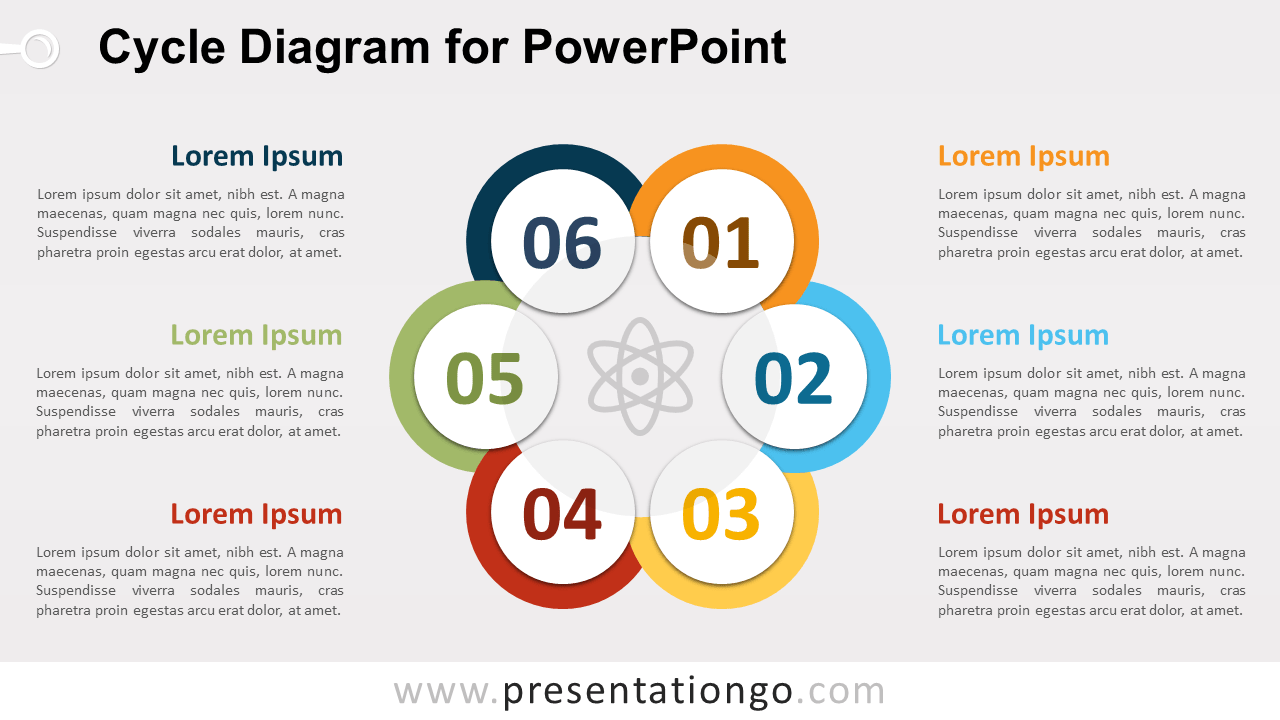
Free cycle diagram for PowerPoint. Editable colorful cycle design with 6 circle-shaped stages. To represent 6 stages, tasks, or events in a circular flow.
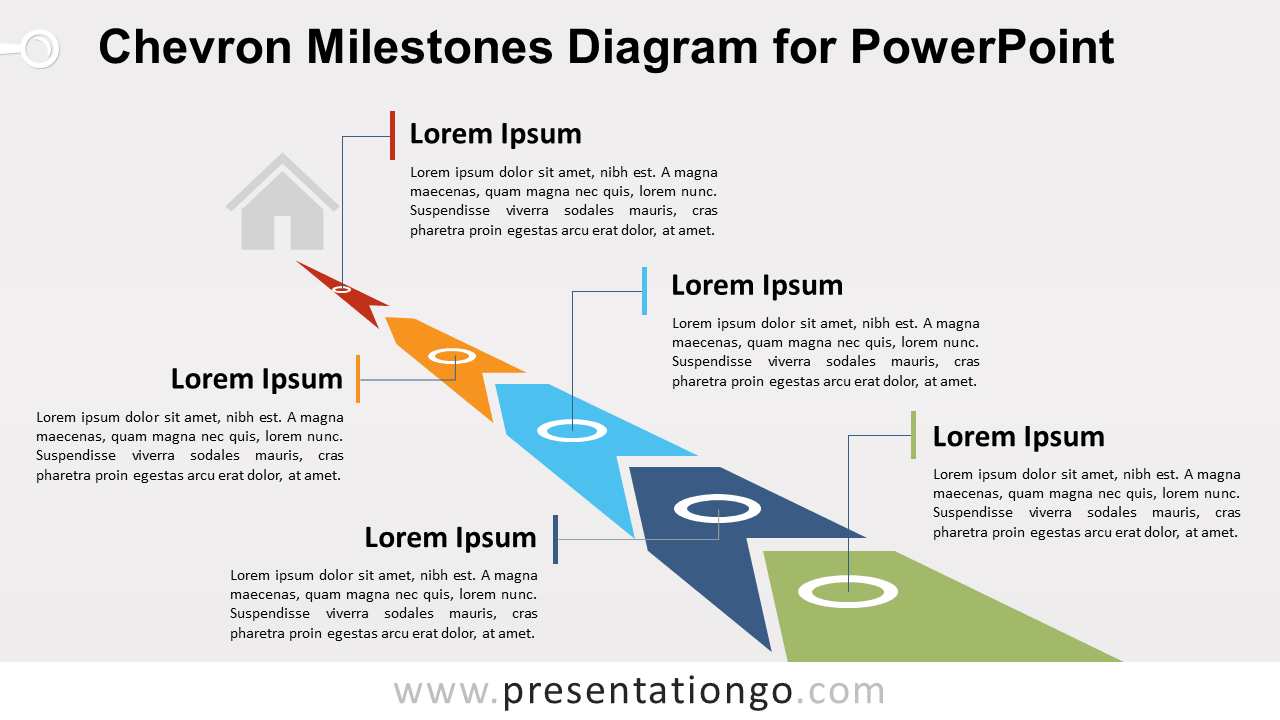
Free chevron milestones diagram for PowerPoint. Lined-up editable chevron shapes with perspective. Great to show 5 sequential steps or as a timeline.
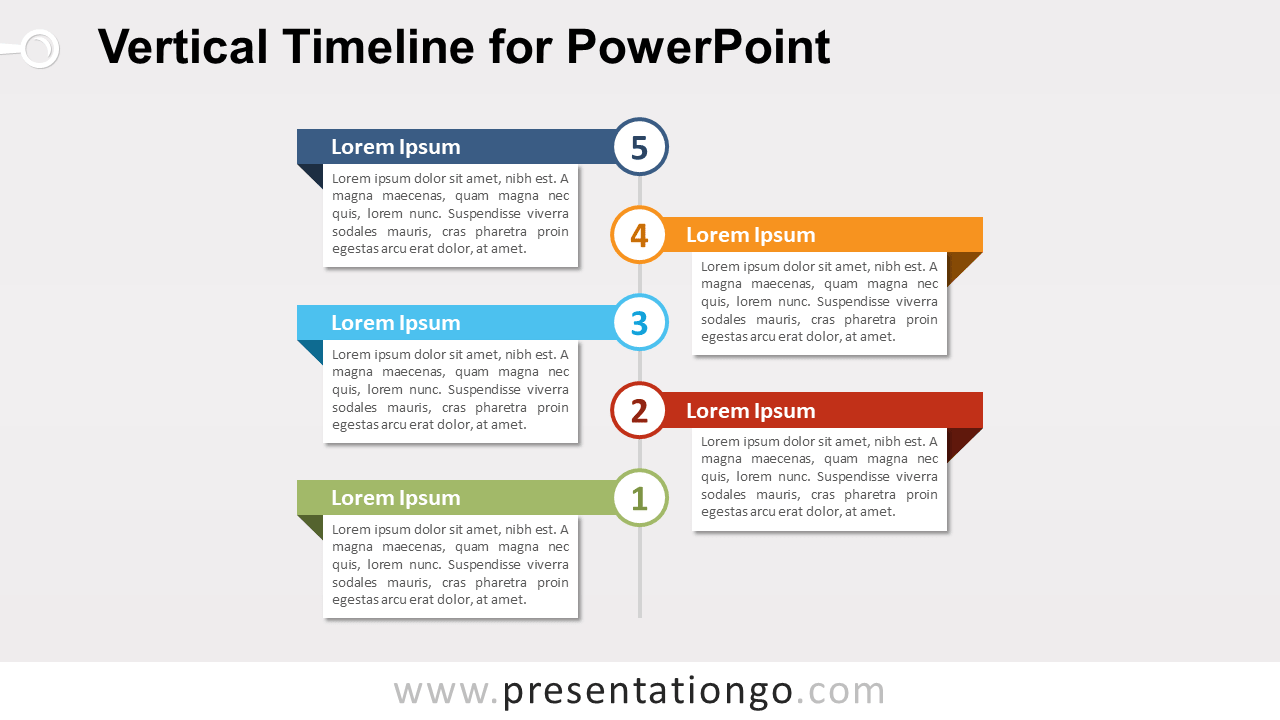
Free vertical timeline diagram for PowerPoint. 5-step vertical timeline diagram with colorful text boxes. Editable graphics with text placeholder.
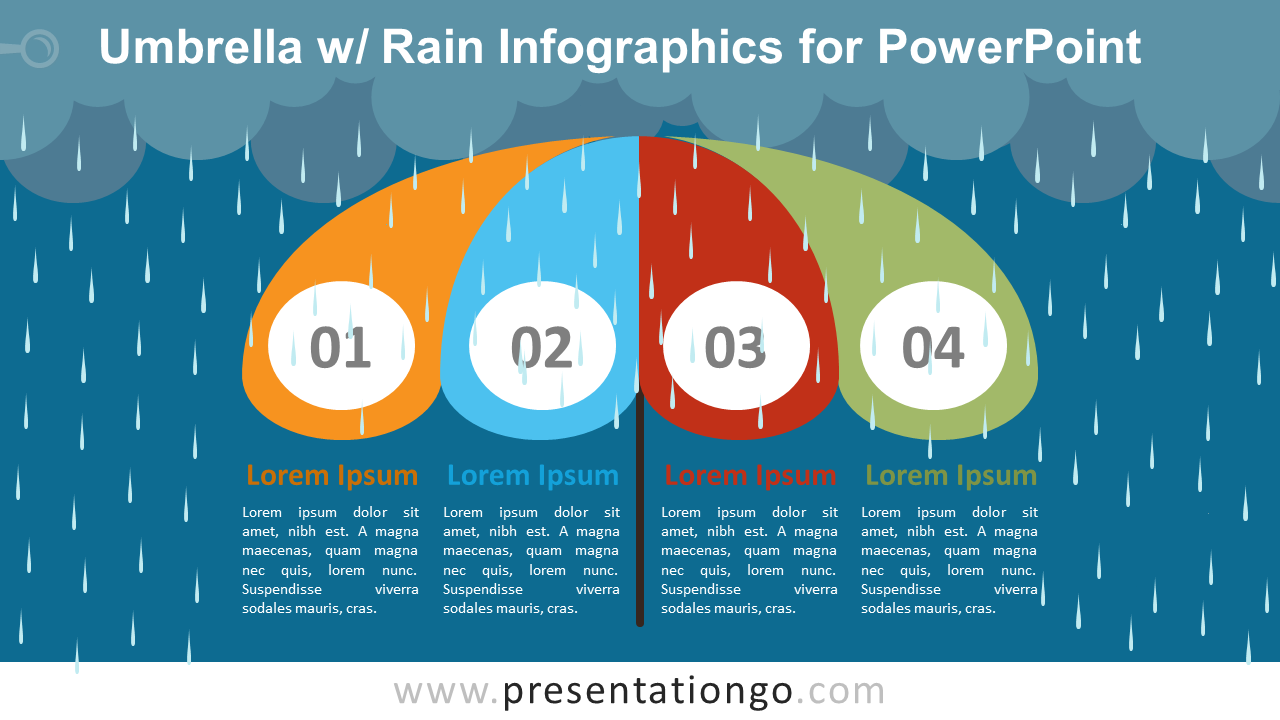
Free umbrella infographics template with rain and clouds for PowerPoint. Colorful infographic design with 4 blocks of information.
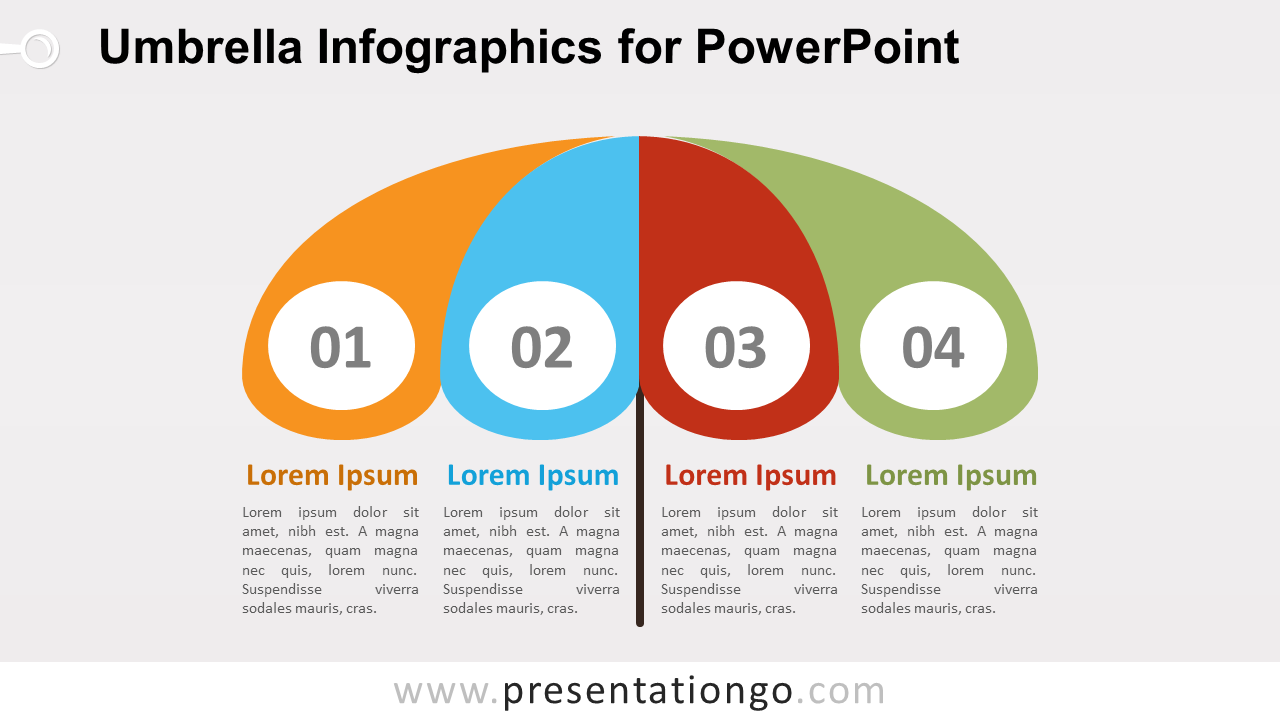
Free umbrella infographics template for PowerPoint. Colorful infographic design with 4 blocks of information. Editable graphics.
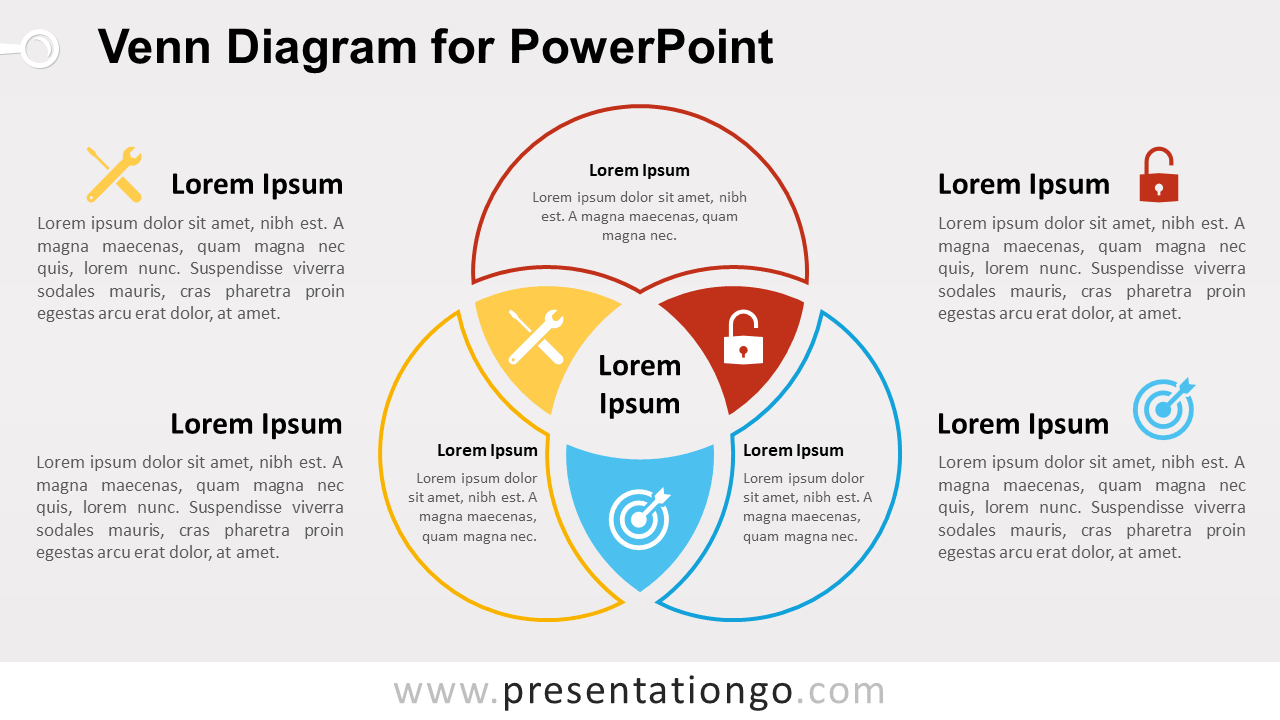
Free Venn diagram template for PowerPoint. To show overlapping relationships or interconnected ideas or concepts.
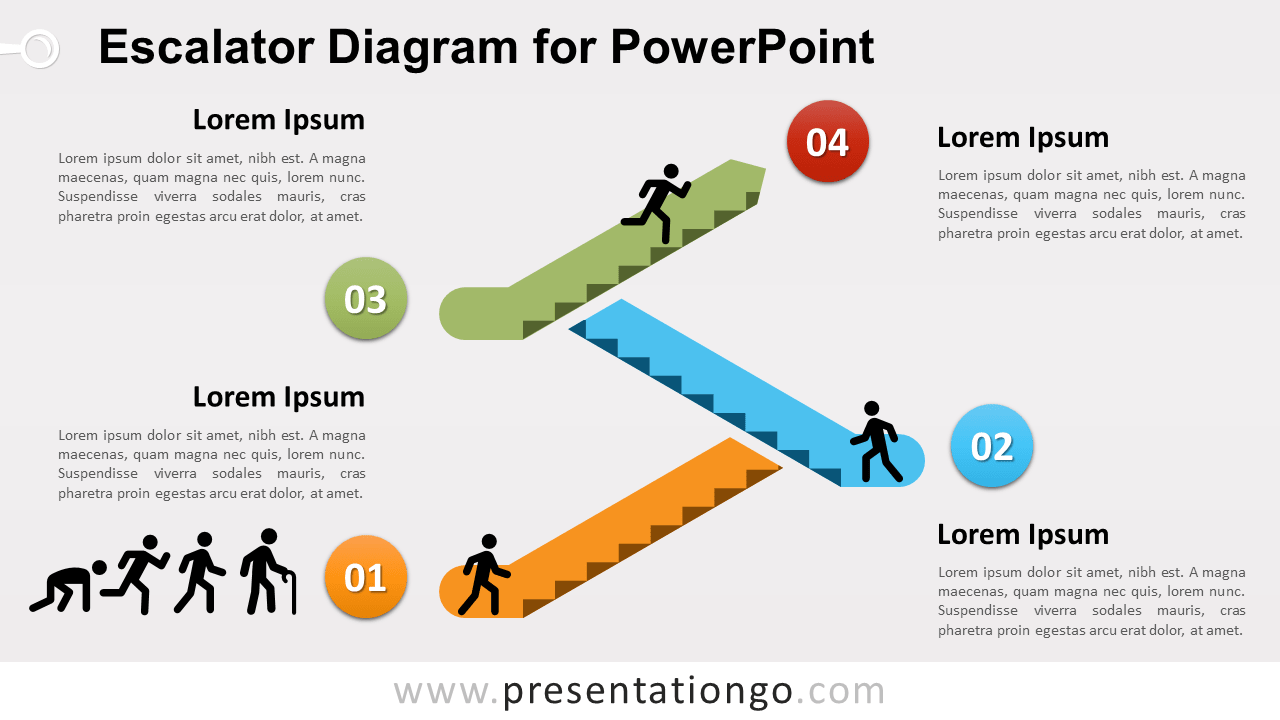
Free escalator diagram for PowerPoint. Colorful editable graphic design with 4 levels or floors. To illustrate a progression or 4 sequential stages.
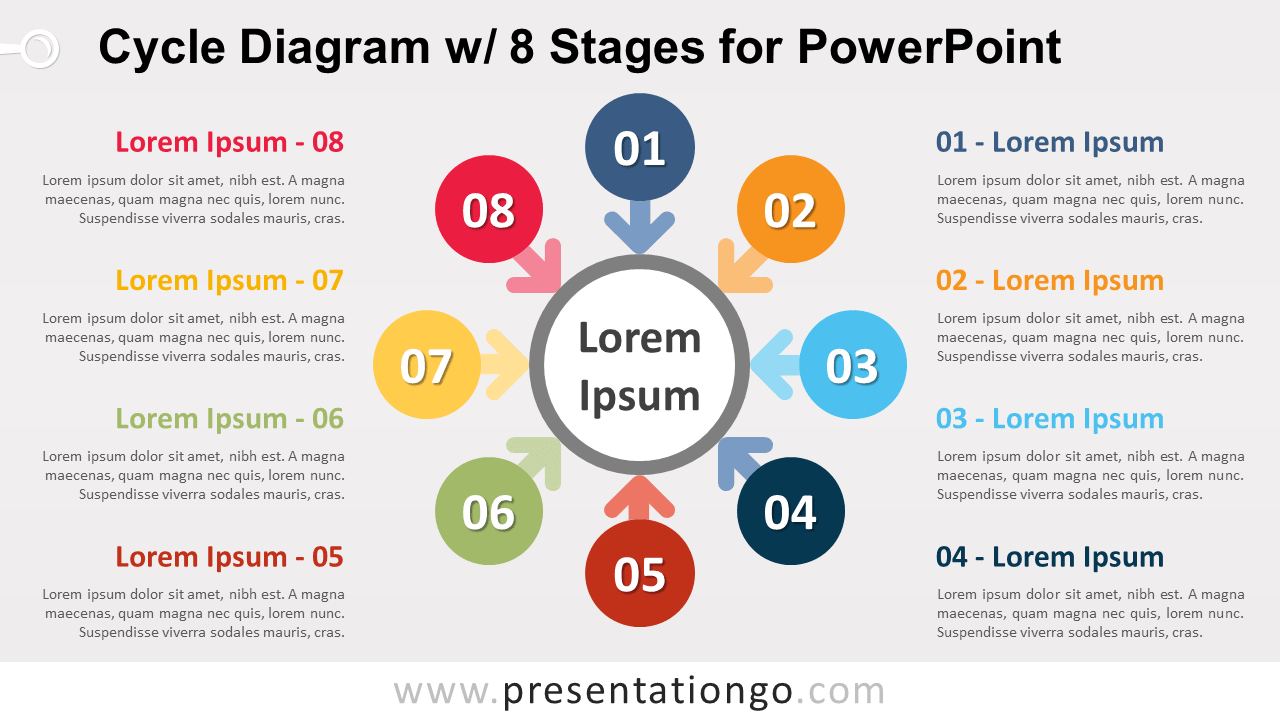
Free cycle diagram for PowerPoint. Colorful and editable cycle design with 8 circle-shaped stages. Each circle has an arrow pointing to the central circle.
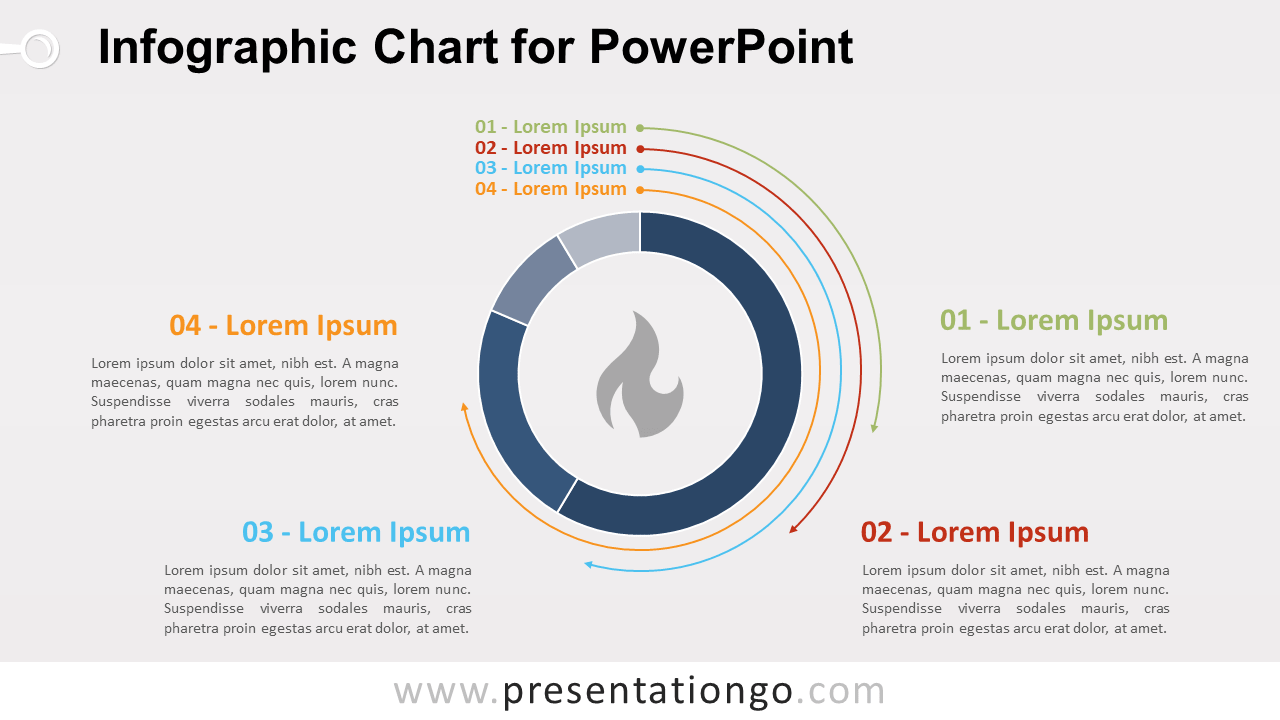
Free infographic chart for PowerPoint with doughnut pie-chart and arc shapes. 4 arc shape layers. Editable, data-driven chart w/ text placeholder.
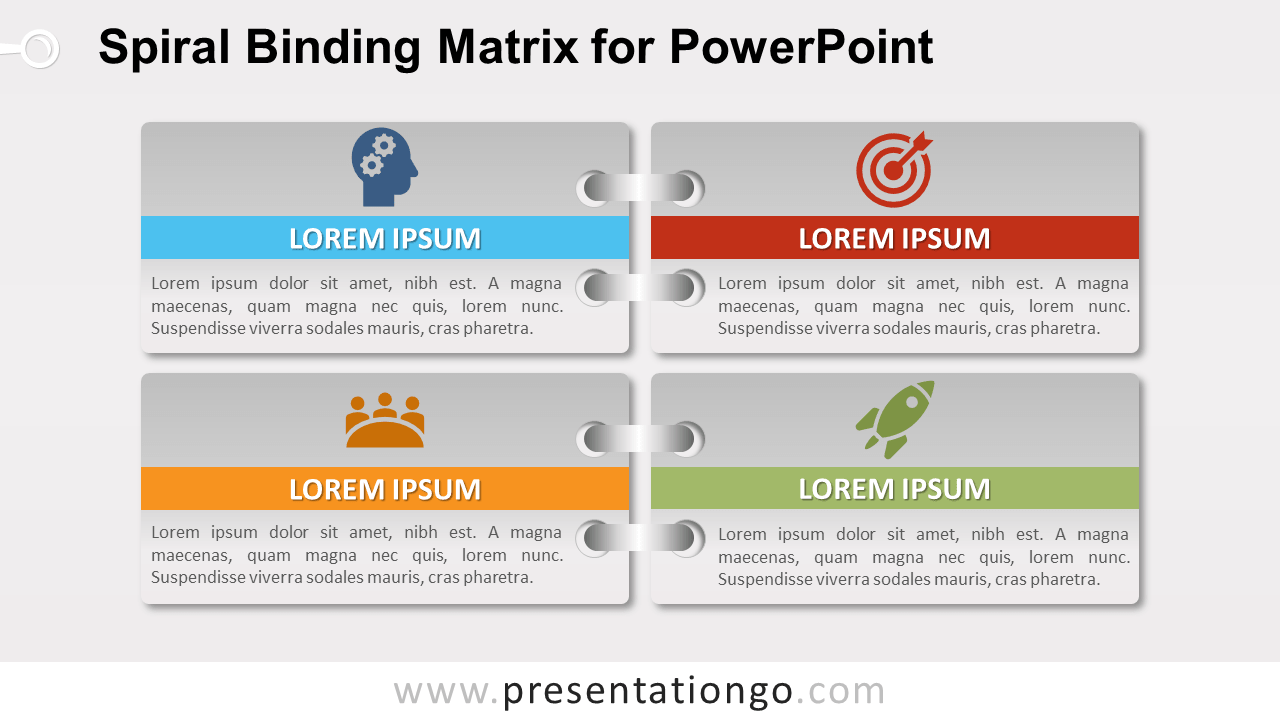
Free spiral binding matrix for PowerPoint. Notepad-style matrix with colored graphic design, 4 quadrants and icons. Editable graphics.
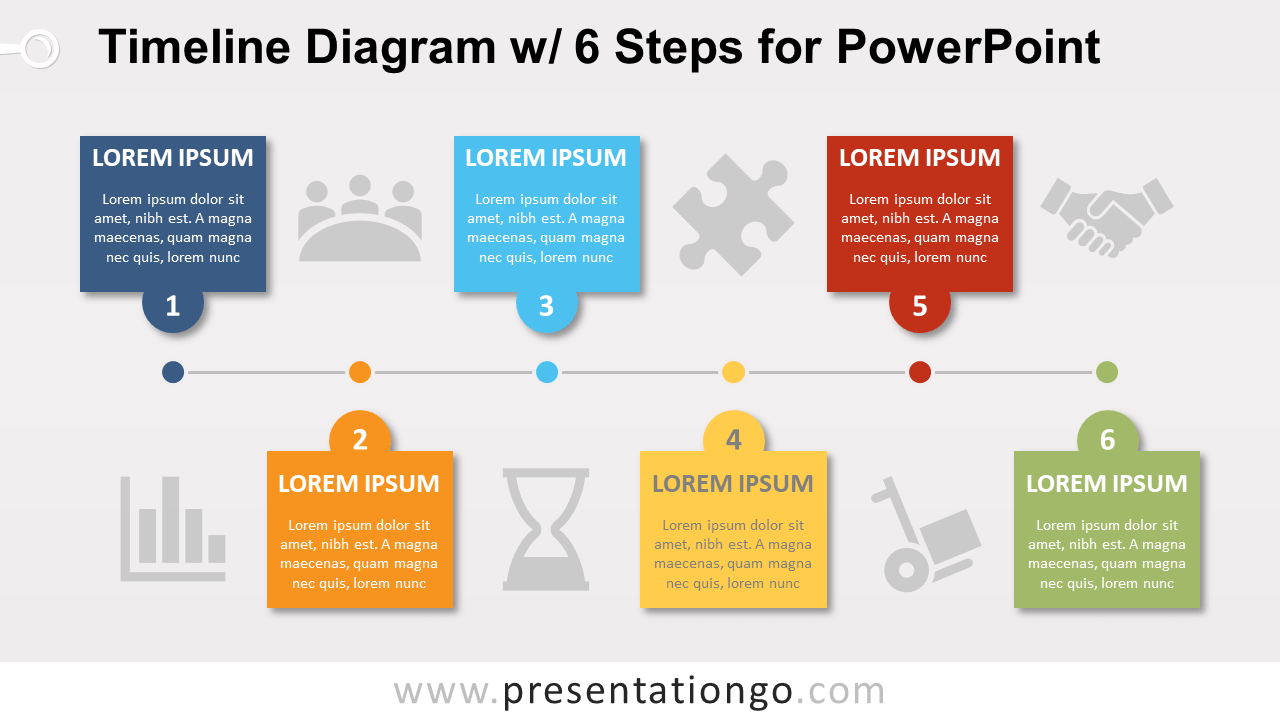
Free timeline diagram for PowerPoint. 6-step horizontal timeline diagram with colorful text boxes. Editable graphics with text placeholder.
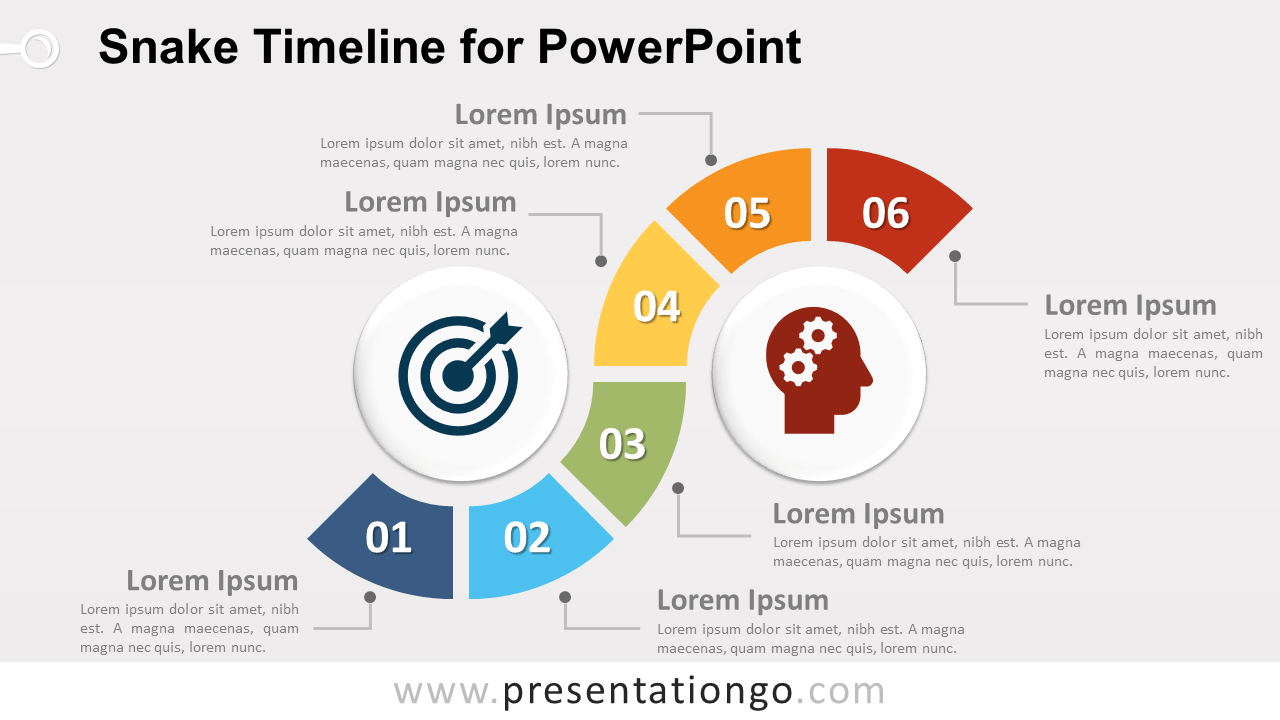
Free snake timeline diagram for PowerPoint. Sinuous "S-shaped" 4-step process diagram, and 2 circles with icons. Editable graphics.
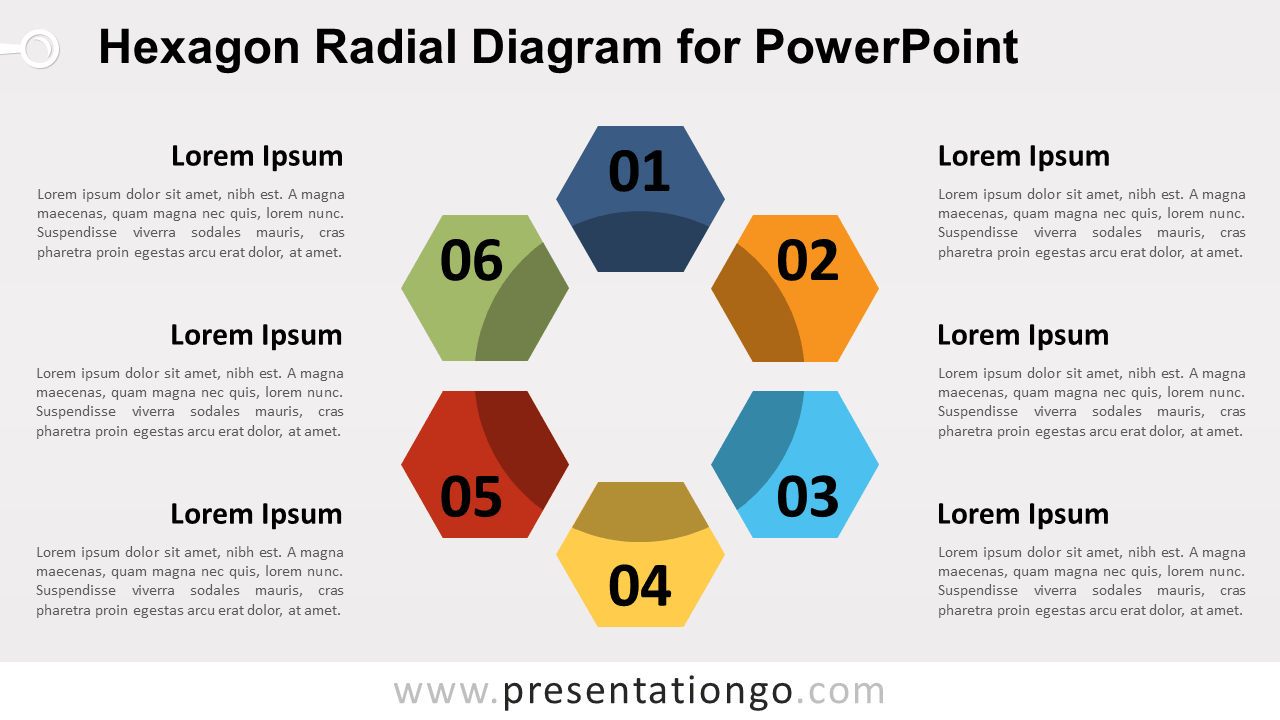
Free hexagon radial diagram for PowerPoint. Colored graphic cycle design with 6 hexagonal-shaped steps. Editable graphics.
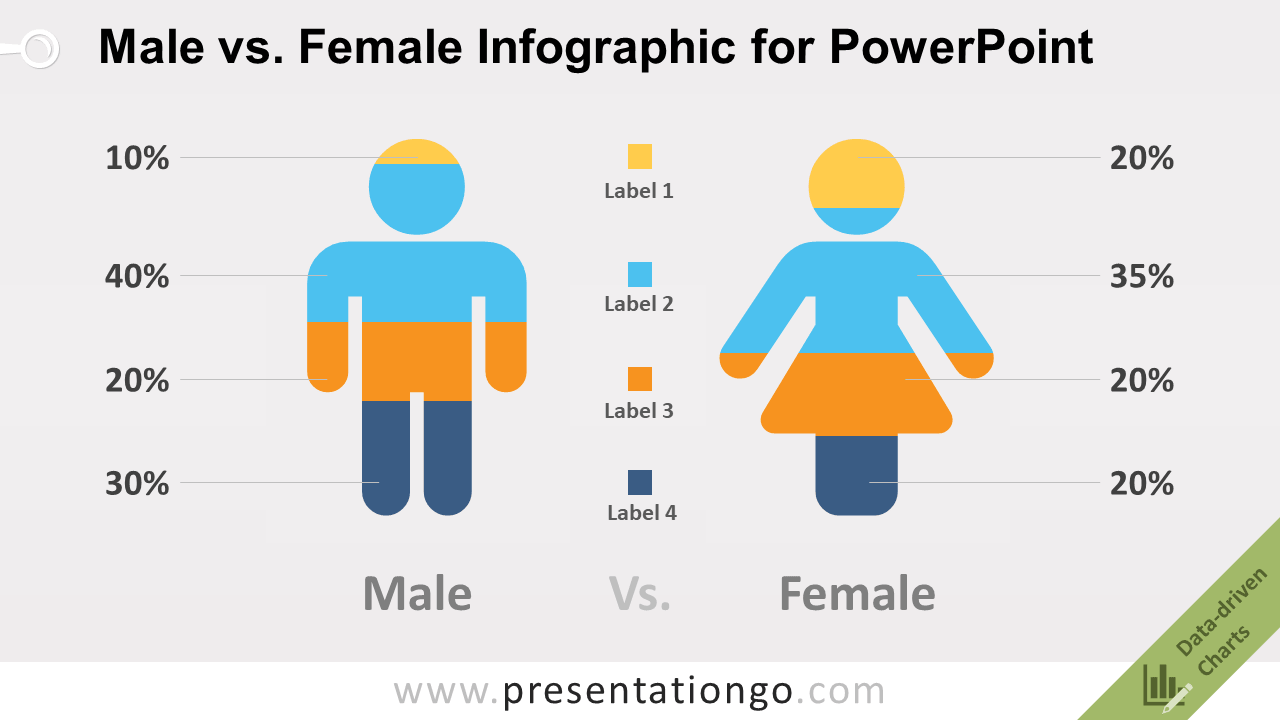
Free male vs. female infographic for PowerPoint. Male and female silhouette shapes with data-driven charts. Great to compare quantitative results.
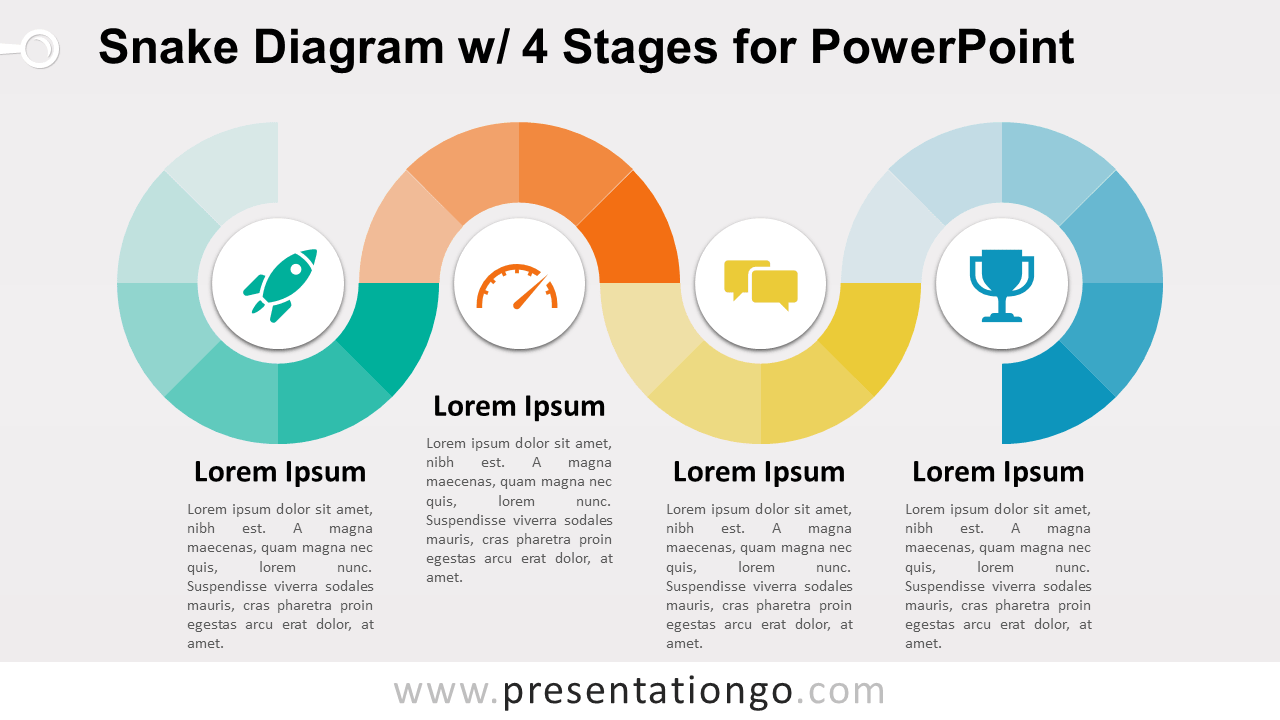
Free snake diagram with 4 stages for PowerPoint. Sinuous 4-step process diagram made of colorful doughnut parts. Editable graphics with text placeholder.
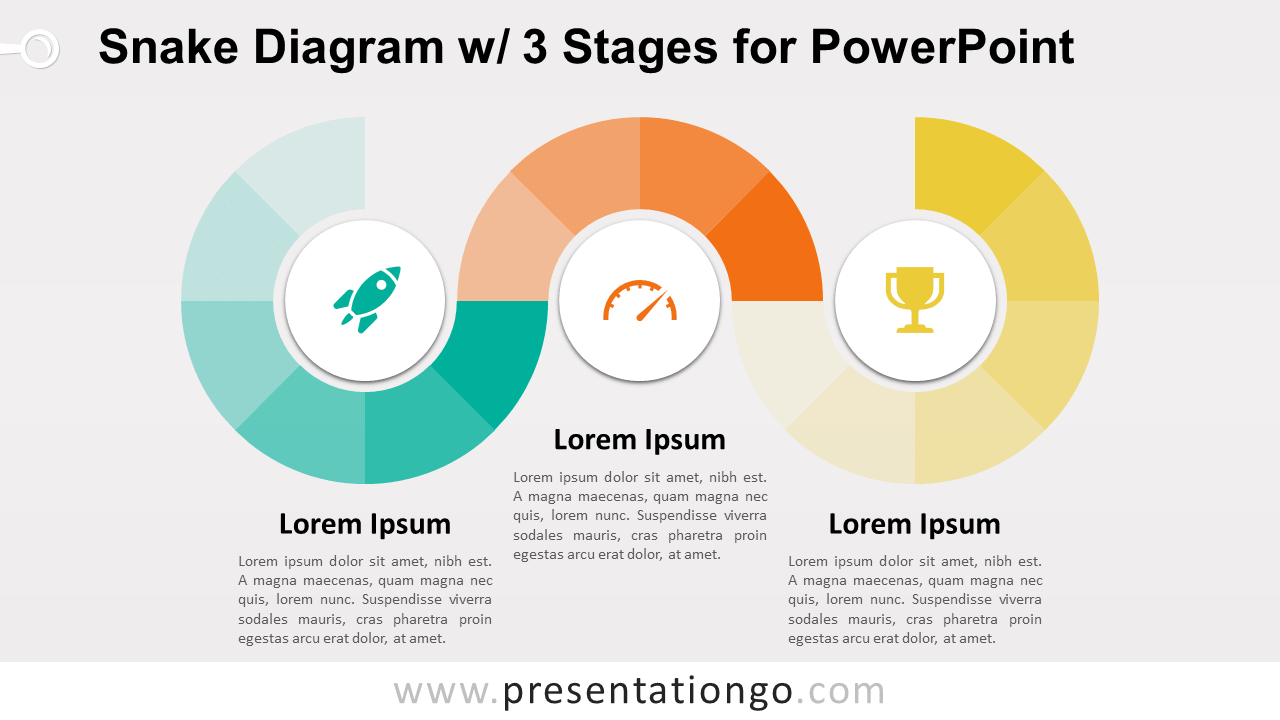
Free 3-stage snake diagram for PowerPoint. Winding 3 stage process diagram made of colorful donut parts. Editable chart with text placeholders.