Loading resources…
Total 1760 resources
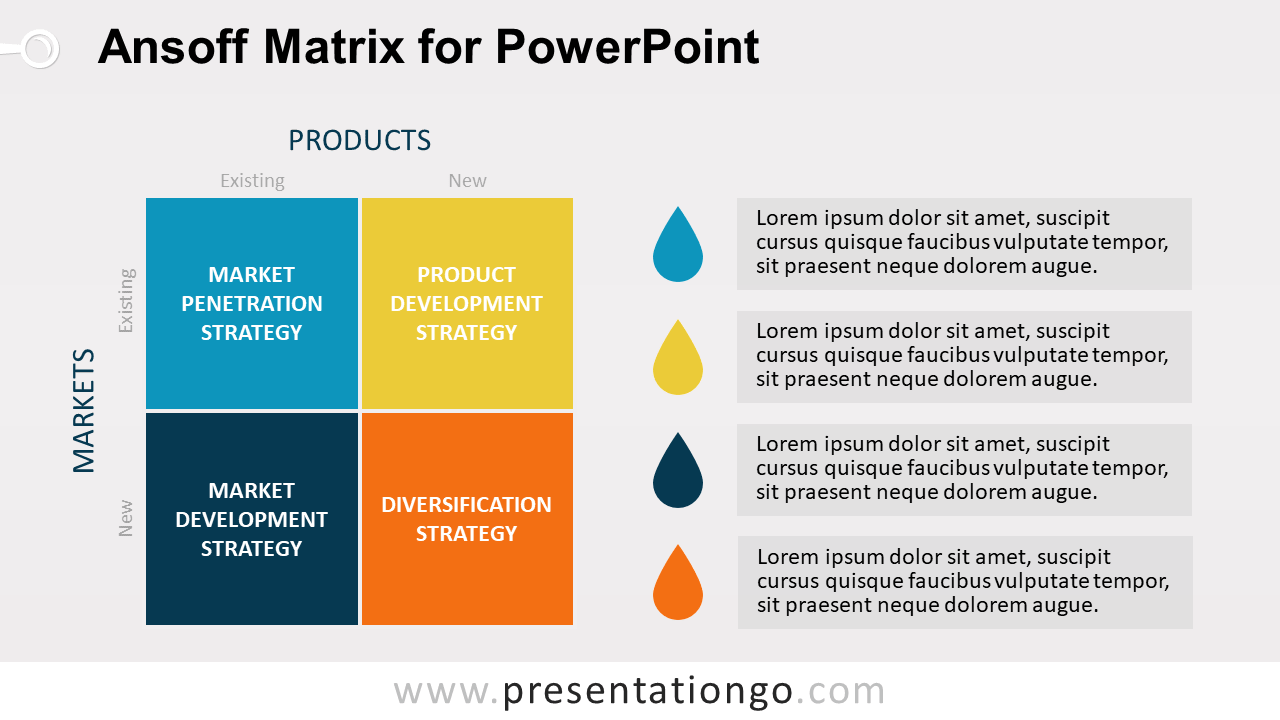
Free Ansoff matrix for PowerPoint. Colored graphic design with 4 quadrants (2x2 cells) and icons. Editable graphics with text placeholder. 2 slides.
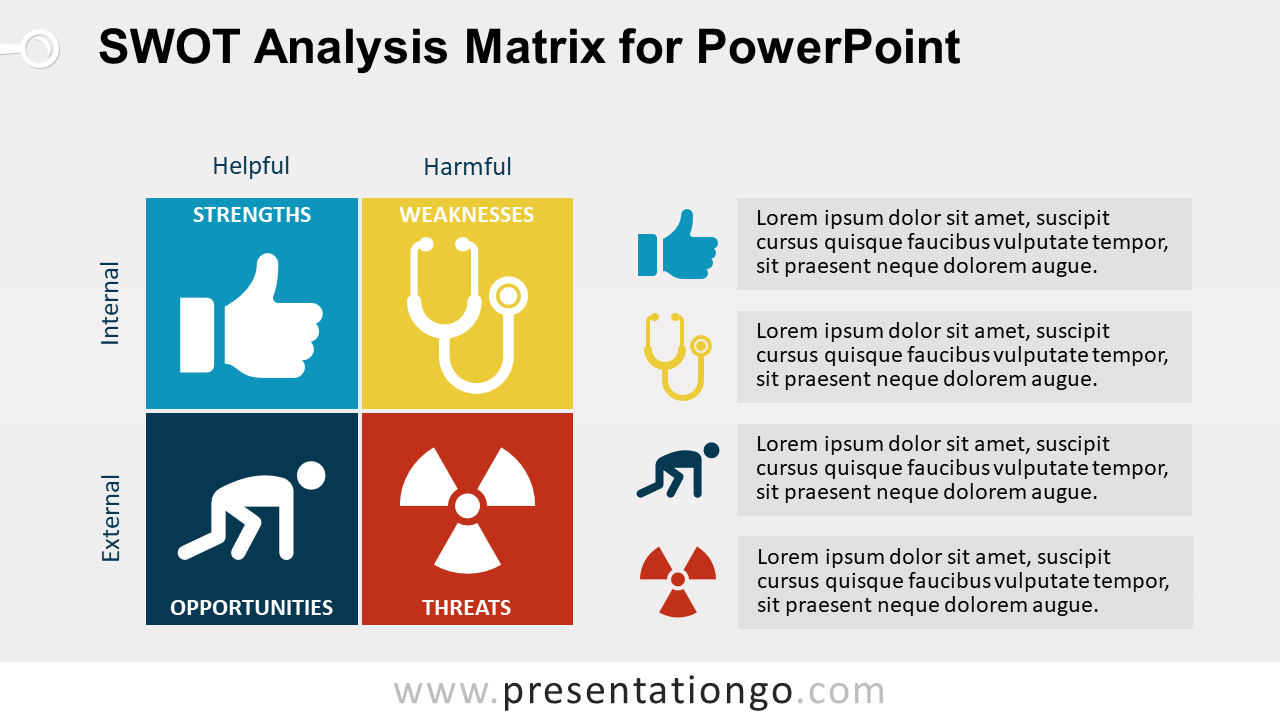
Free SWOT analysis matrix for PowerPoint. Colored graphic design with 4 quadrants (2x2 cells) and icons. Editable graphics with text placeholder.
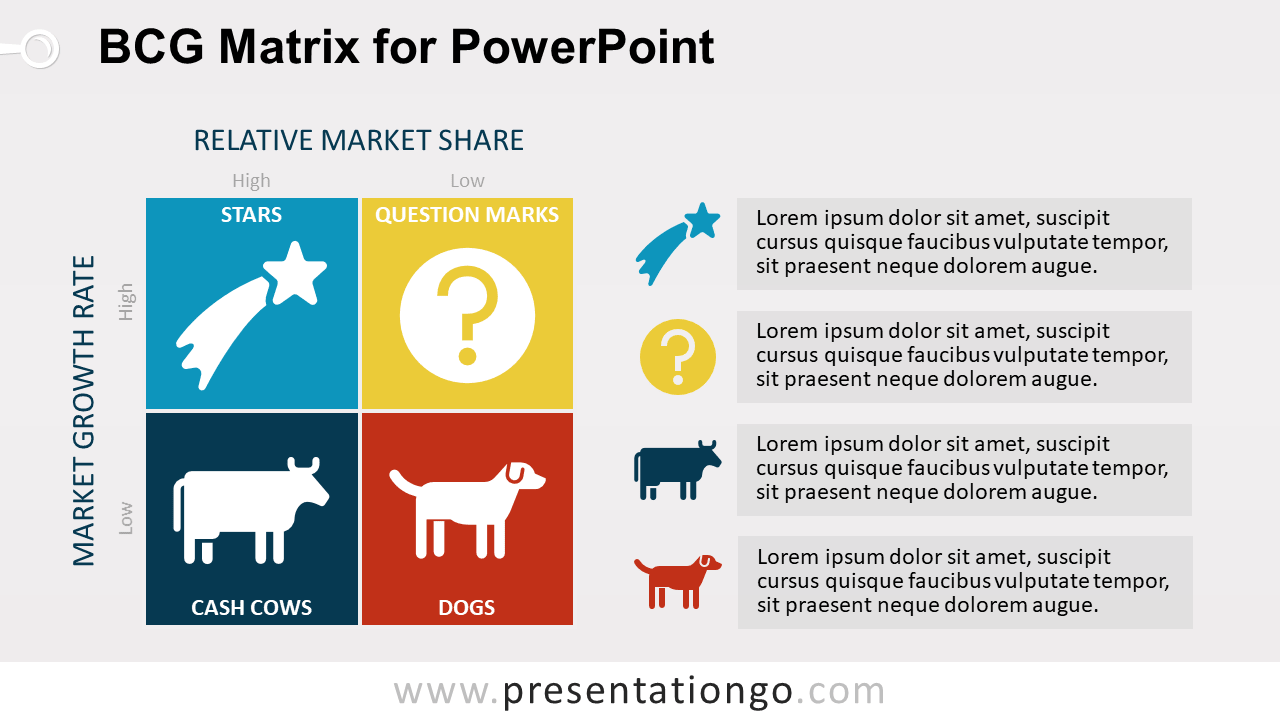
Free BCG matrix diagram for PowerPoint. Colored graphic design with 4 quadrants (2x2 cells) and icons. Editable graphics with text placeholder.
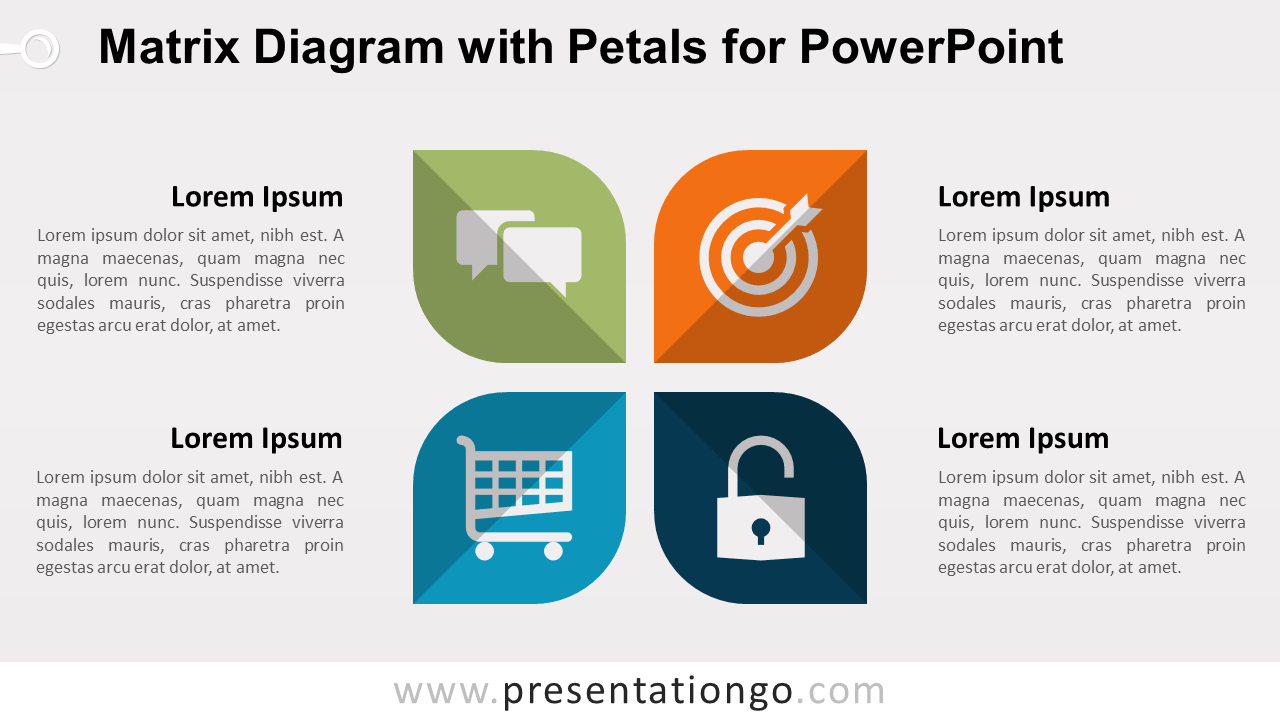
Free matrix diagram with petals for PowerPoint. Matrix with editable petal shapes in a flat design style. Perfect for business or marketing matrices.
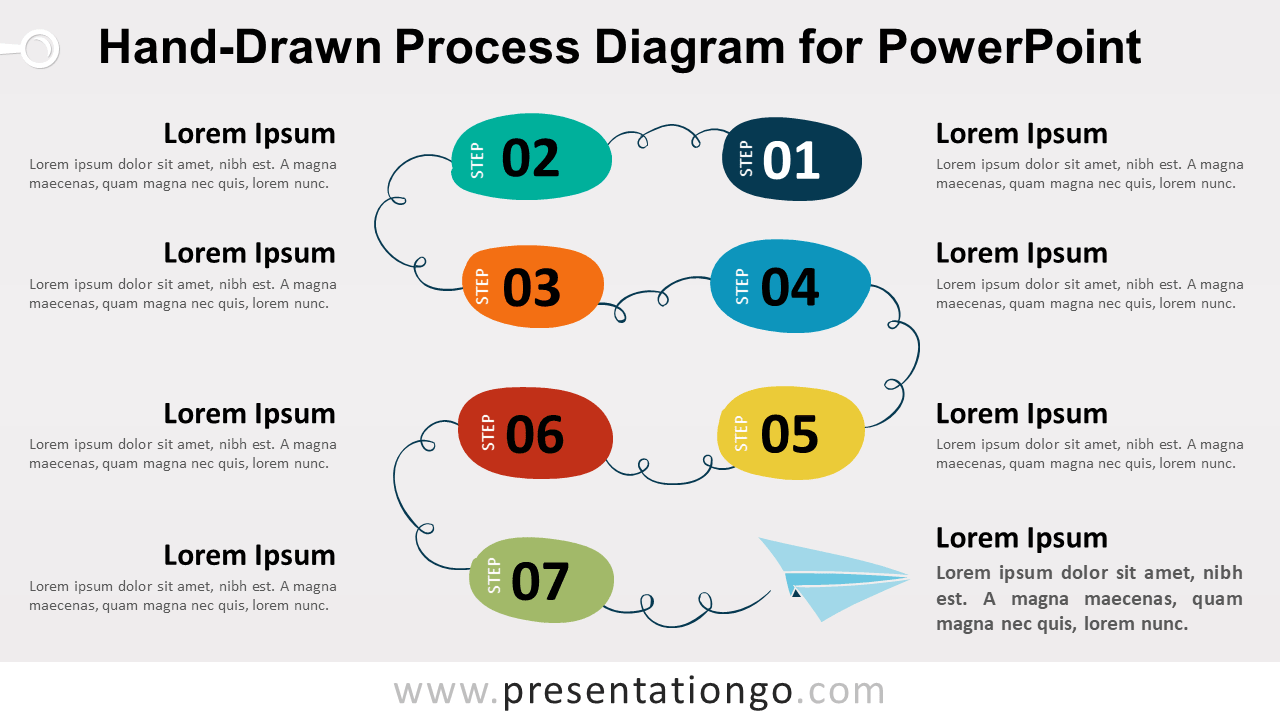
Free hand-drawn process diagram for PowerPoint. 7 editable text bubbles connected with a corkscrew-shaped line. A paper airplane ends the process. 2 slides.
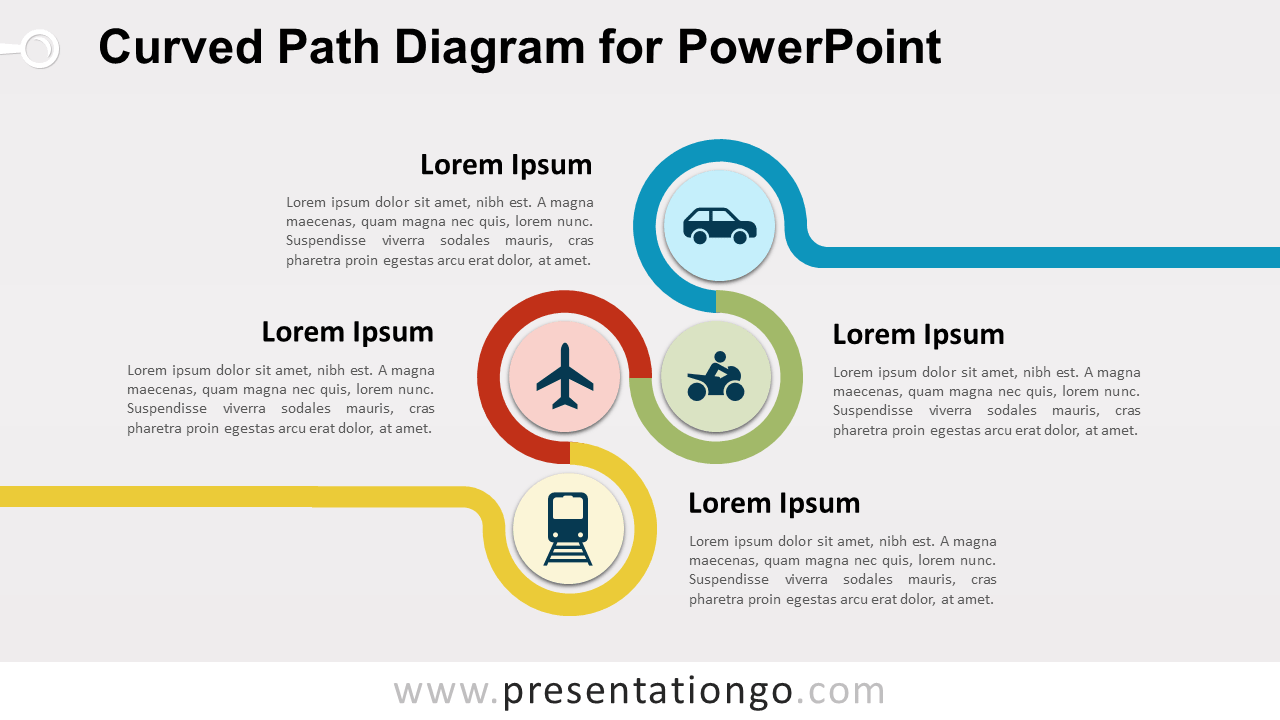
Free curved path diagram for PowerPoint. Sinuous ribbon made of four 3/4 circles. Editable graphics. To show a progression, 4 sequential steps in a process.
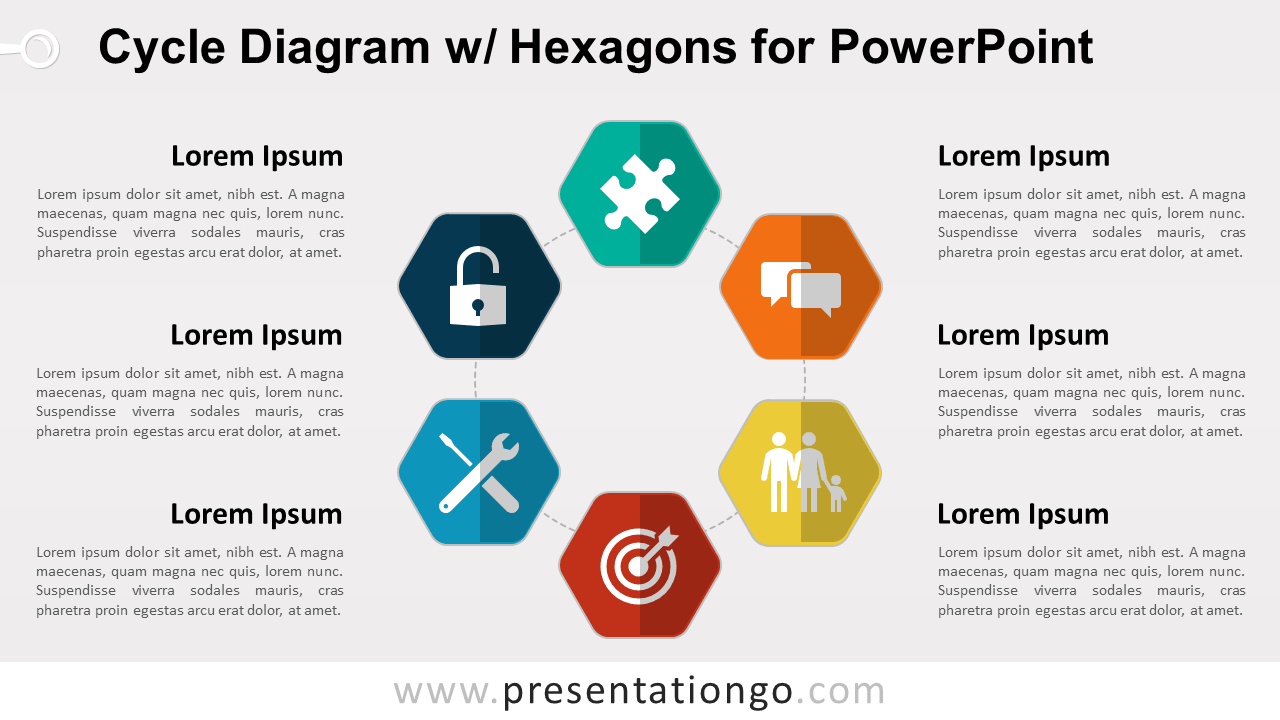
Free cycle diagram with hexagons for PowerPoint. Colored graphic design with 6 hexagonal-shaped steps. Editable graphics with text placeholders. 2 slides.
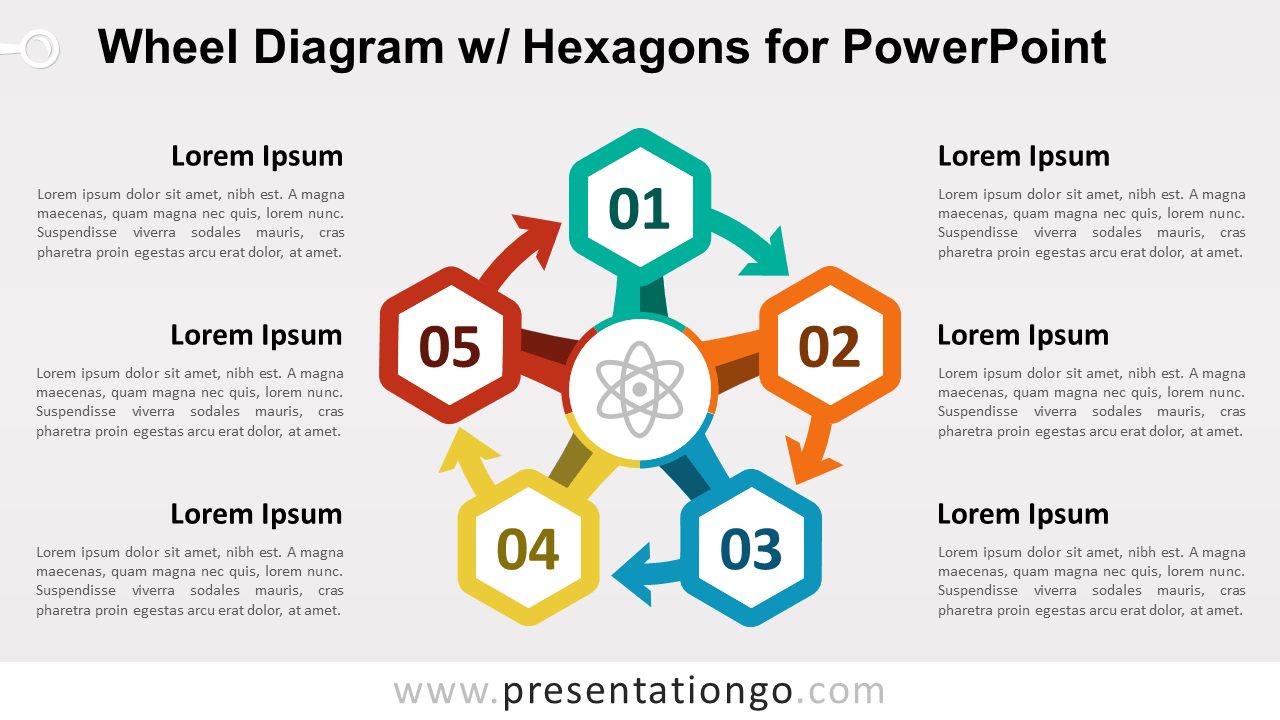
Free circular wheel diagram for PowerPoint. Editable design with 5 hexagonal-shaped steps. To show a continuing sequence of 5 stages in a circular flow.
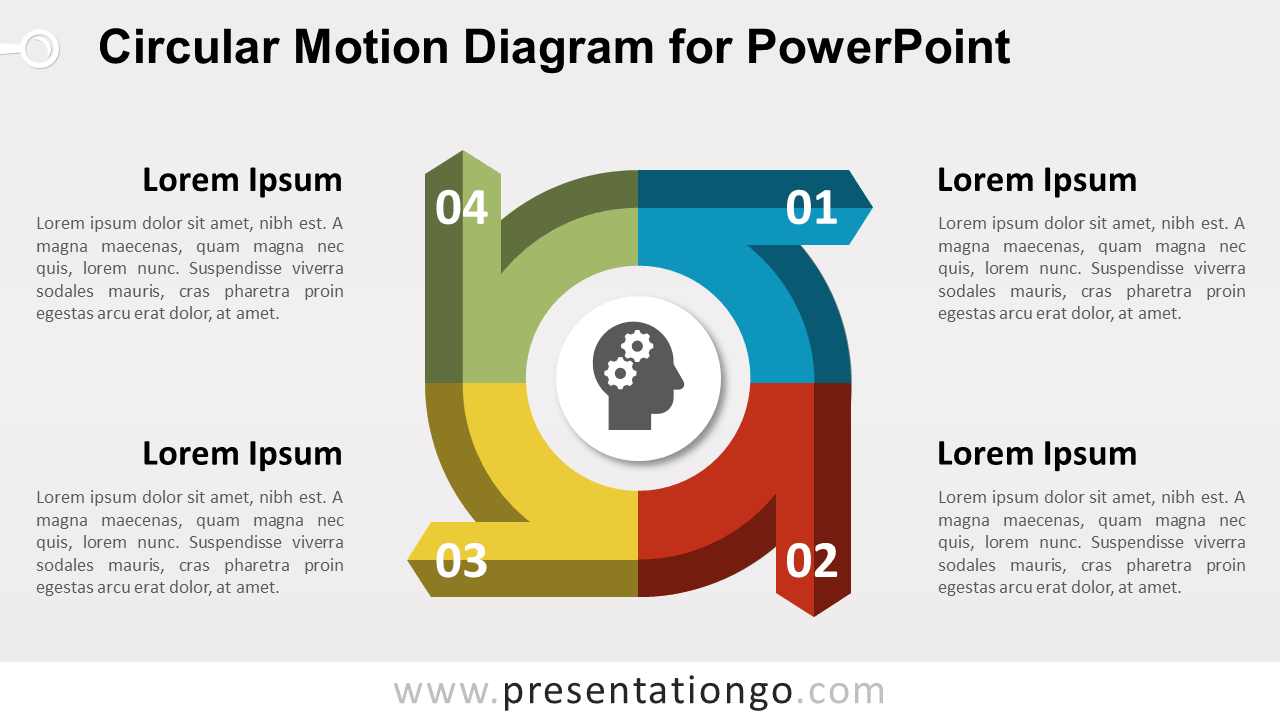
Free circular motion diagram for PowerPoint. Colored graphic design with 4 steps with arrows. Use it for a continuing sequence of 4 stages or as a matrix.
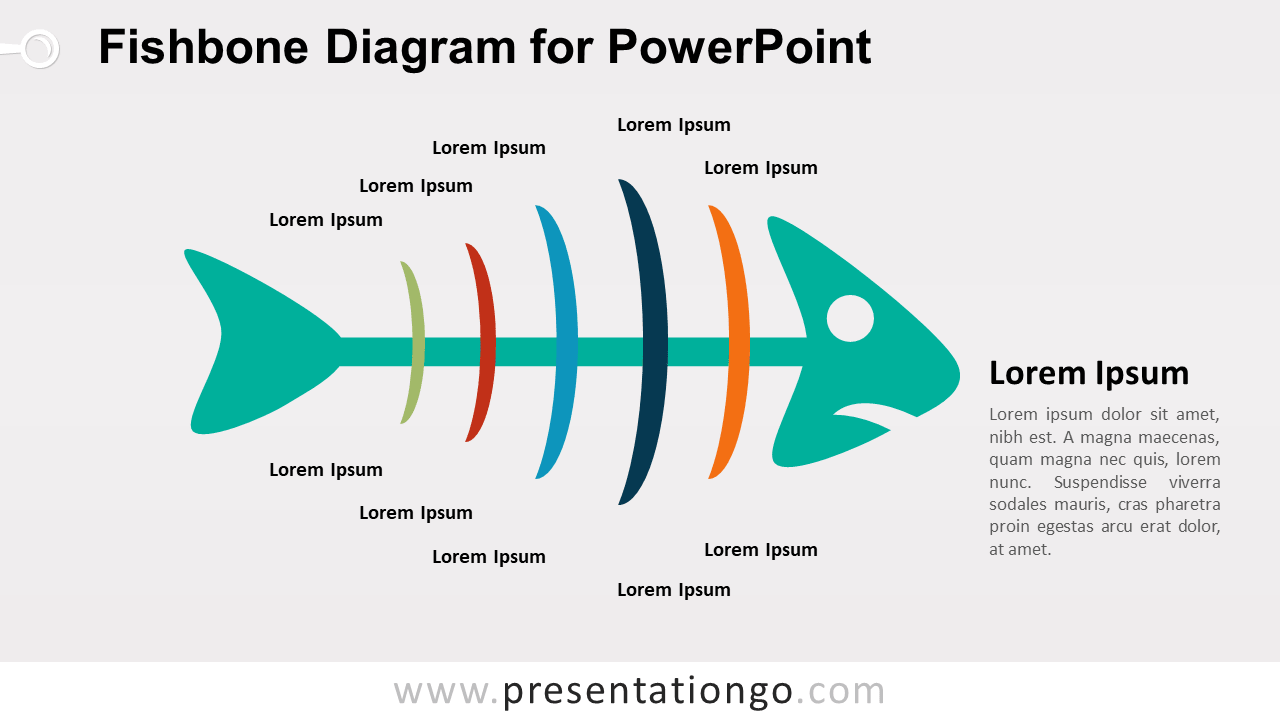
Free cause and effect fishbone diagram template for PowerPoint. Colored graphic design with 5 fish bone shapes. Editable graphics with text placeholder.
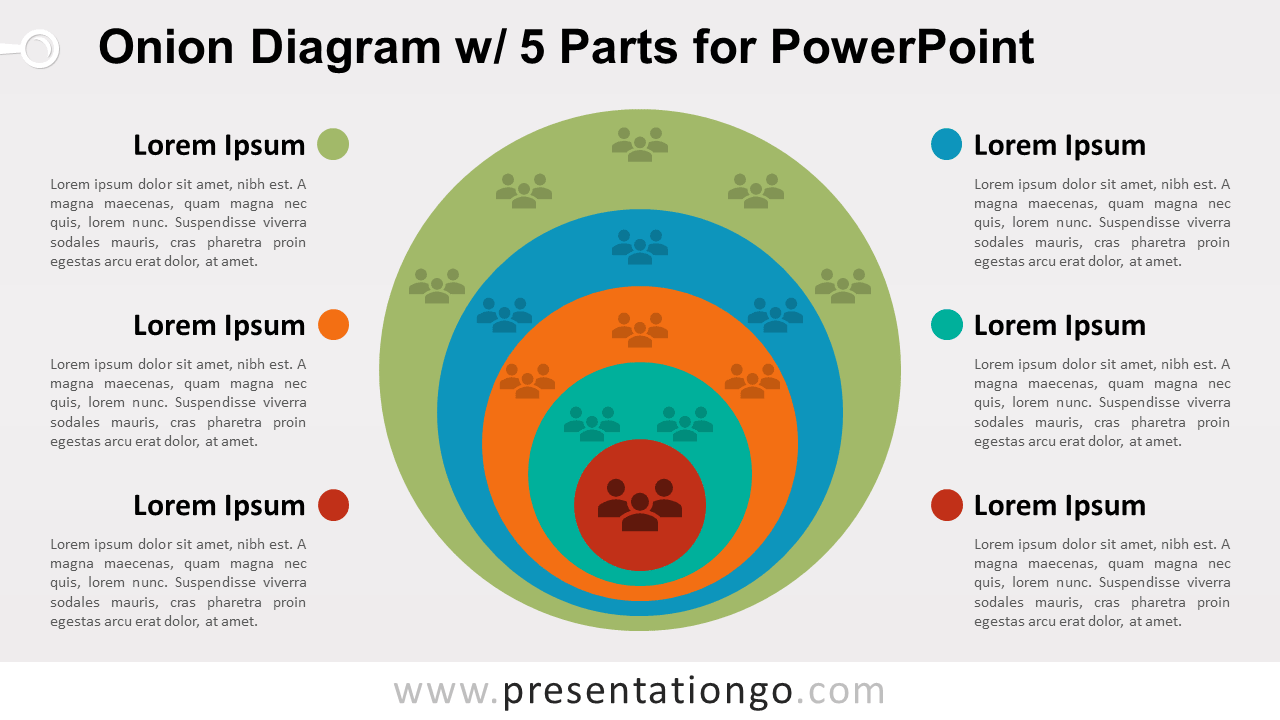
Free onion diagram template for PowerPoint. Colored graphic design using 5 nested circle shapes. Editable graphics with text placeholder. 2 slides.
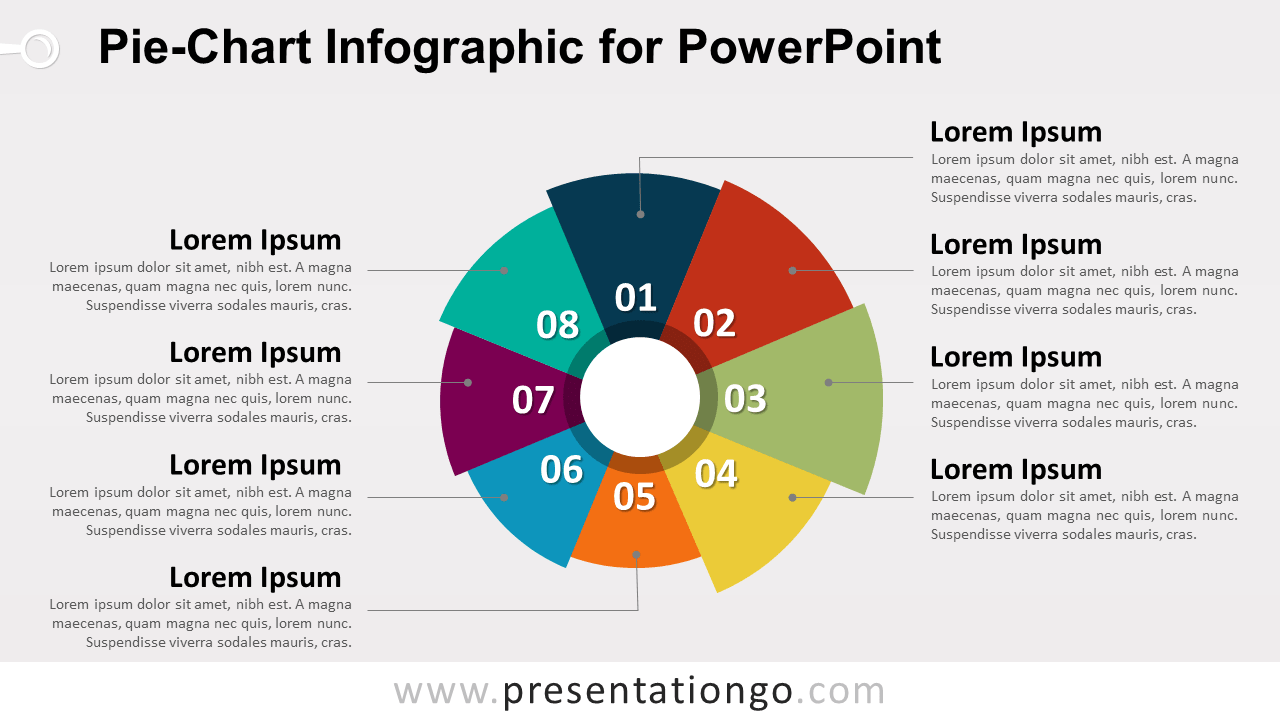
Free pie-chart infographic for PowerPoint. Colored graphic design with 8 editable parts or steps. Emphasizes the growing importance of interconnected parts.
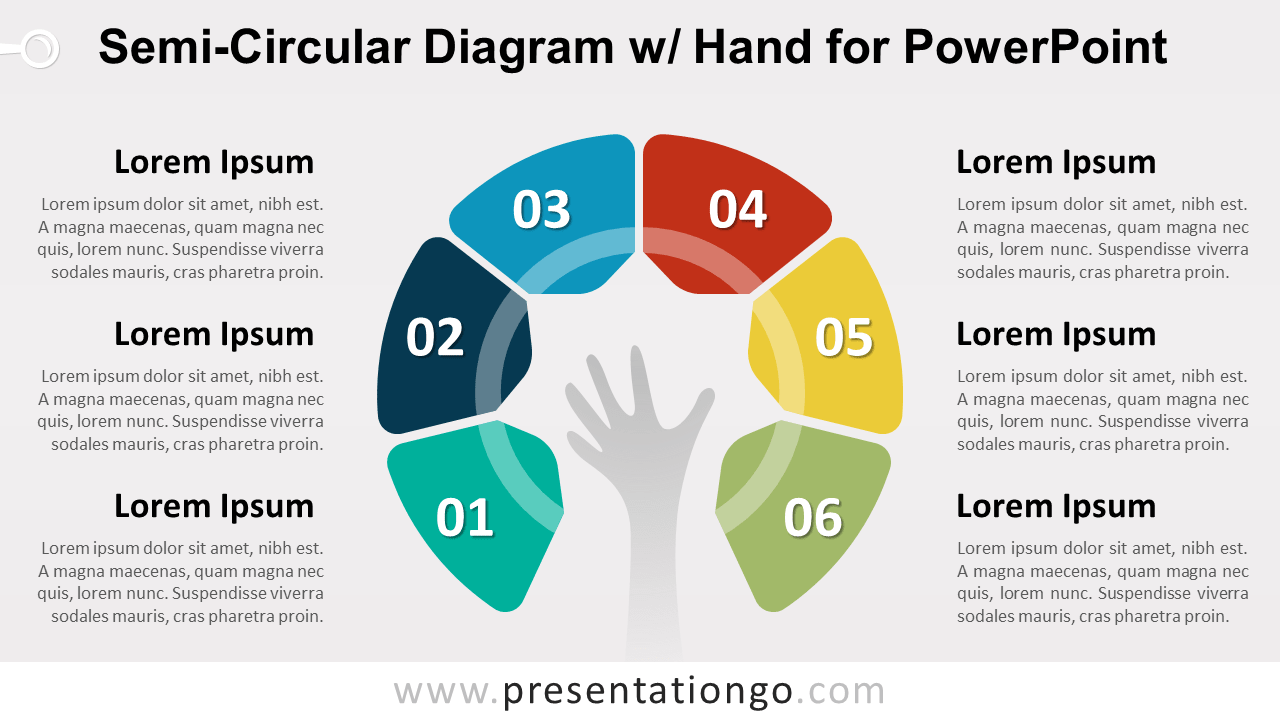
Free semi-circular diagram for PowerPoint. Colored graphic design with 6 steps and a hand in the center. Editable graphics.
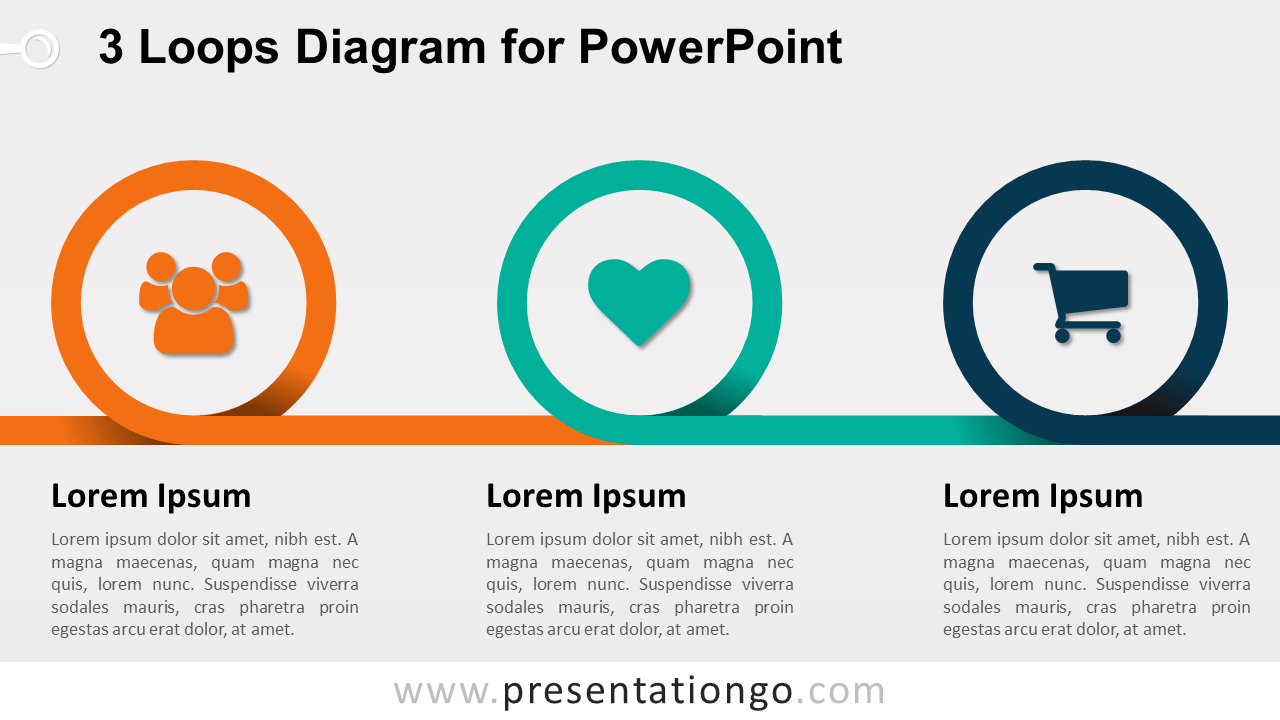
Free horizontal coil spring diagram with 3 loops for PowerPoint. For a progression or 3 sequential steps in a task, process, or workflow.
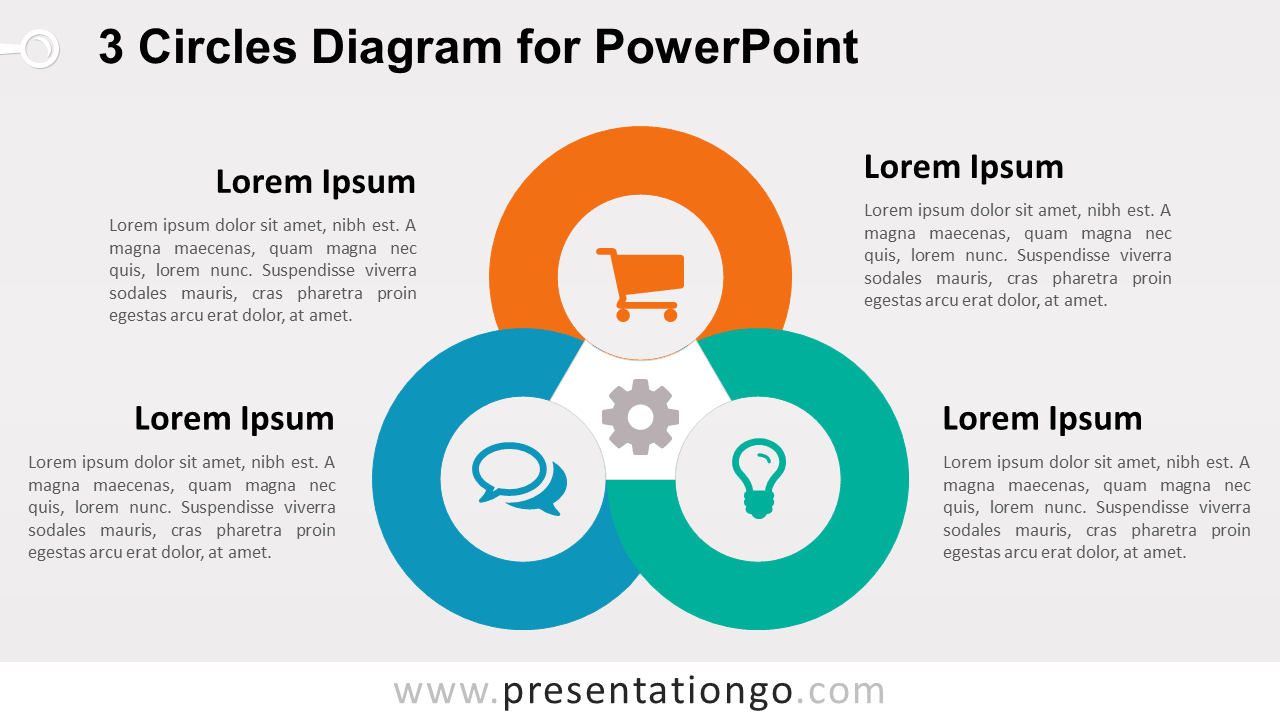
Free diagram with 3 interconnected circles for PowerPoint. Great to show overlapping or interconnected ideas or concepts. Alternative to the Venn diagram.
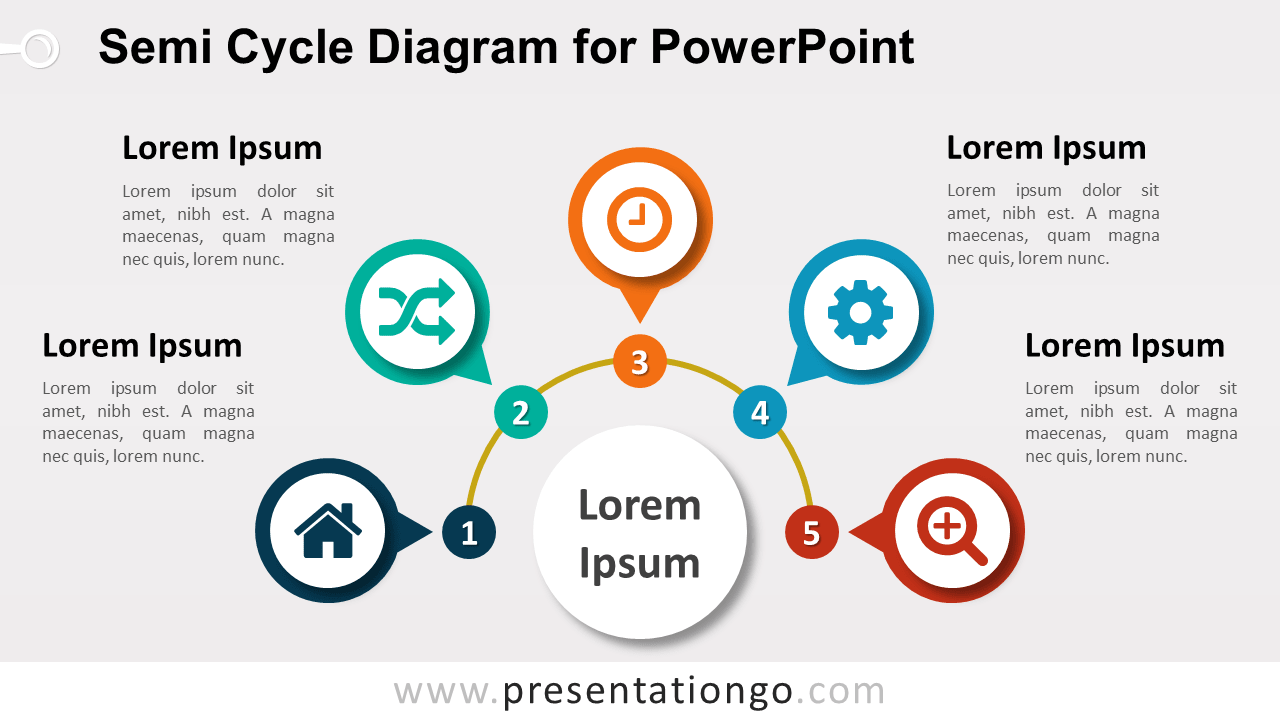
Free semi-cycle diagram for PowerPoint. Infographic design with 5 circular stages. Great as a timeline or to represent a series of interconnected ideas.
Free semi-cycle diagram for PowerPoint. Colored infographic design with 5 circular stages. Sequence of 5 stages, tasks, or events in a circular flow.
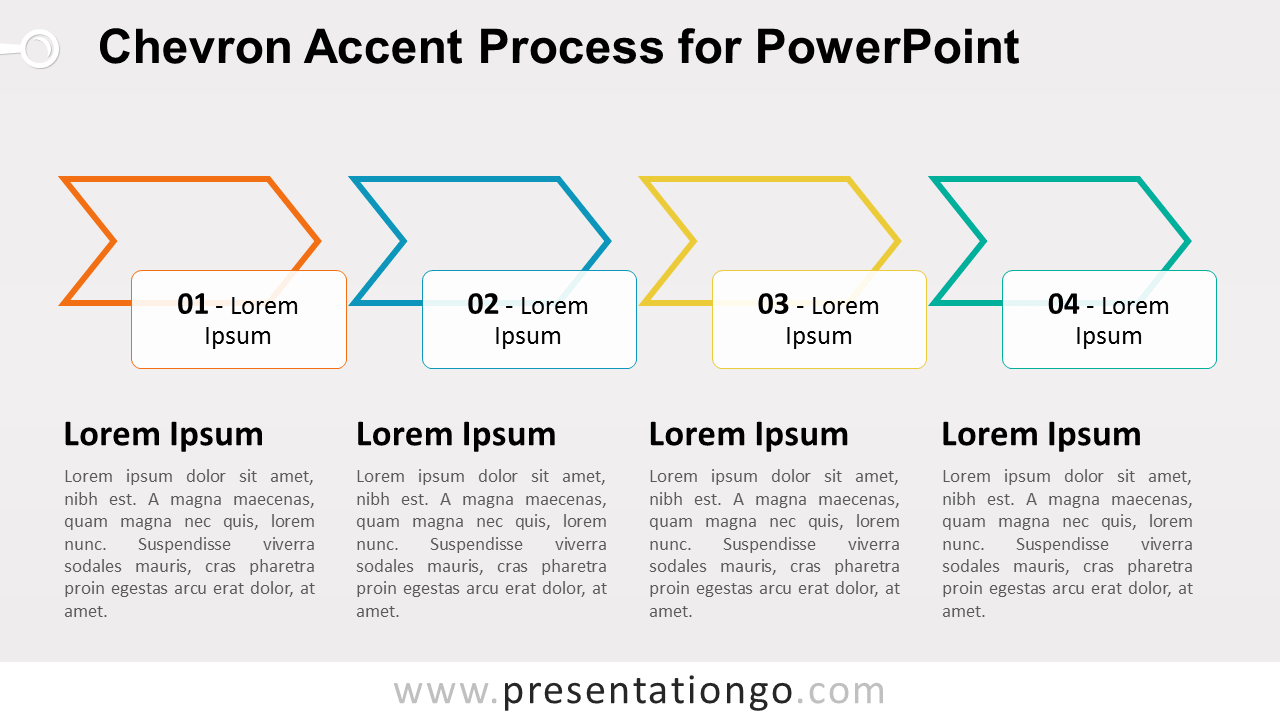
Free chevron accent process for PowerPoint. SmartArt graphic layout. Use this diagram to show sequential steps in a task, process, or workflow.
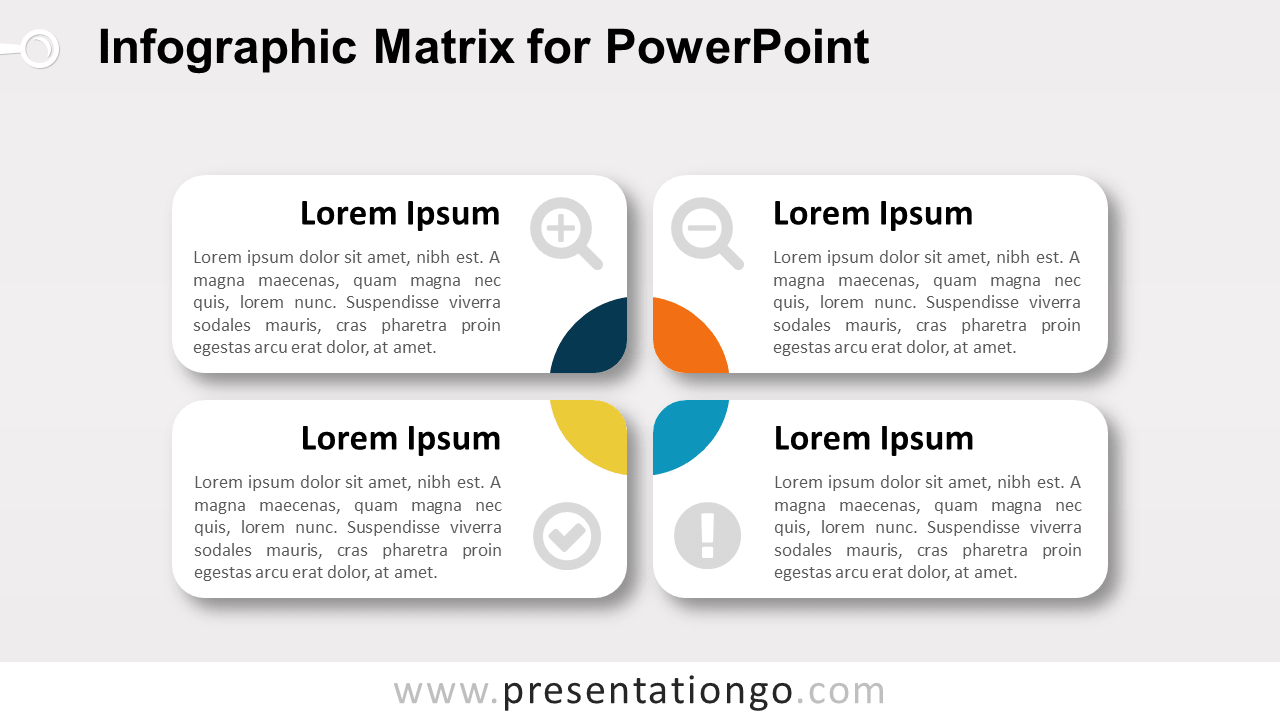
Free infographic matrix for PowerPoint. Editable graphics. Great to be used for business or marketing matrices like BCG, SWOT, Ansoff.
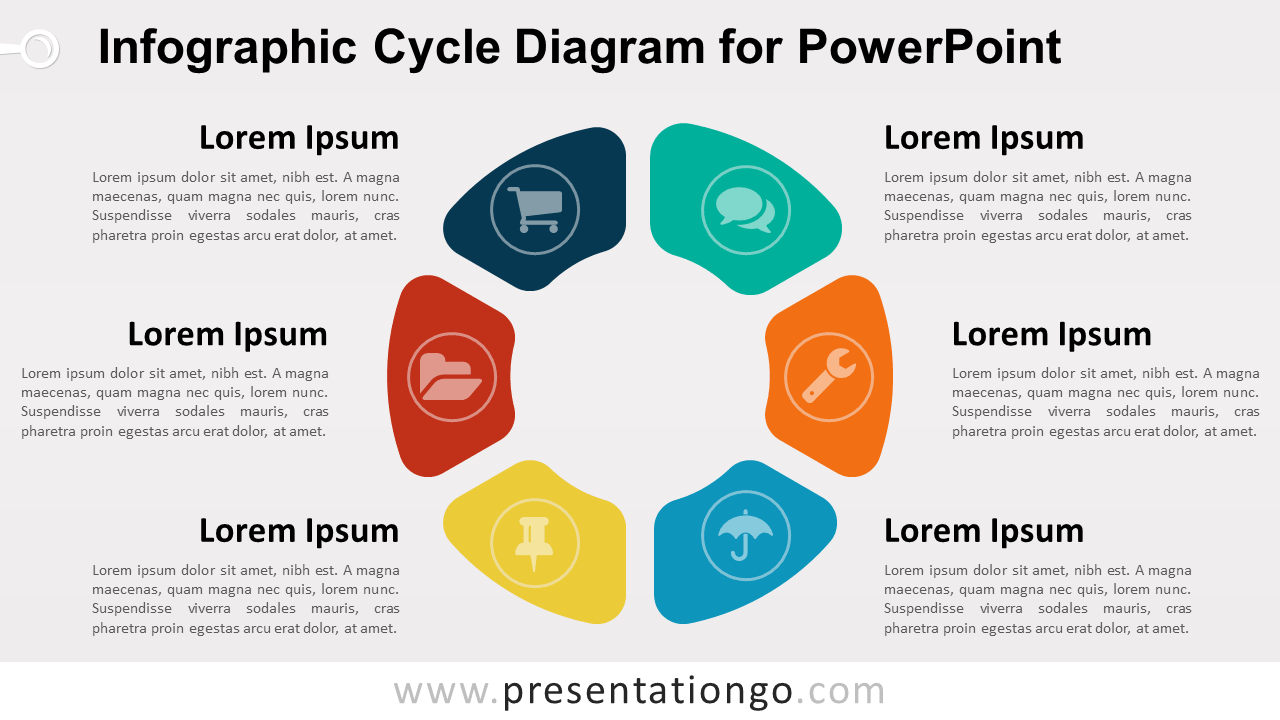
Free infographic cycle diagram for PowerPoint. Colored graphic design with 6 circular stages. Continuing sequence of 6 stages or events.
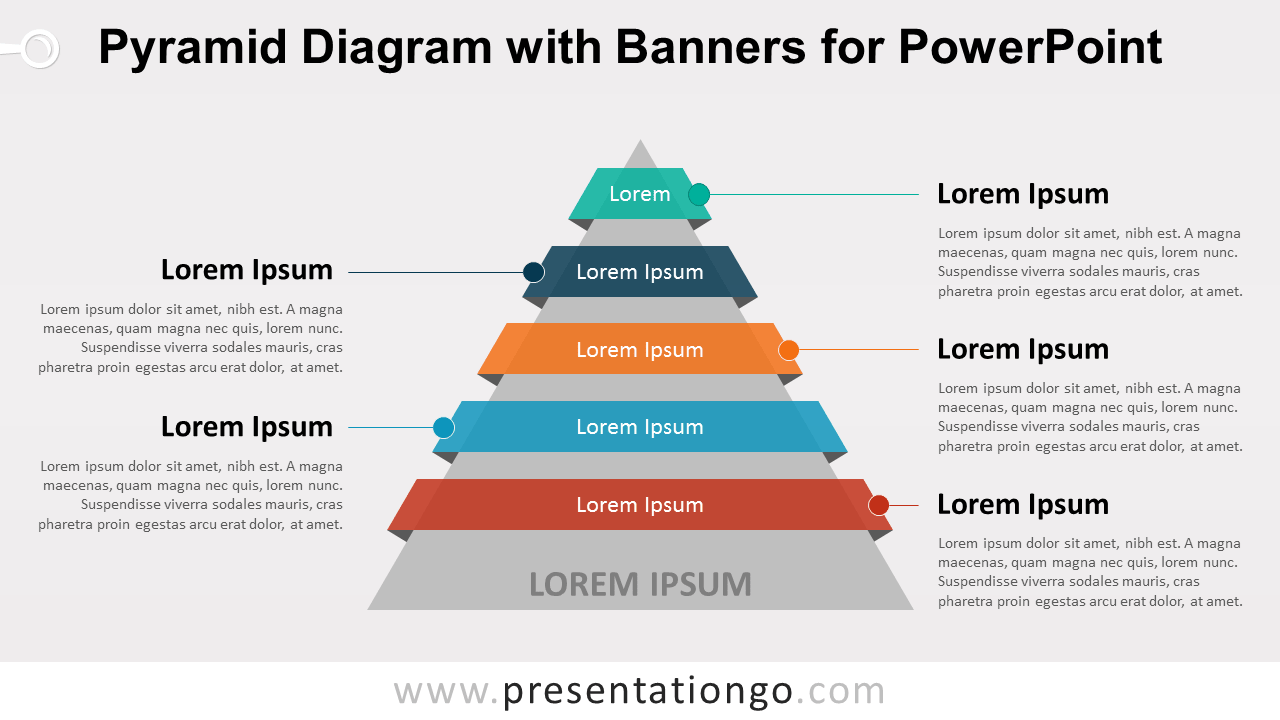
Free pyramid diagram with banners or ribbons for PowerPoint. Use this to show interconnected, or hierarchical relationships of 5 elements.
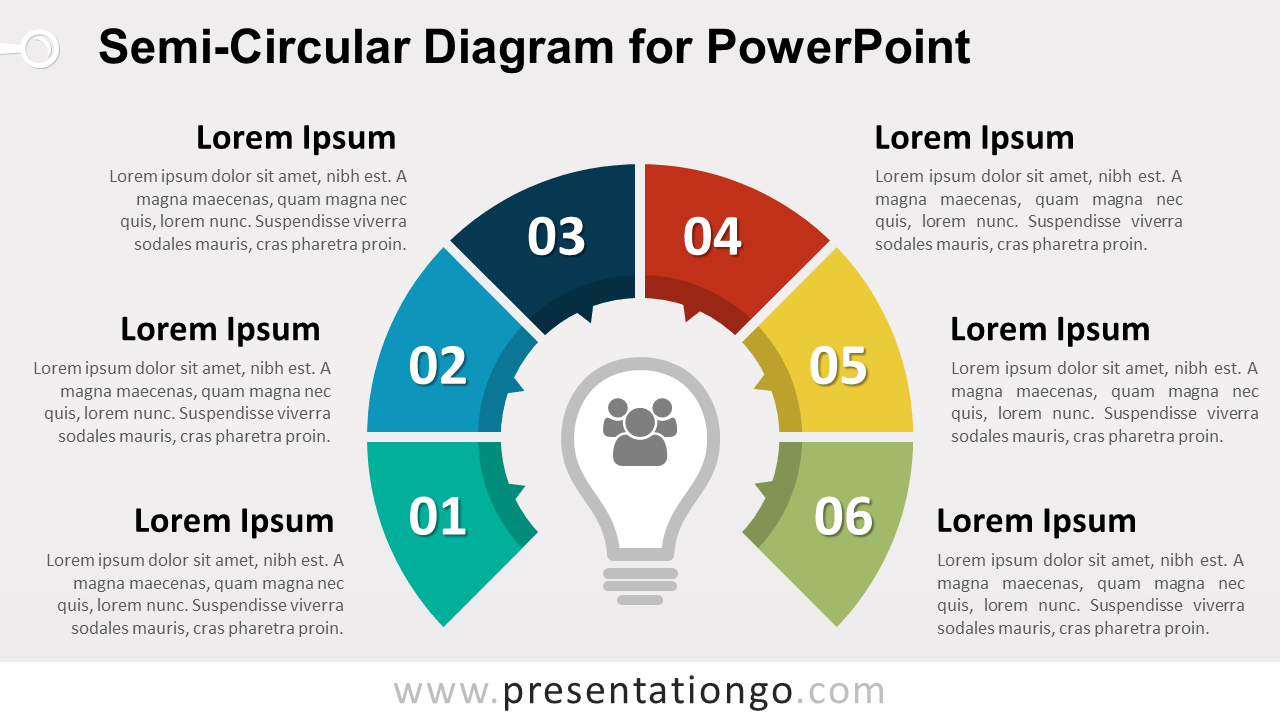
Free semi-circular diagram for PowerPoint. Colored graphic design with 6 steps and a light bulb in the center. Editable graphics.
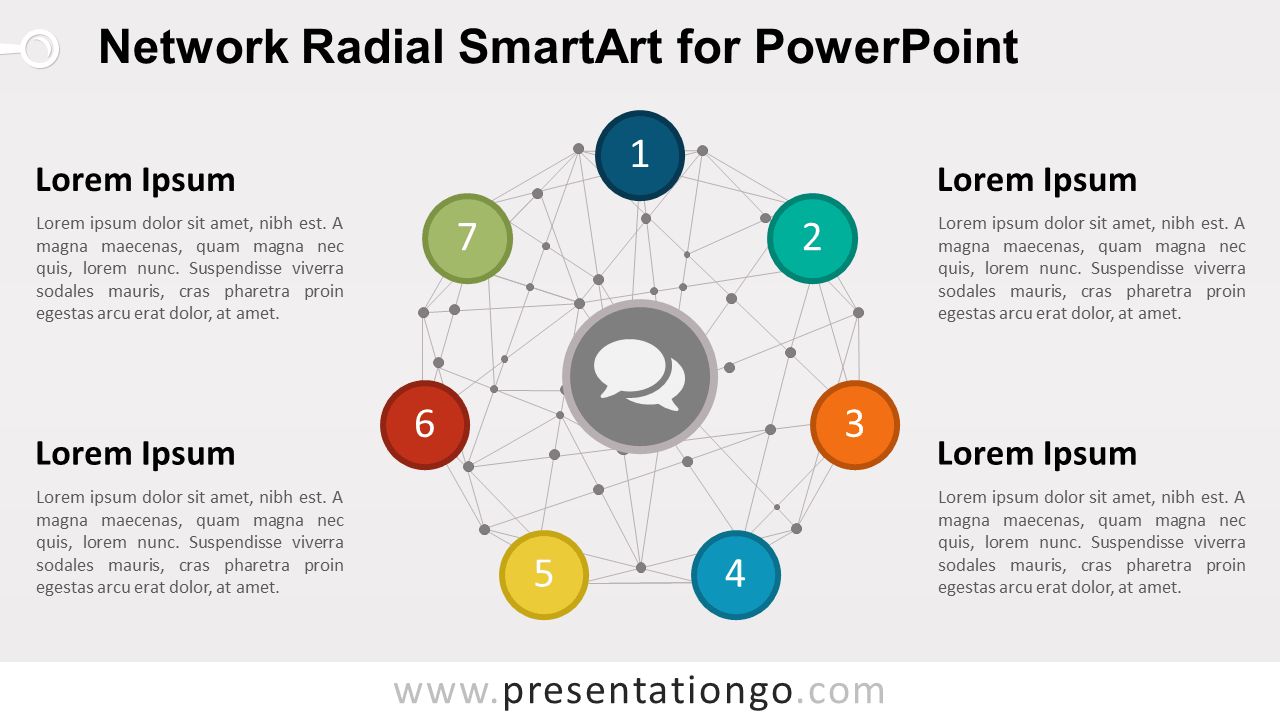
Free radial template with network for PowerPoint. Radial SmartArt graphic with a wire-frame network sphere. Colored graphic design.
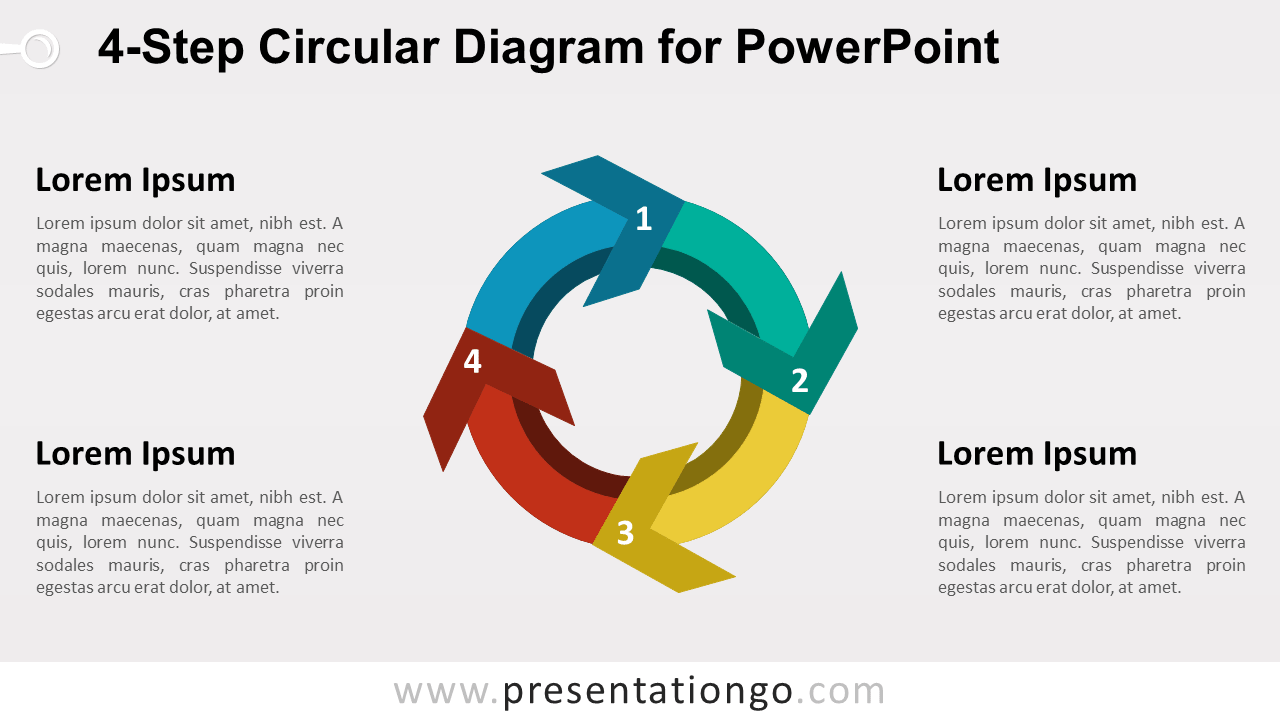
Free circular process diagram for PowerPoint with 4 steps (arrows). Illustrates a continuing sequence of stages in a circular flow.