Loading resources…
Total 1760 resources
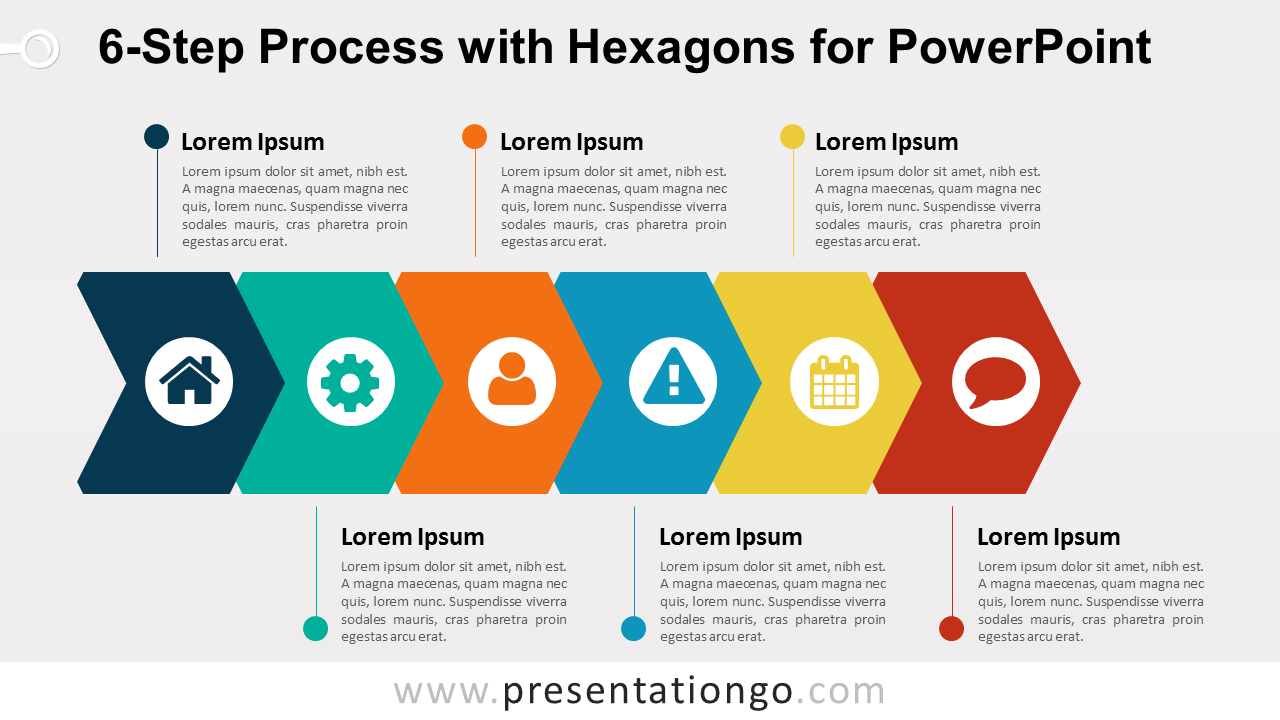
Free process diagram for PowerPoint with hexagon shapes horizontally aligned and stacked. Colored graphic design with 6 options.
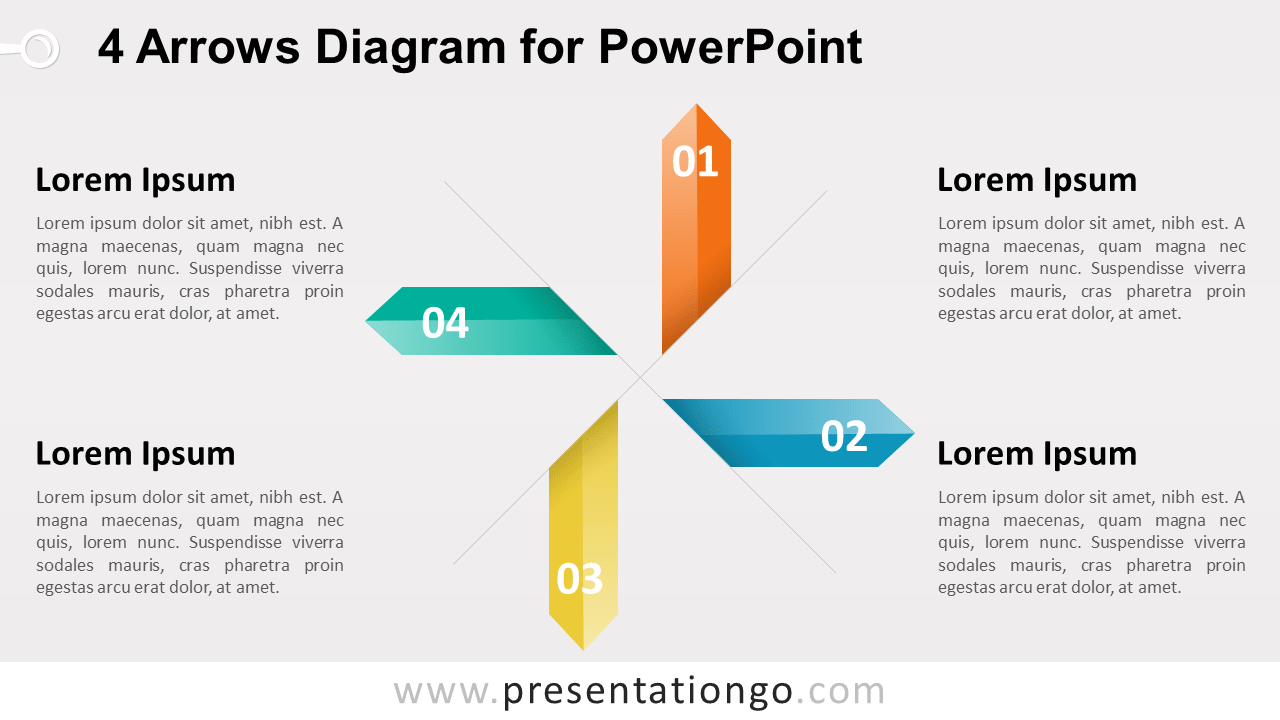
Free diagram for PowerPoint with 4 (pentagon) arrows pointing away from the center. Use this template to illustrate 4 ideas, concepts or as a matrix.
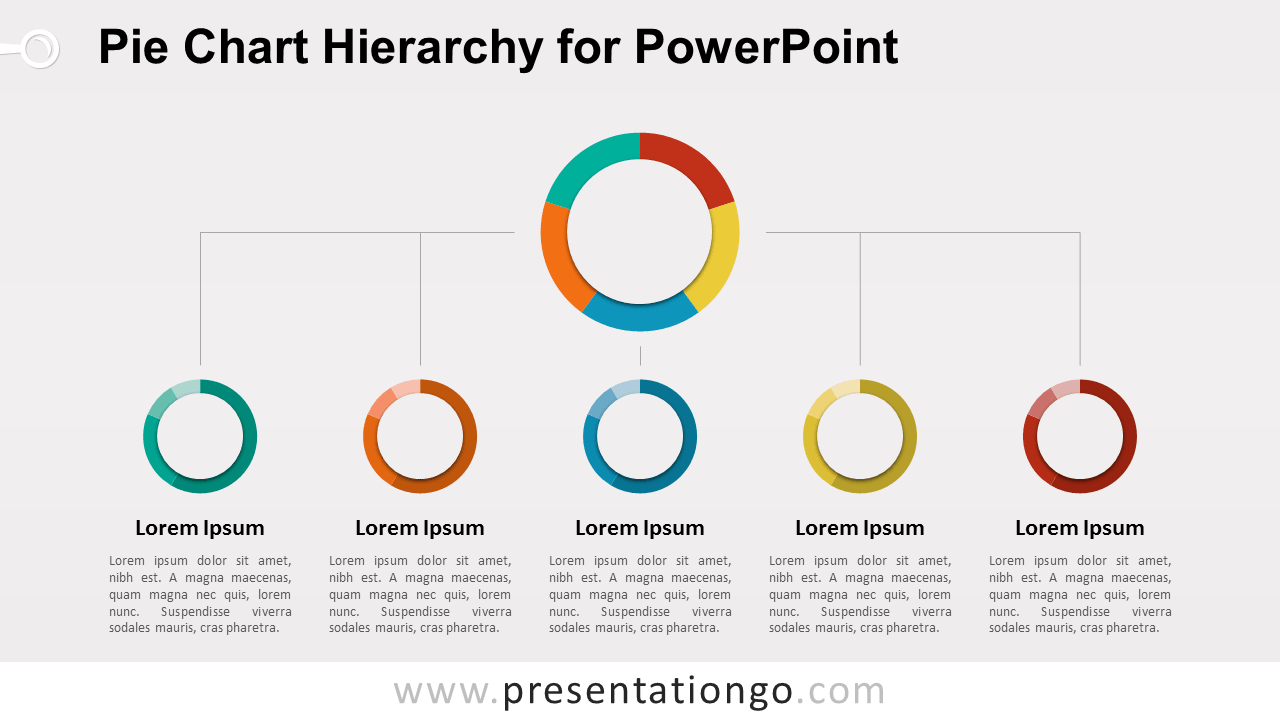
Free vertical hierarchy diagram for PowerPoint with data-driven pie-charts. Shows hierarchical relationships between various (quantitative) information.
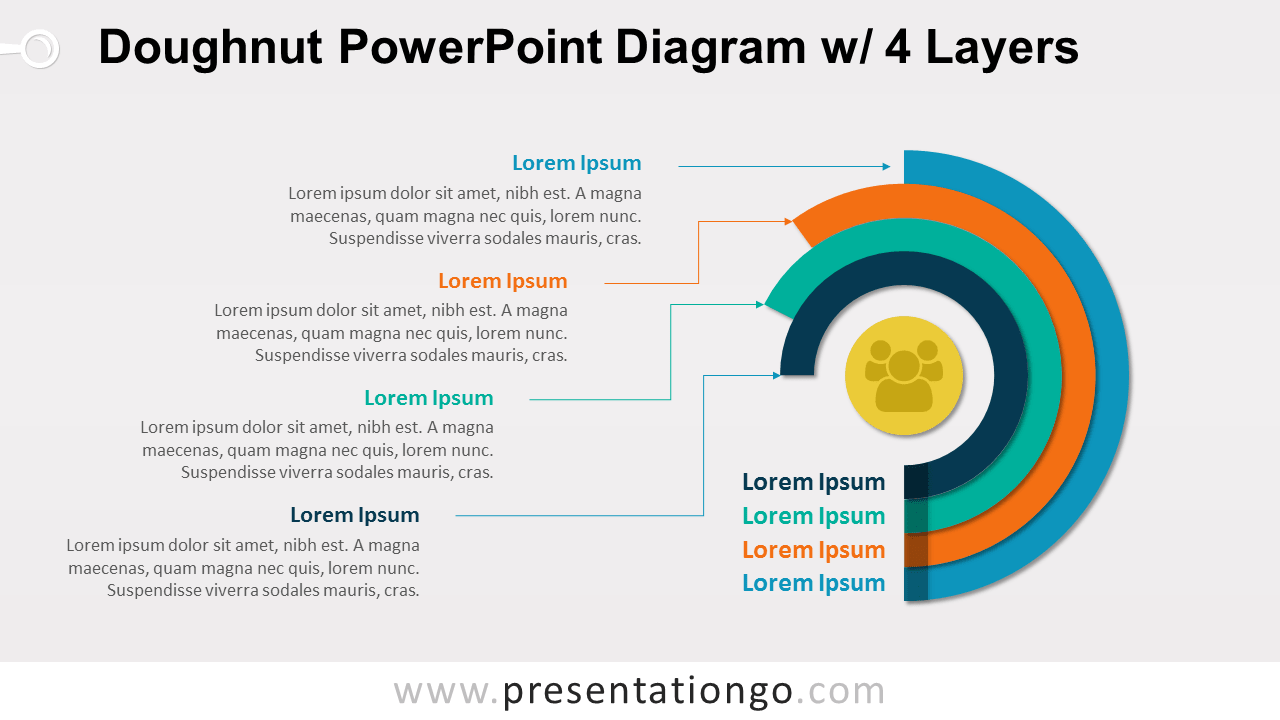
Free doughnut diagram with 4 layers for PowerPoint. Colored graphic design with 4 options. Editable graphics with text placeholder.
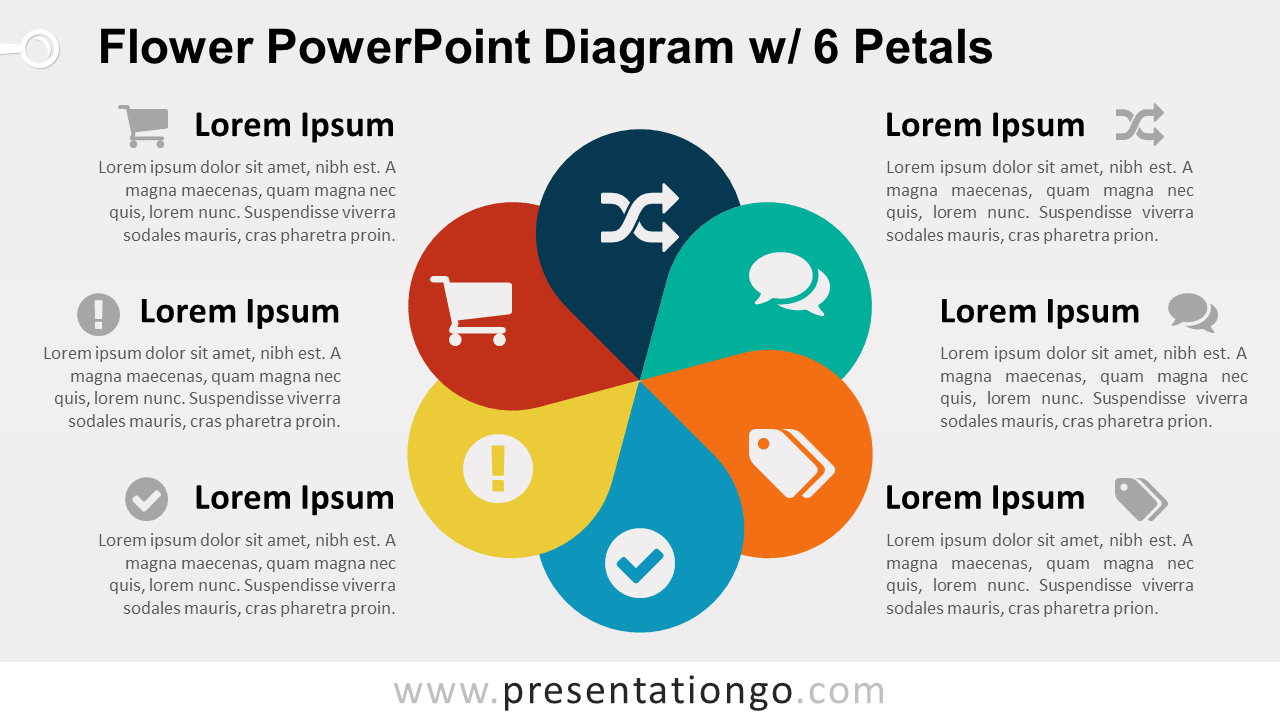
Free flower diagram with 6 petals for PowerPoint. Colored graphic design with 6 options. Editable graphics with text placeholder. Made with teardrop shapes.
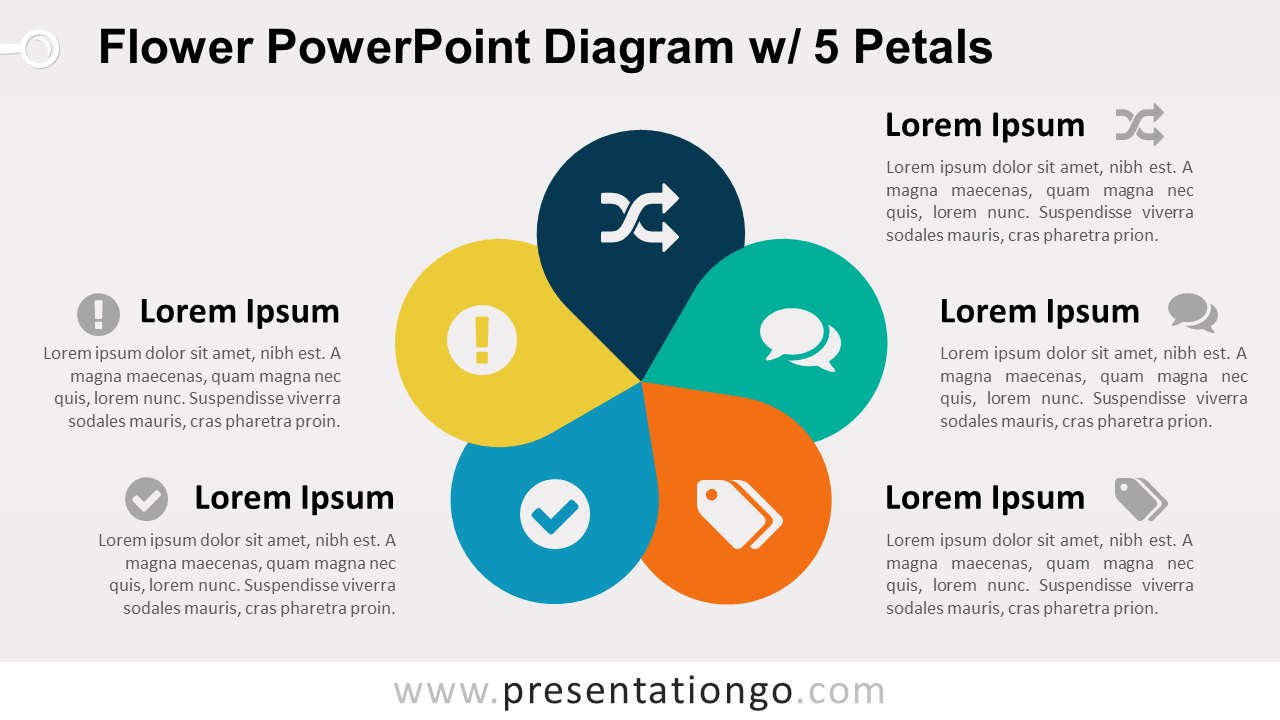
Free flower diagram with 5 petals for PowerPoint. Colored graphic design with 5 options. Editable graphics with text placeholder. Made with teardrop shapes.
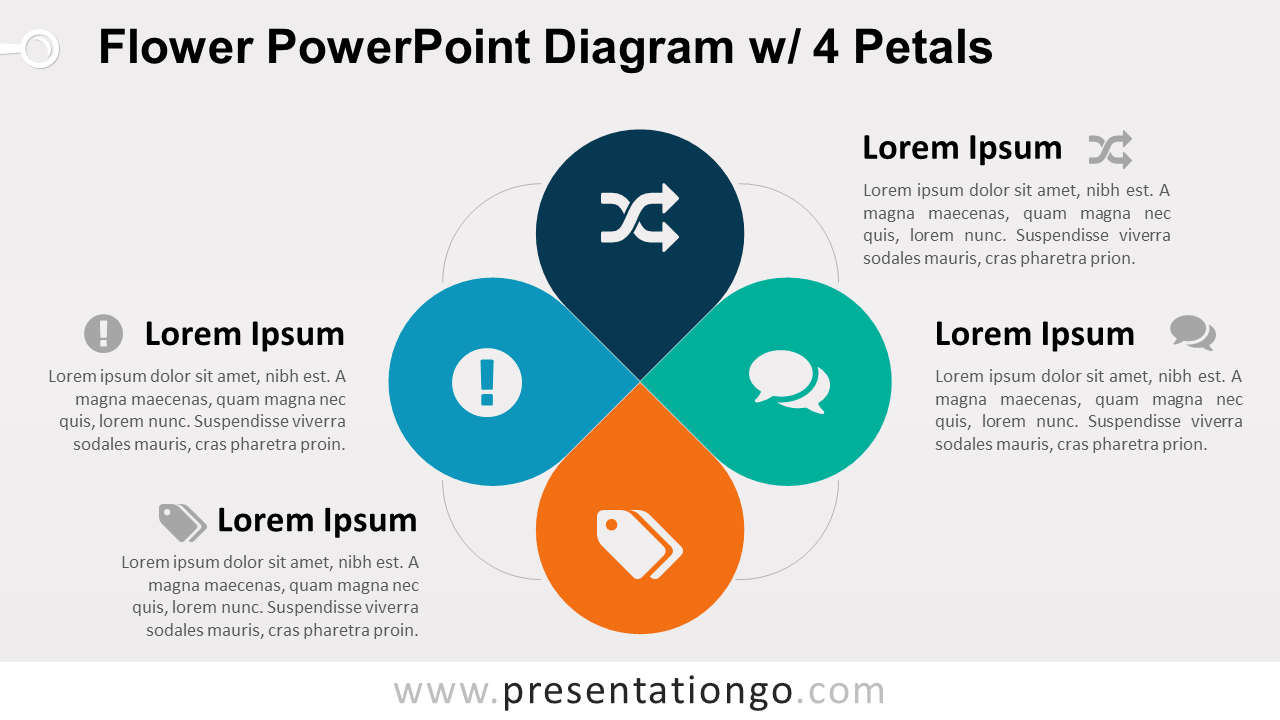
Free flower diagram with 4 petals for PowerPoint. Colored graphic design with 4 options. Editable graphics with text placeholder. Made with teardrop shapes.
Free 6-layer cuboid diagram for PowerPoint. 6 stacked 3D cuboid colored shapes. To illustrate 6 steps, ideas or concepts or conversions. Editable shapes.
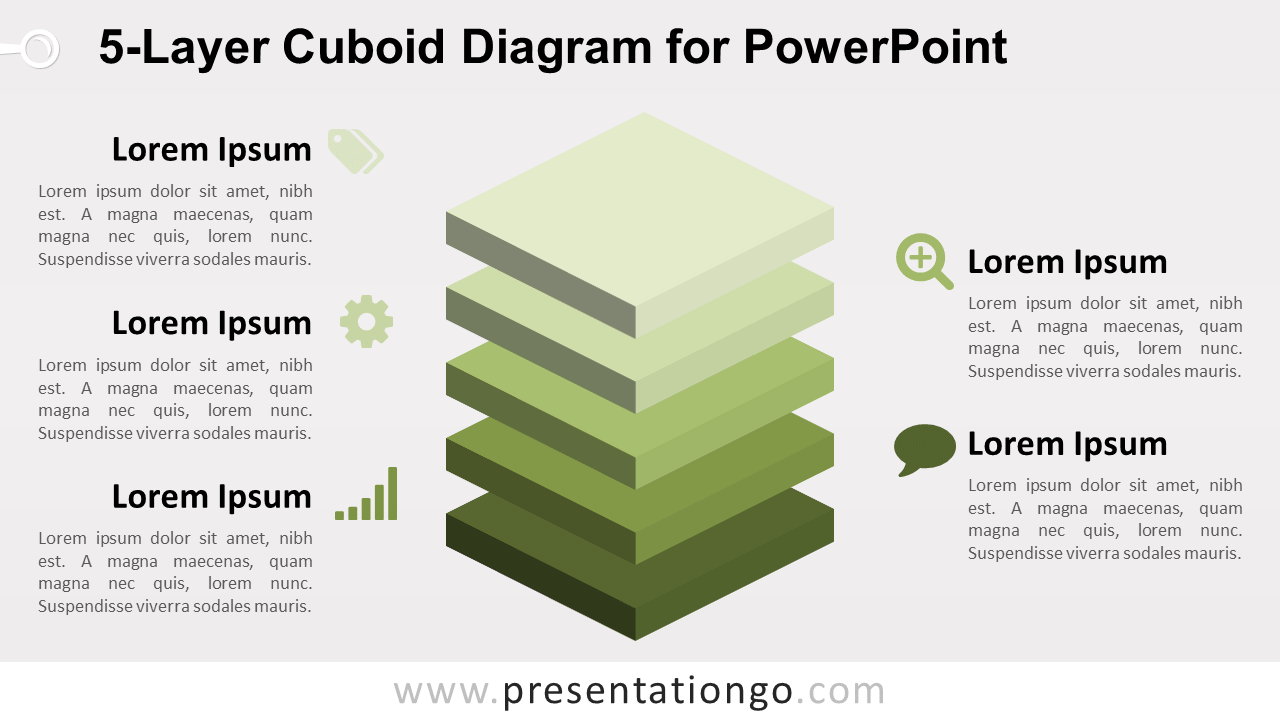
Download the 5-Layer Cuboid Diagram for PowerPoint with five editable 3D layers and text areas for hierarchies, components, priorities, or concepts.
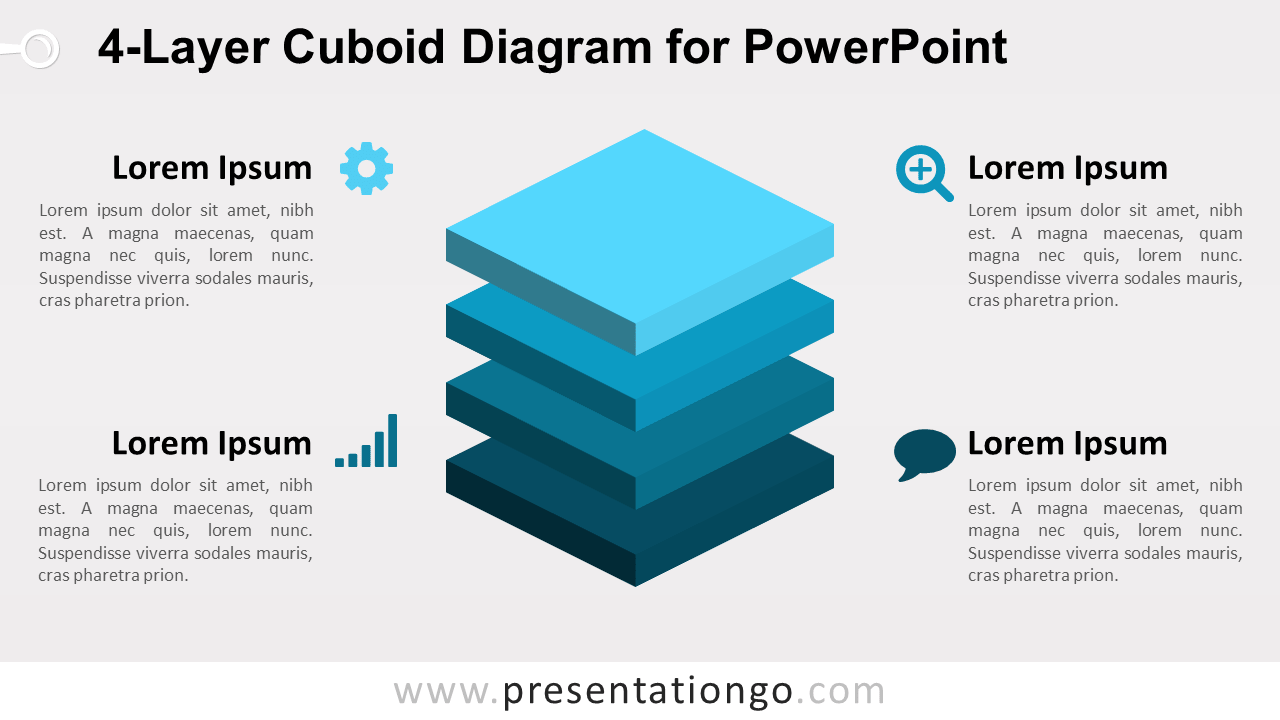
Download the 4-Layer Cuboid Diagram for PowerPoint with four editable 3D layers and text areas for levels, components, priorities, or concepts.
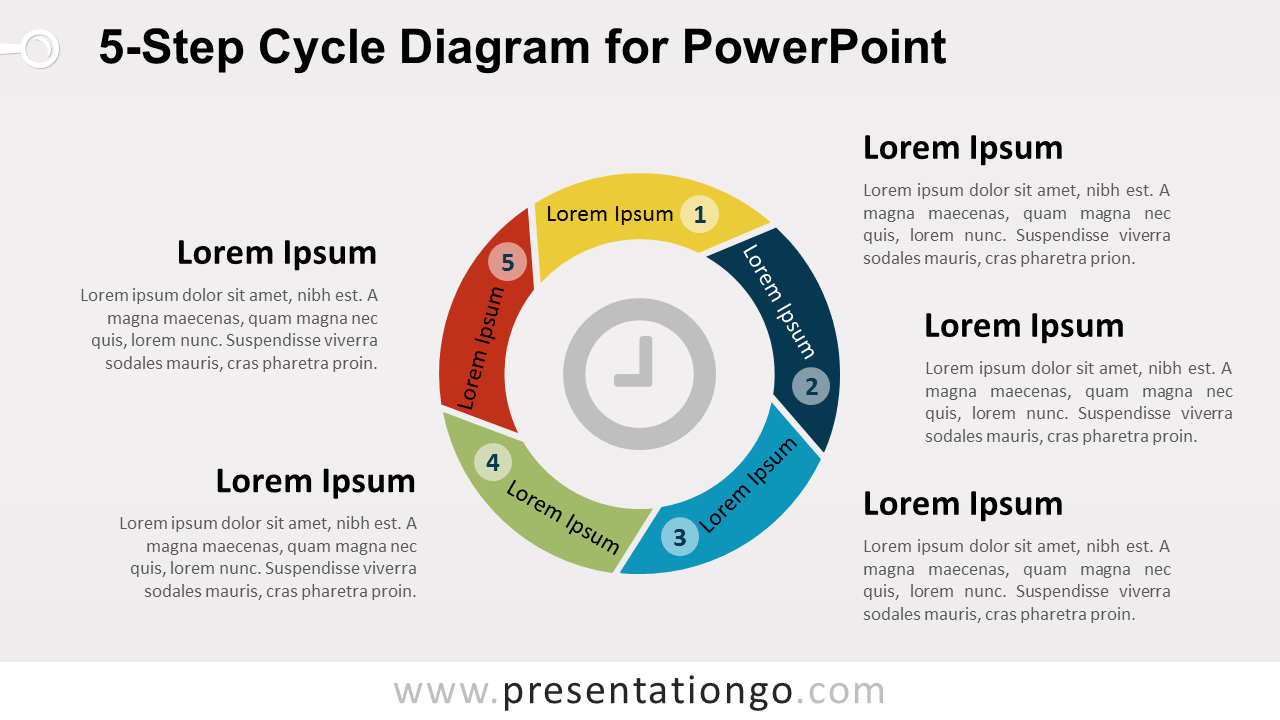
Download the 5-Step Cycle Diagram for PowerPoint with five editable stages, numbered segments, text areas, and a circular layout for recurring processes.
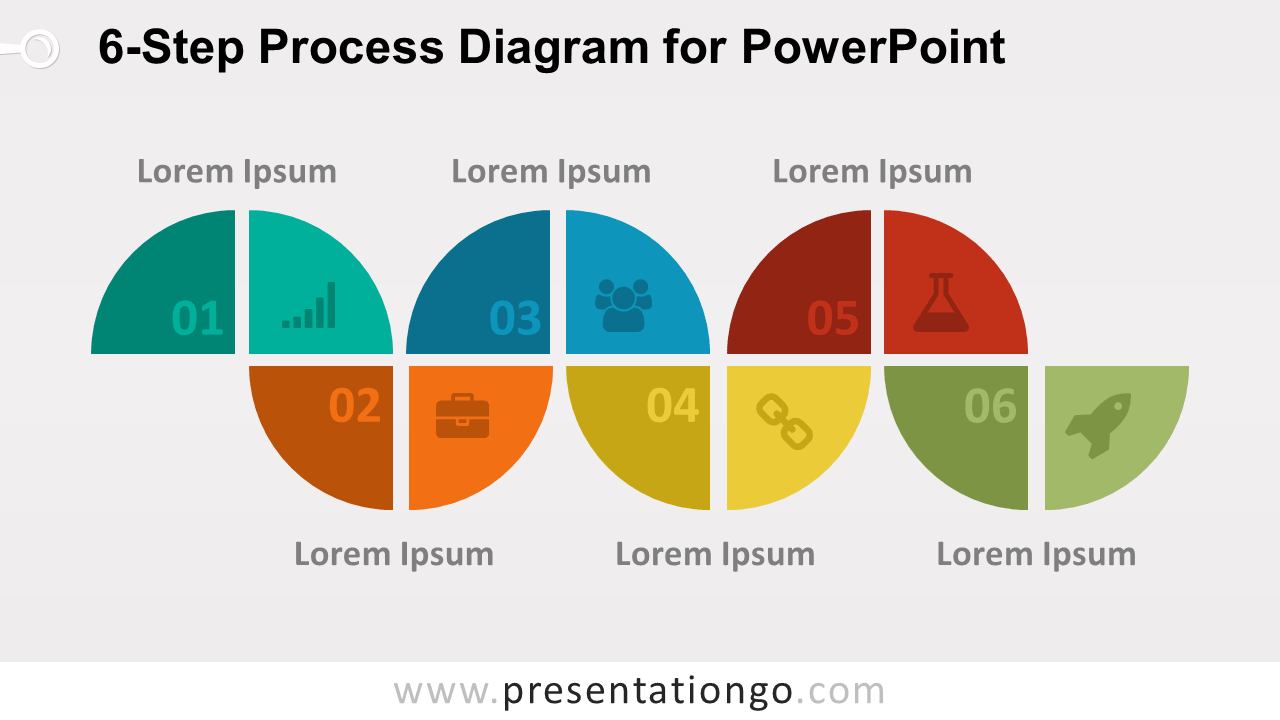
Download the 6-Step Process Diagram for PowerPoint with six editable stages, numbered sections, icon placeholders, and text areas for workflows.
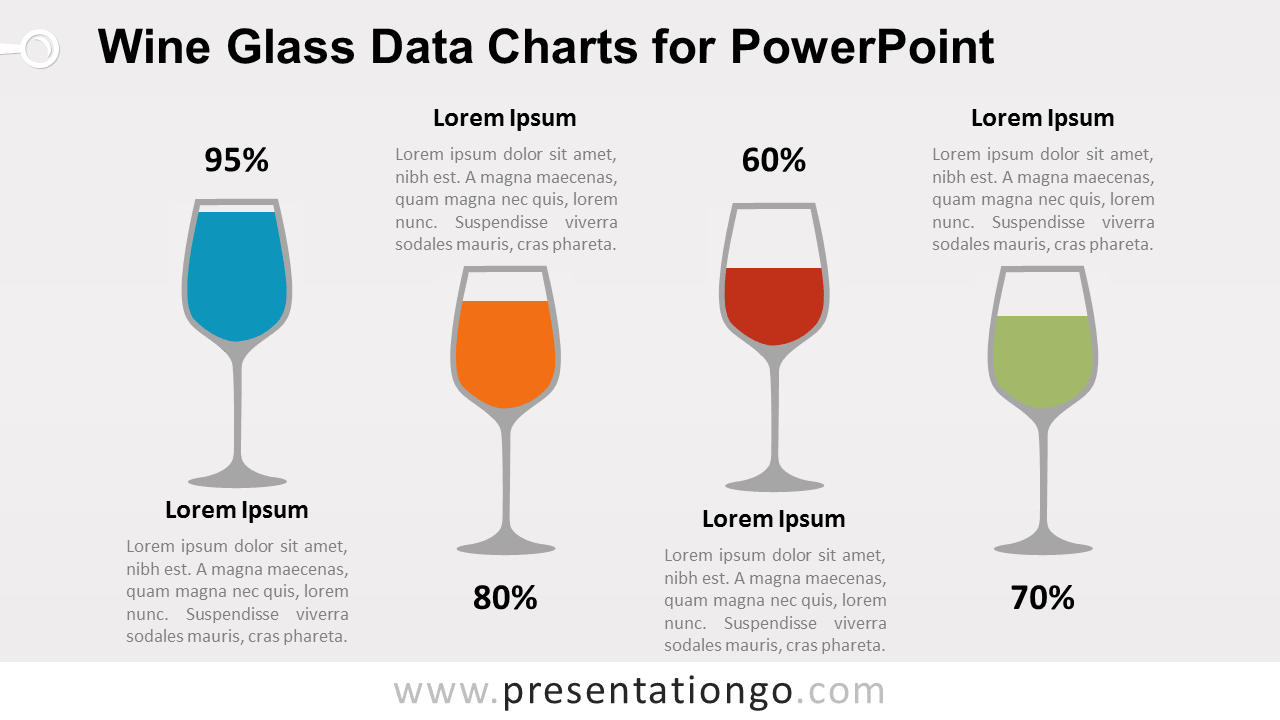
Download Wine Glass Charts for PowerPoint with editable data-driven charts, 2 slides, and wine glass visuals for percentage comparison presentations.
Free chemical tube test charts for PowerPoint. 2 tube tests with on a stand. Data-driven charts. Great for healthcare, science, business PPTX presentations.
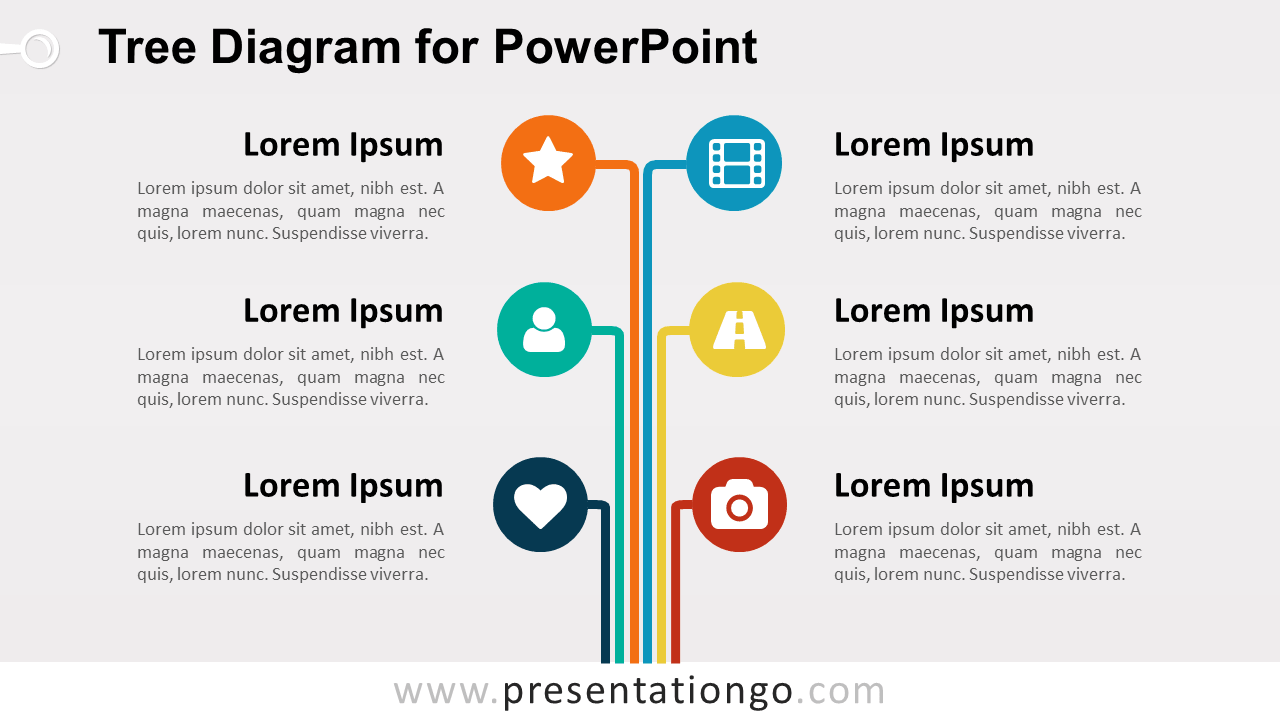
Download the Tree Diagram for PowerPoint with six editable branches, icon placeholders, and text areas for categories, roles, topics, and key concepts.
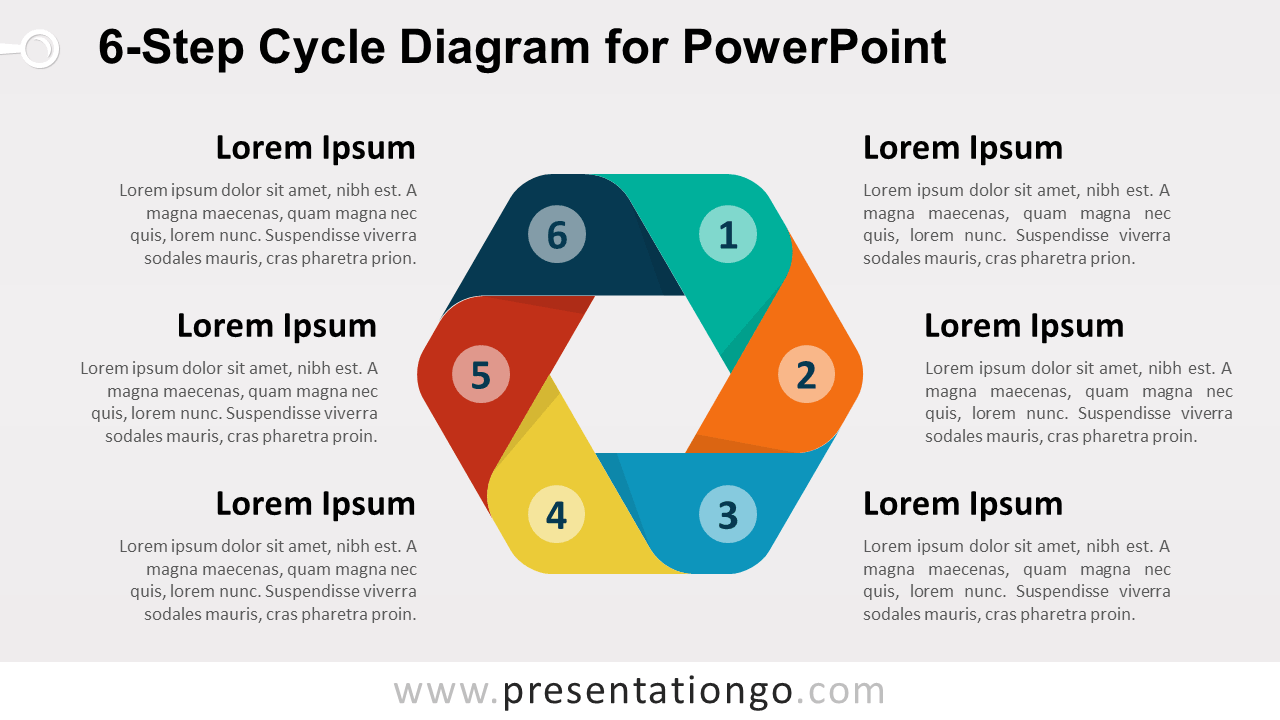
Download the 6-Step Cycle Diagram for PowerPoint with six editable stages for workflows, recurring processes, strategic cycles, and continuous improvement.
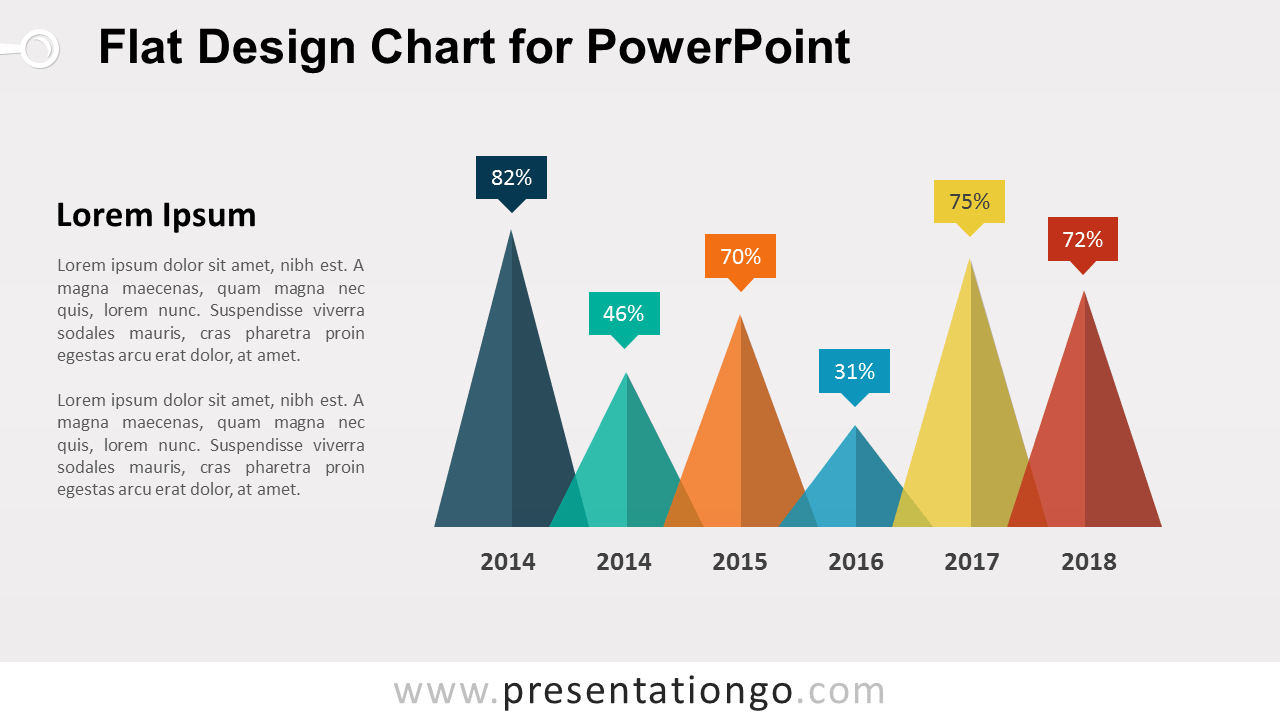
Download the Flat Design Triangle Chart for PowerPoint with six editable triangular data points for percentages, KPIs, trends, and performance comparisons.
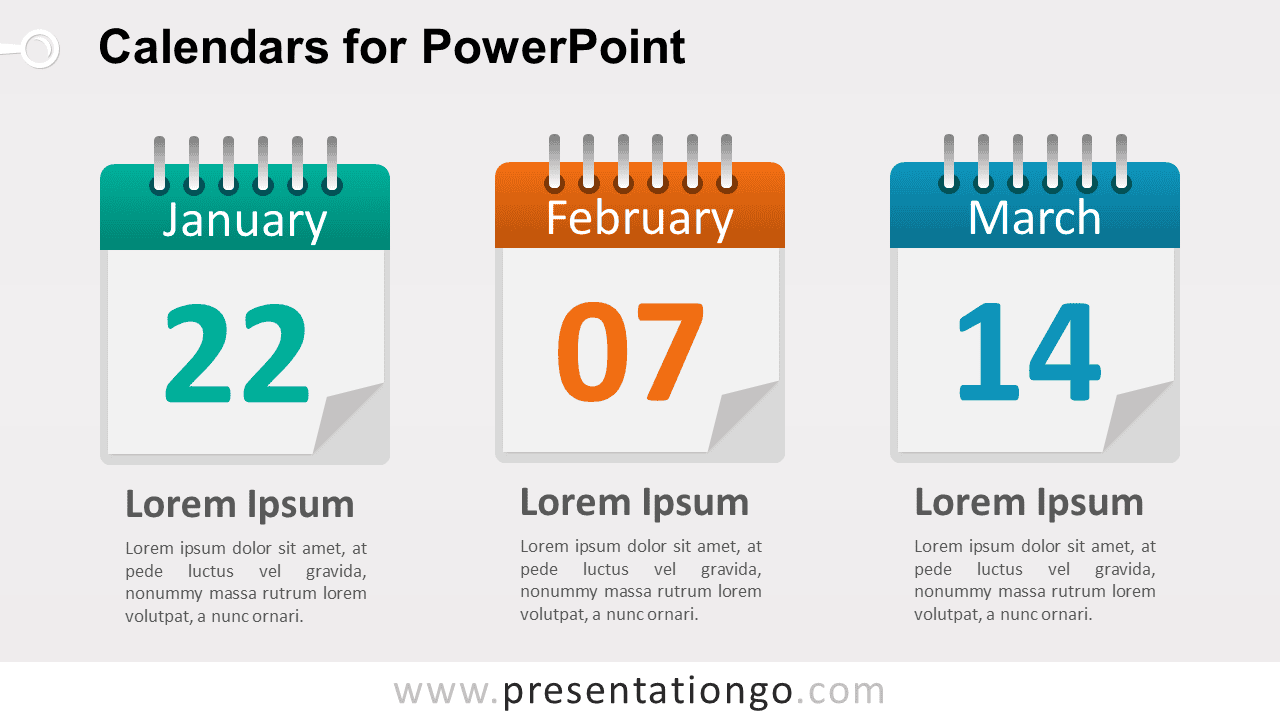
Download the 3 Calendars Diagram for PowerPoint with three editable calendar cards for dates, milestones, deadlines, events, and monthly highlights.
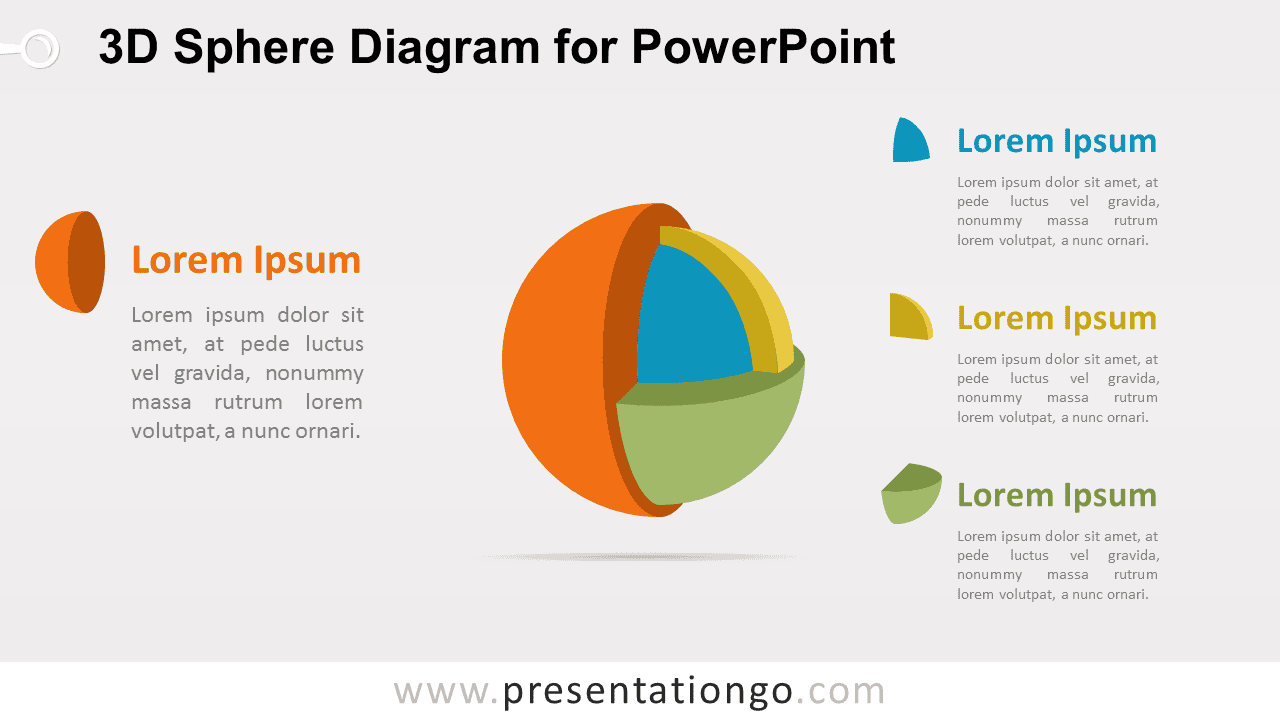
Download the 3D Sphere Diagram for PowerPoint with four editable sphere segments for frameworks, systems, components, models, and business concepts.
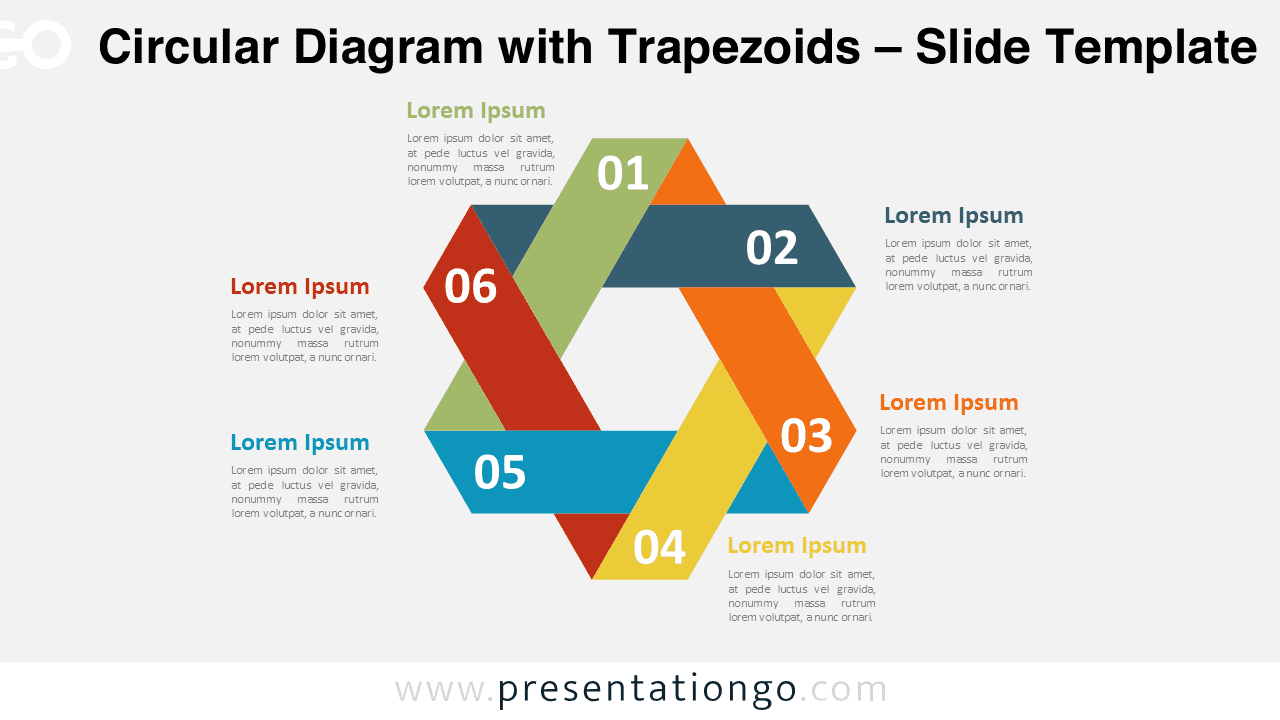
Free circular diagram for PowerPoint made of crossed trapezoid shapes. Diagram with 6 steps or options. Editable graphics with text placeholder. 2 slides.
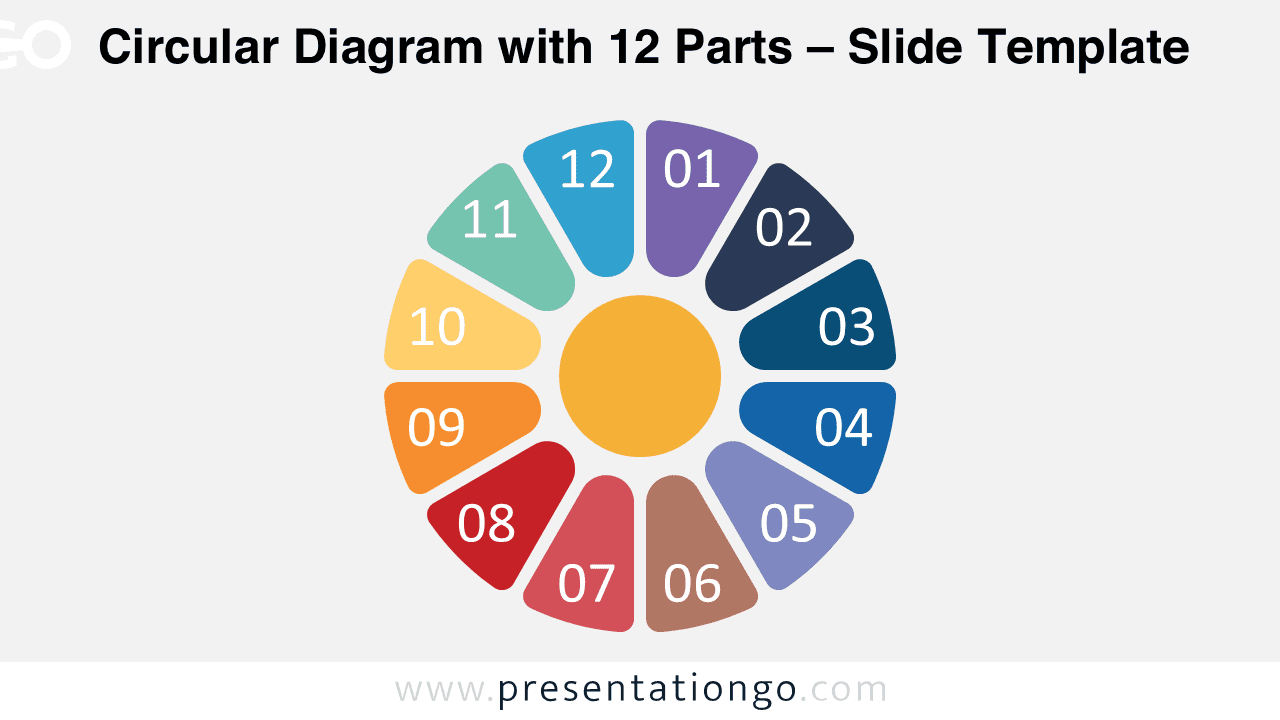
Free PowerPoint circular diagram with 12 parts or pies. Editable graphics. Use this template for 12 ideas or concepts in a cycle flow.
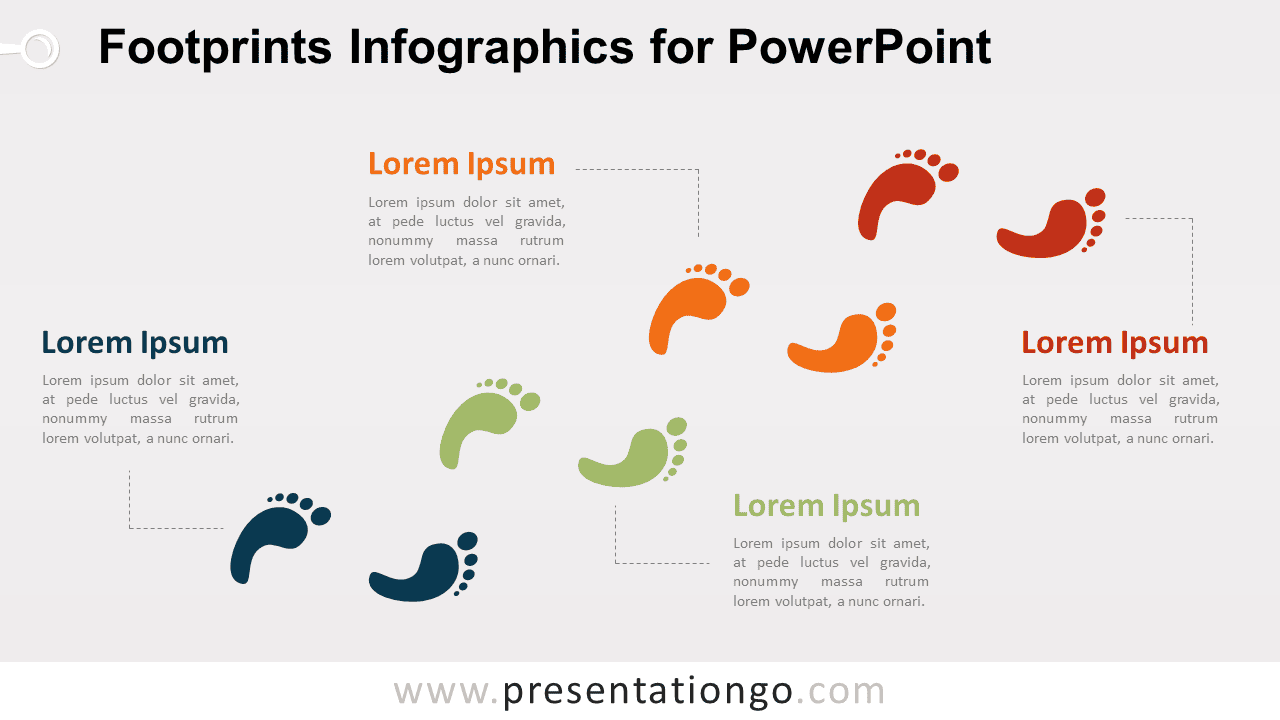
Use Footprints Infographics for PowerPoint to present four stages, milestones, journey steps, project phases, or progress points in one visual path.
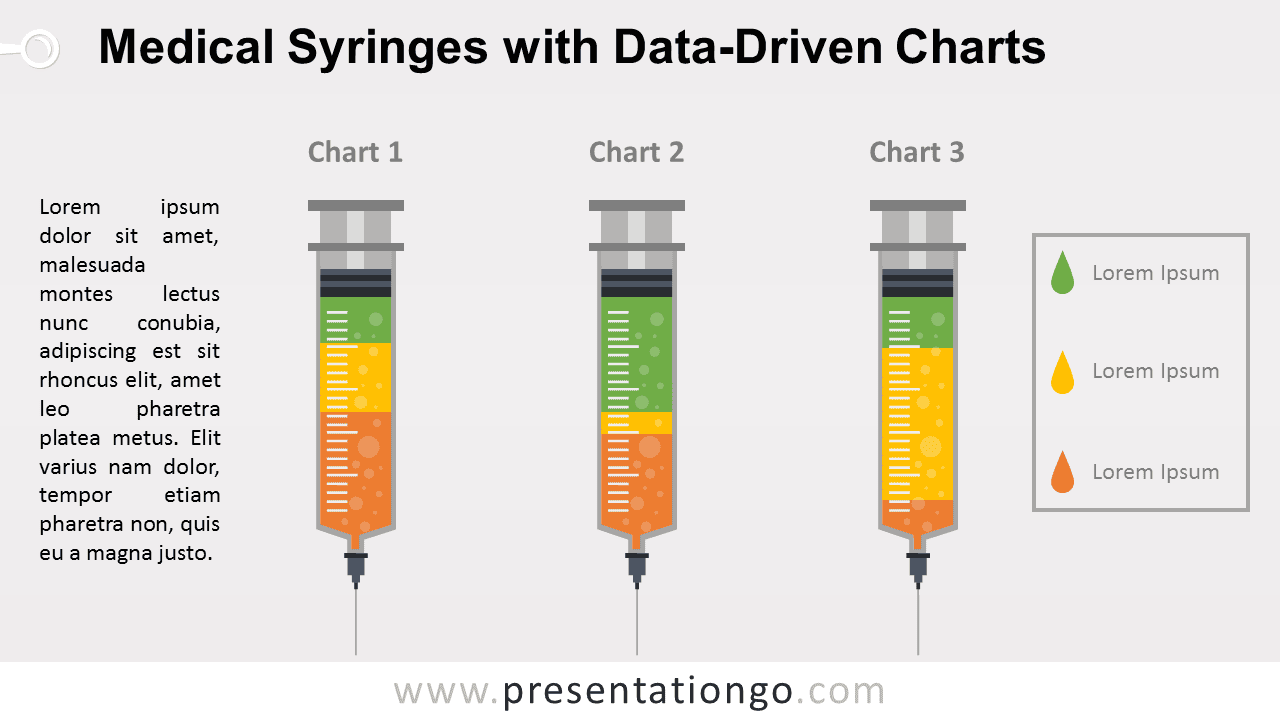
Download the Medical Syringes Chart for PowerPoint with three editable syringe charts for healthcare data, comparisons, research, and medical reports.
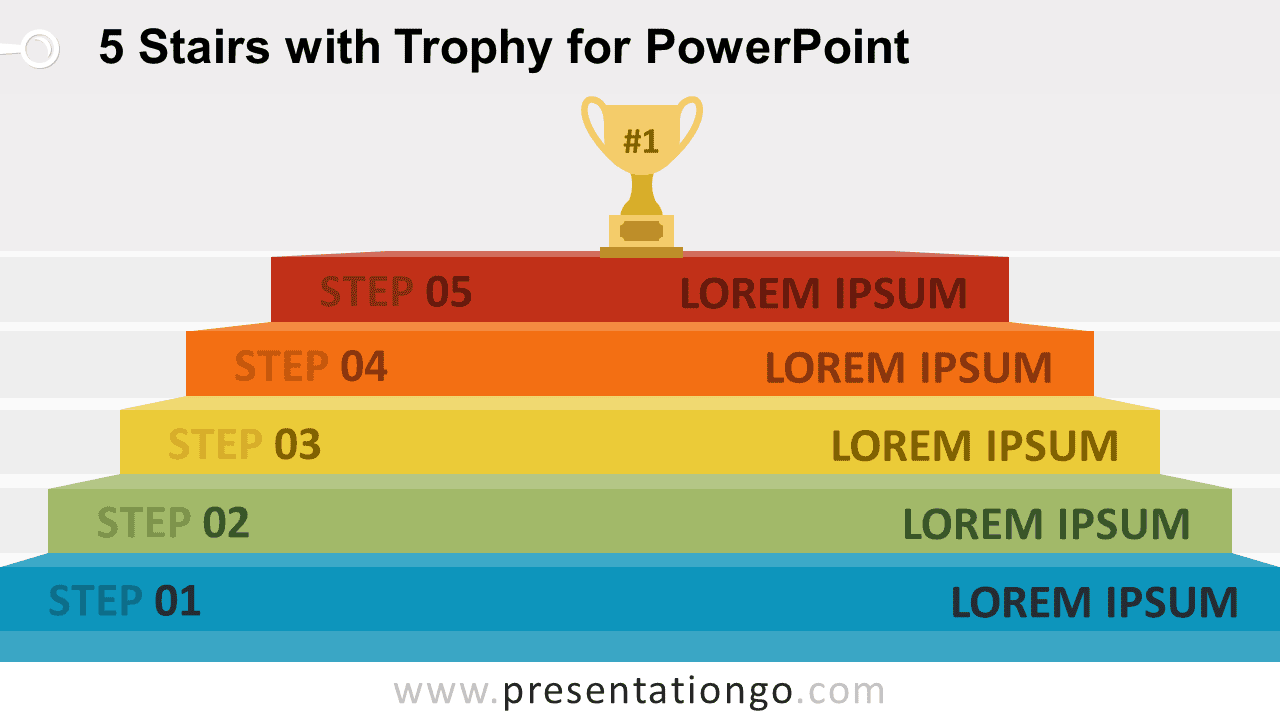
Download the 5 Stairs with Trophy Diagram for PowerPoint with five editable steps for goals, milestones, progress, achievement, and success paths.