Loading resources…
Total 3480 resources
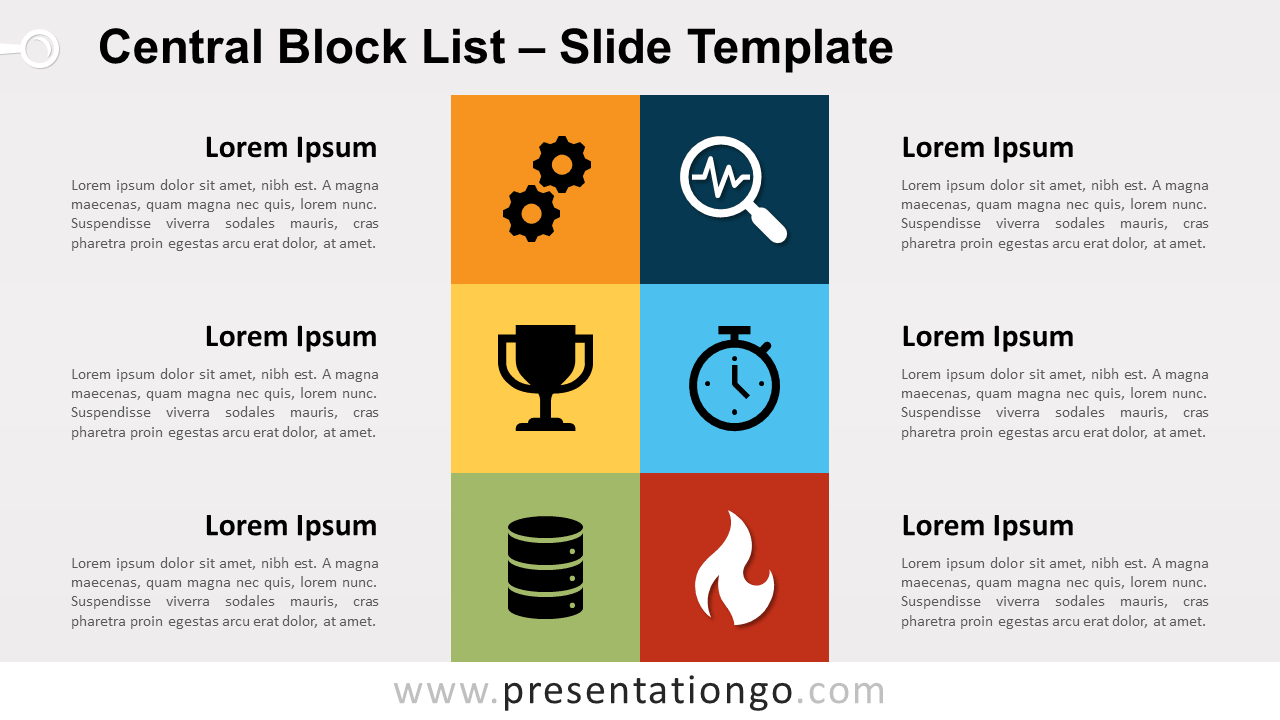
Free central block list for PowerPoint and Google Slides. Keep your slides simple! Simple yet efficient slide template with colorful square blocks.
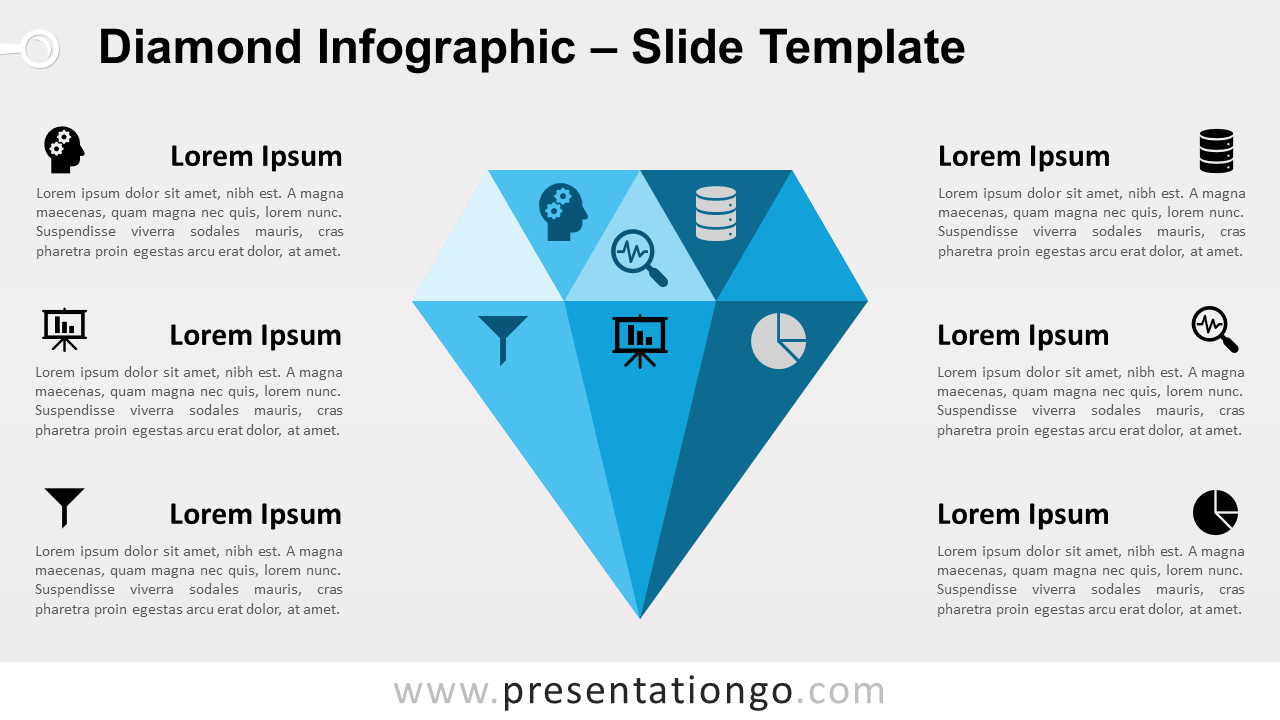
Free diamond infographic for PowerPoint and Google Slides. Flat design illustration of a blue diamond. A rich multi-faceted analogy for presentations.
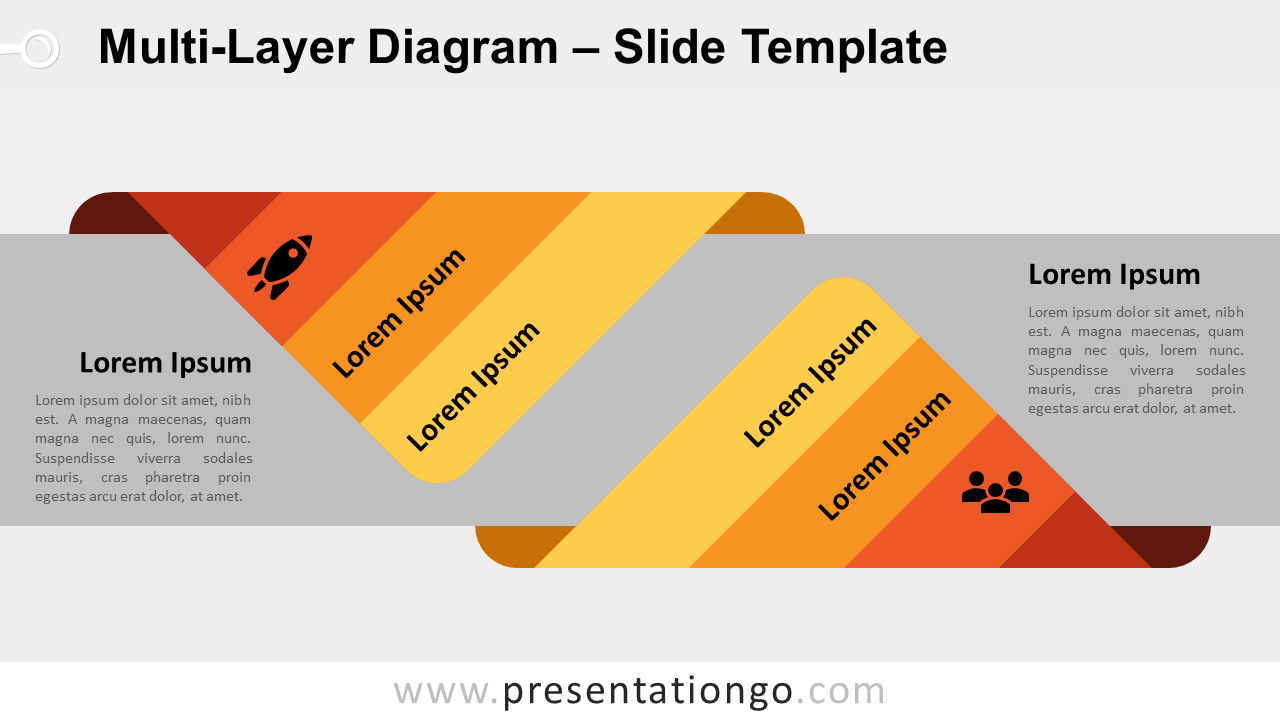
Free multi-layer diagram for PowerPoint and Google Slides. Diagram designed with folded banners and a horizontal central banner. Editable graphics.
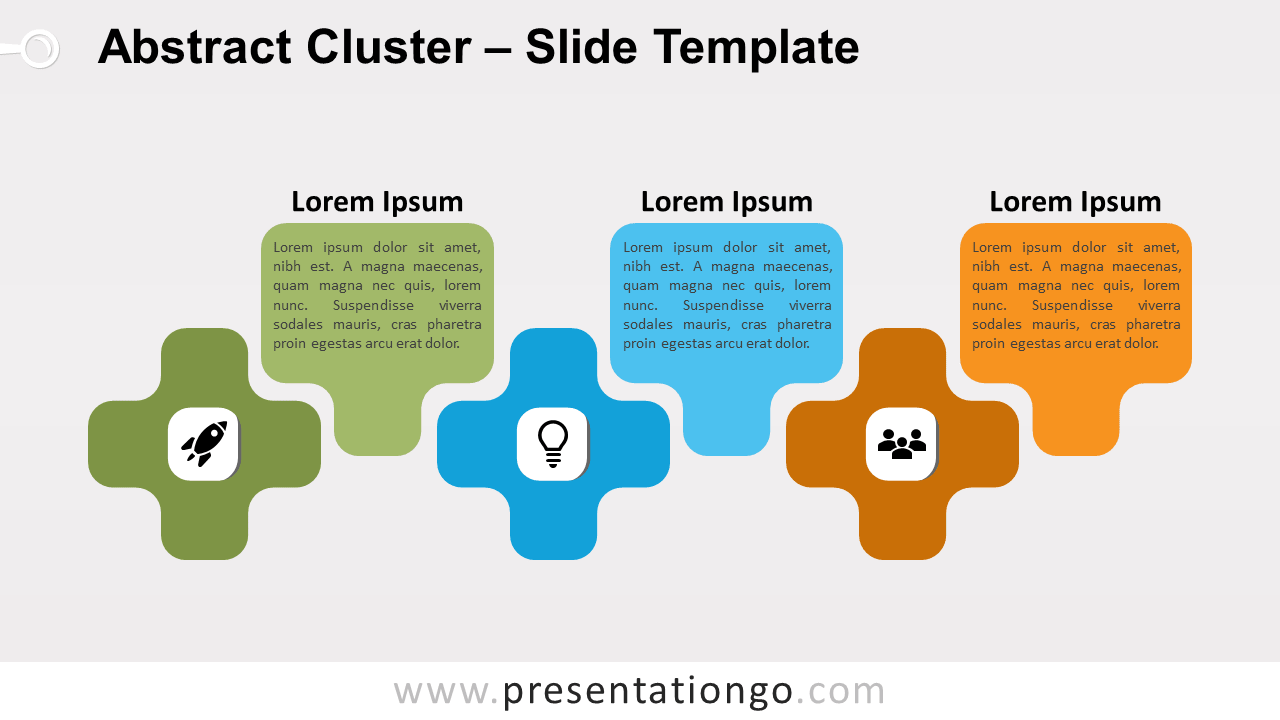
Free abstract cluster for PowerPoint and Google Slides. Set of interlocked Greek crosses associated with a block of text. A multipurpose diagram your slides.
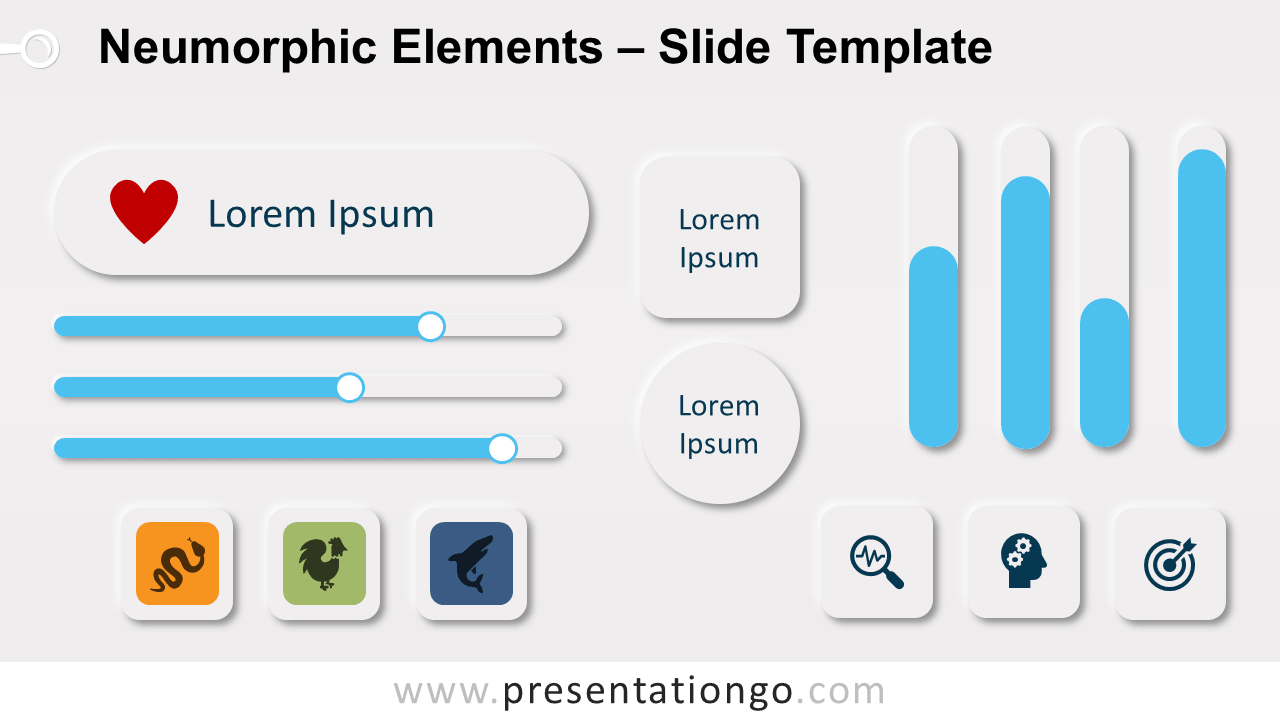
Free neumorphic elements for PowerPoint and Google Slides. Set of rounded infographic elements like buttons and progress bars. Editable graphics.
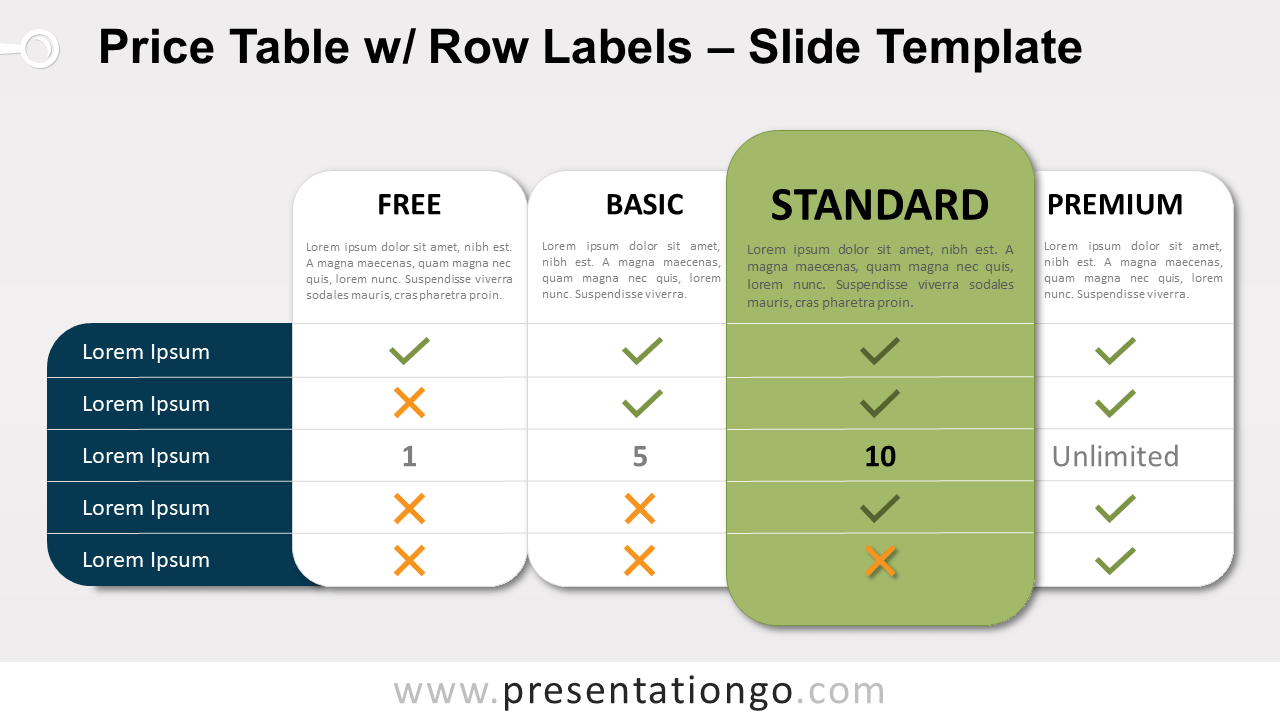
Free price table with row labels for PowerPoint and Google Slides. Simple pricing table with rounded shapes. Quickly visualize and compare your plans.
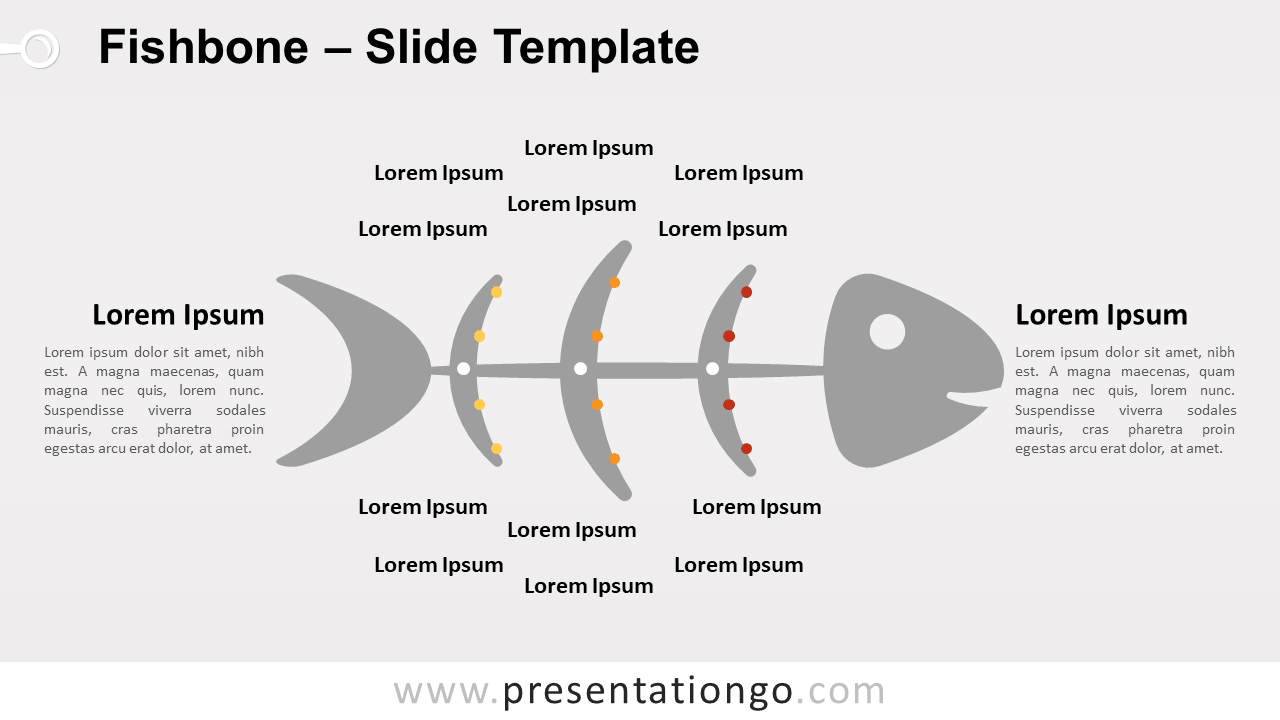
Free fishbone for PowerPoint and Google Slides. Illustration of a fish's skeleton with colorful dots. Creative infographic causal diagram.
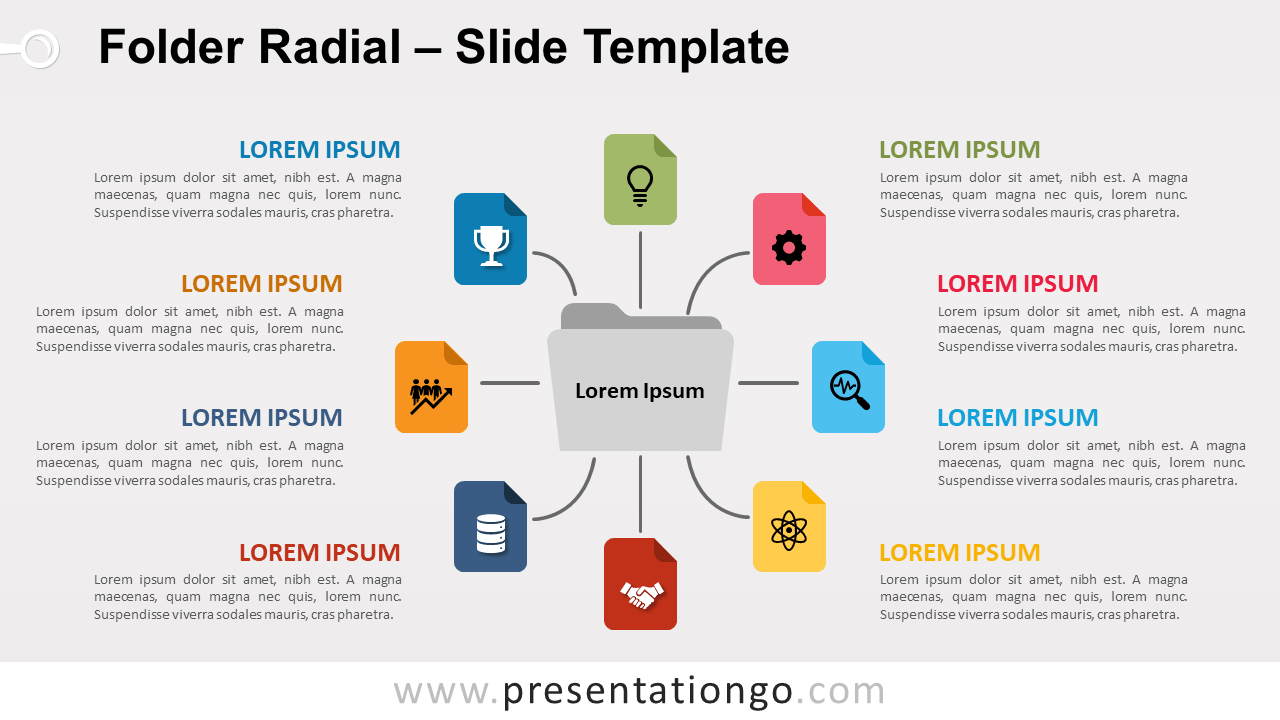
Free folder radial for PowerPoint and Google Slides. 8 colorful folder icons connected to a central main folder. Editable diagram for your presentations.
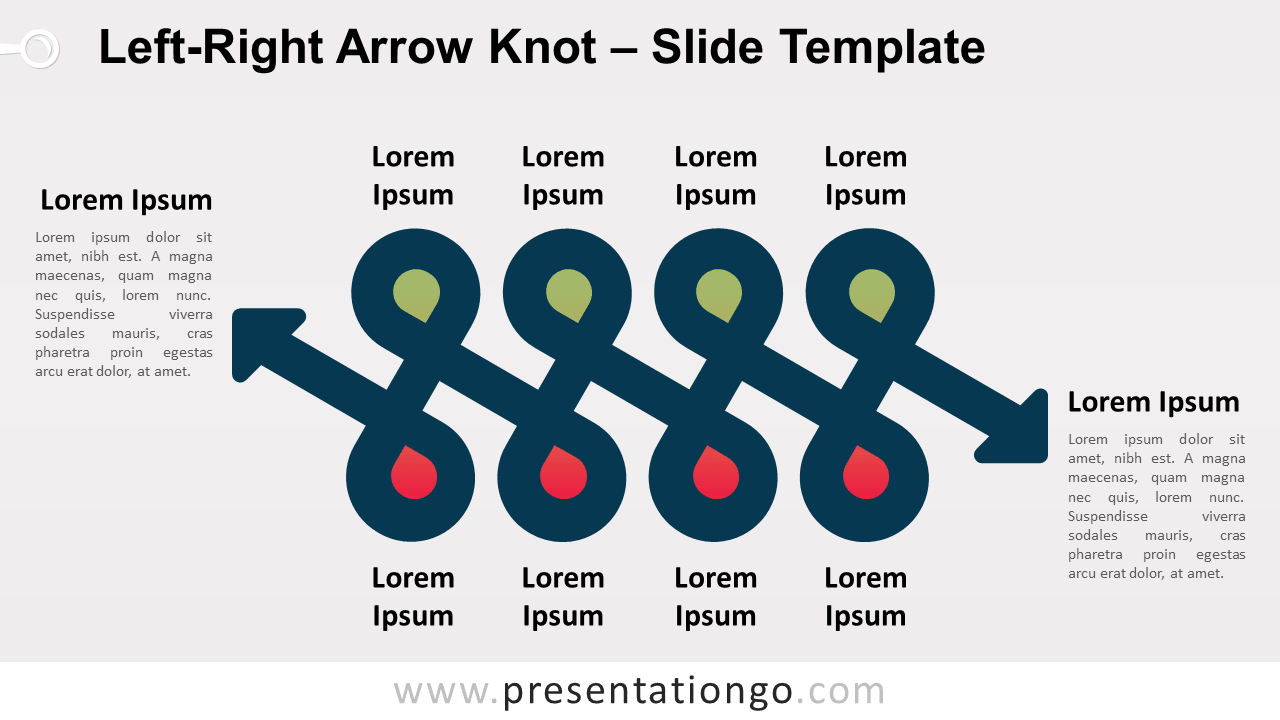
Free left-right arrow knot infographic for PowerPoint and Google Slides. Two-way arrow diagram with 8 isometric loops. For an alternating process.
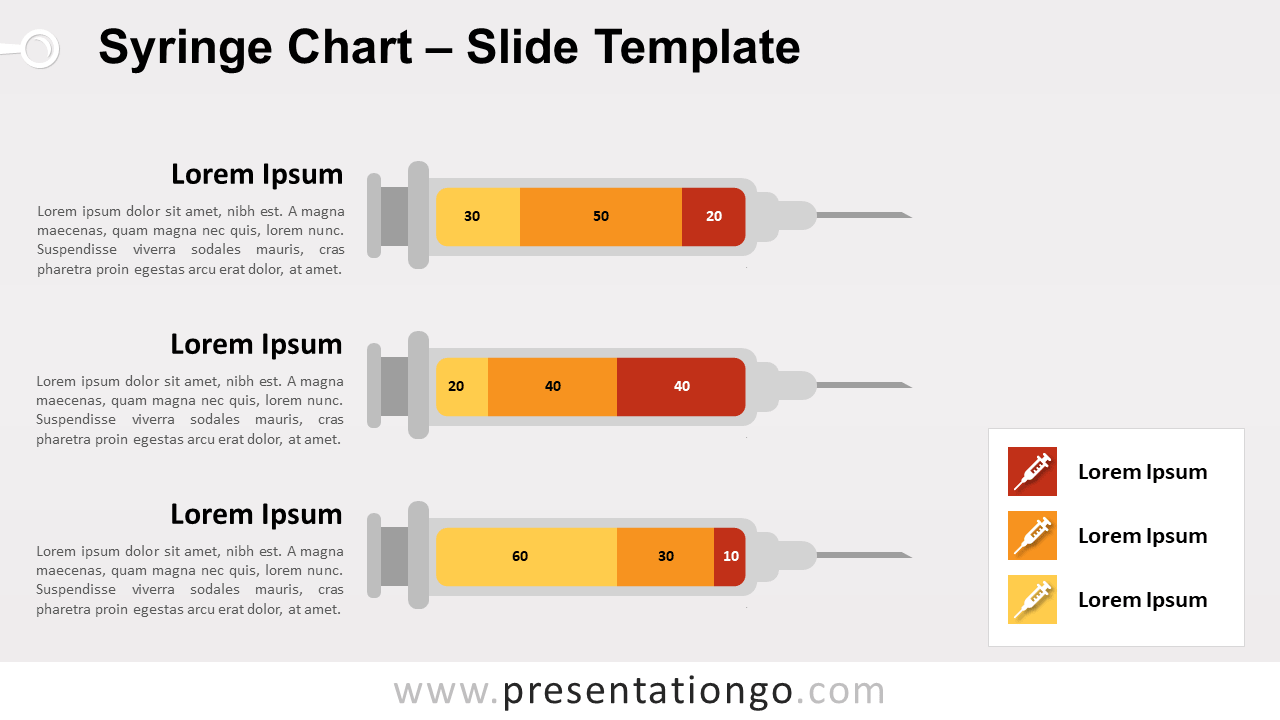
Free syringe chart for PowerPoint and Google Slides. 3 syringes and data-driven bar chart. Great for presentations about medicine, drugs, vaccine.
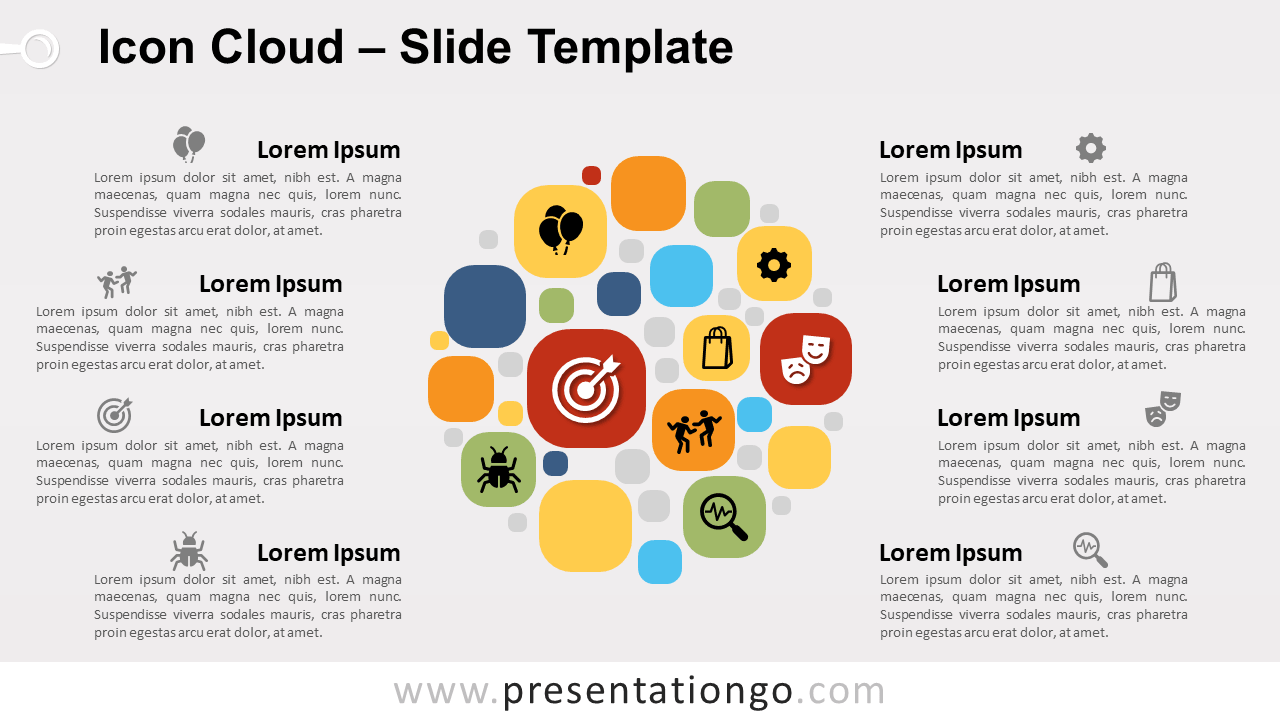
Free icon cloud infographic for PowerPoint and Google Slides. Collage of multicolor rounded squares in the shape of a globe. Alternative to the word cloud.
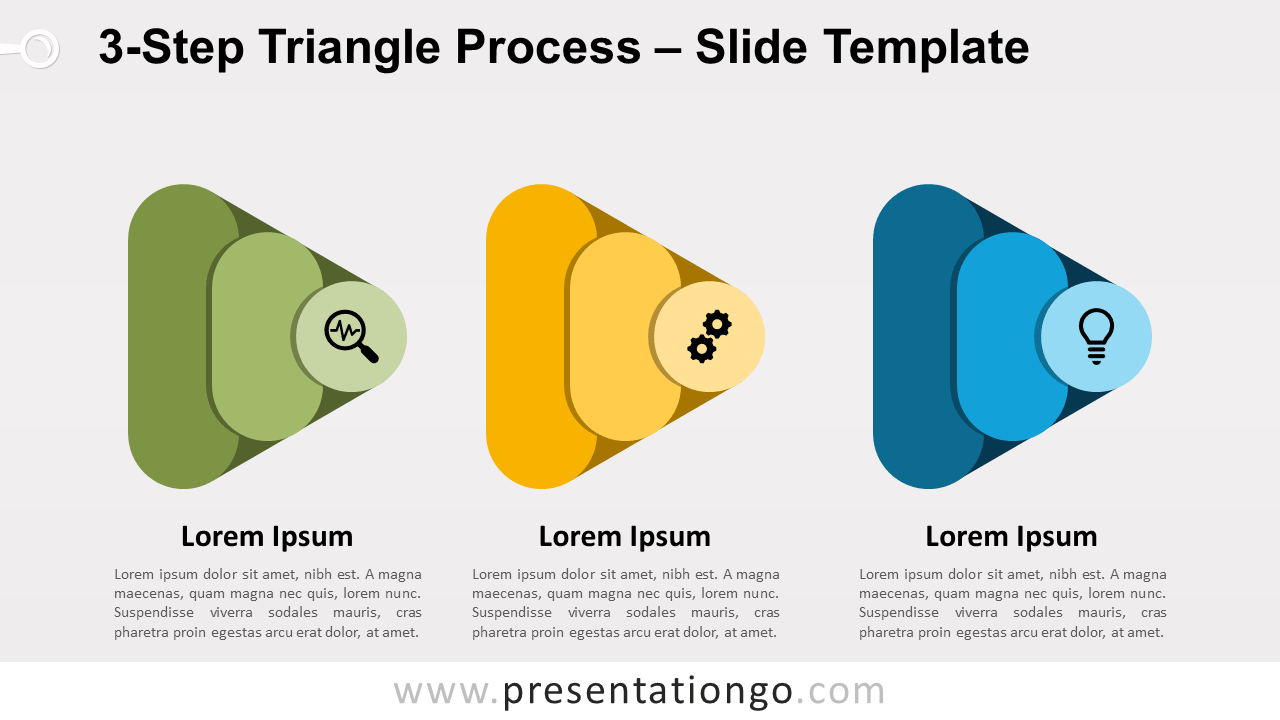
Free 3-step process for PowerPoint and Google Slides. Abstract triangles designed with rounded shapes. Editable graphics with icons and text placeholders.
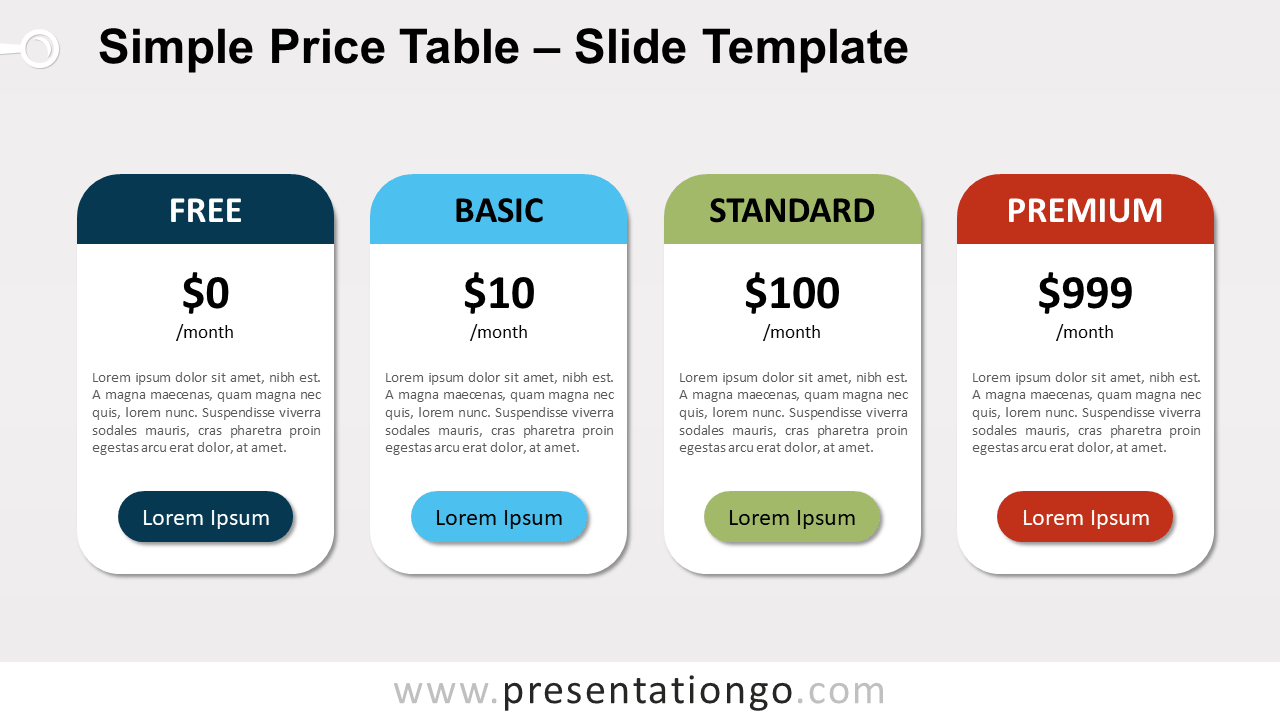
Free simple price table for PowerPoint and Google Slides. Basic rounded tables w/ colorful headers. Minimalist price table template to showcase your offer.
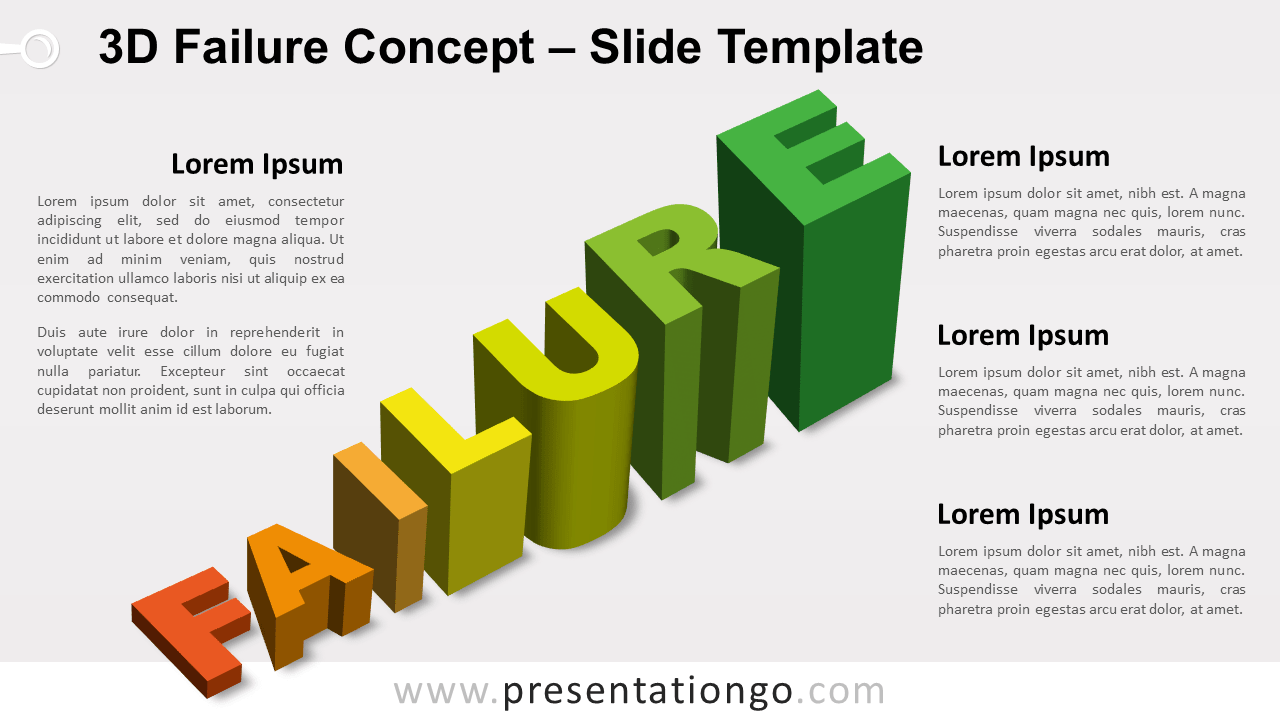
Free 3D failure concept template for PowerPoint. Colorful illustration of the word “failure” designed with the 3-D function. Editable graphics.
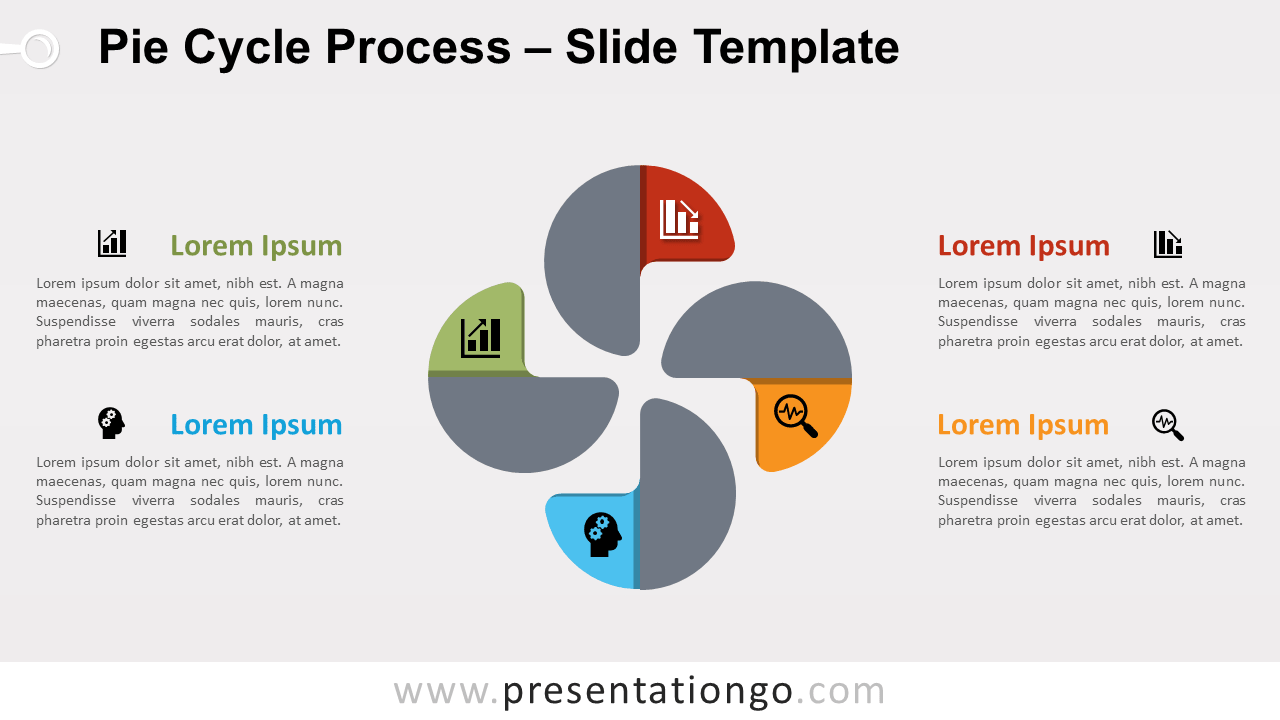
Free pie cycle process for PowerPoint and Google Slides. 4 fraction pie elements arranged in a circular flow. To show aa sequence of 4 stages.
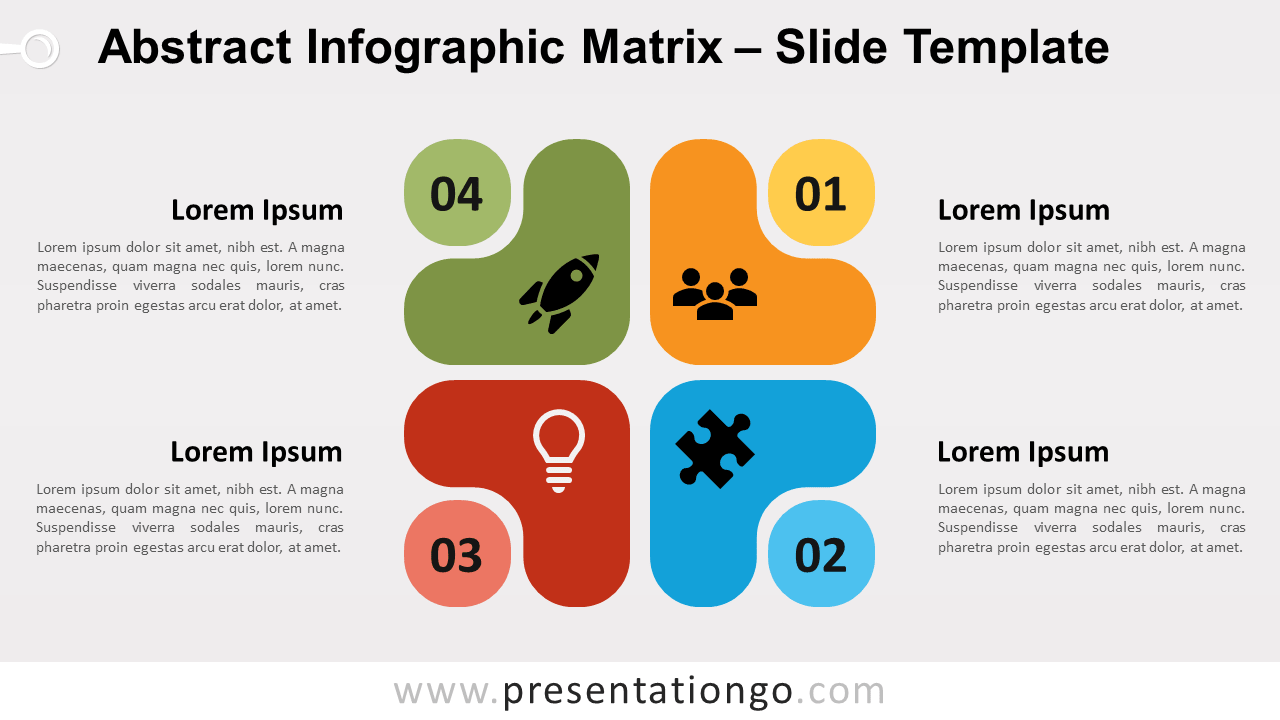
Free abstract infographic matrix for PowerPoint and Google Slides. Diagram with 4 rounded L-shapes. Great to compare four groups of items, like the SWOT.
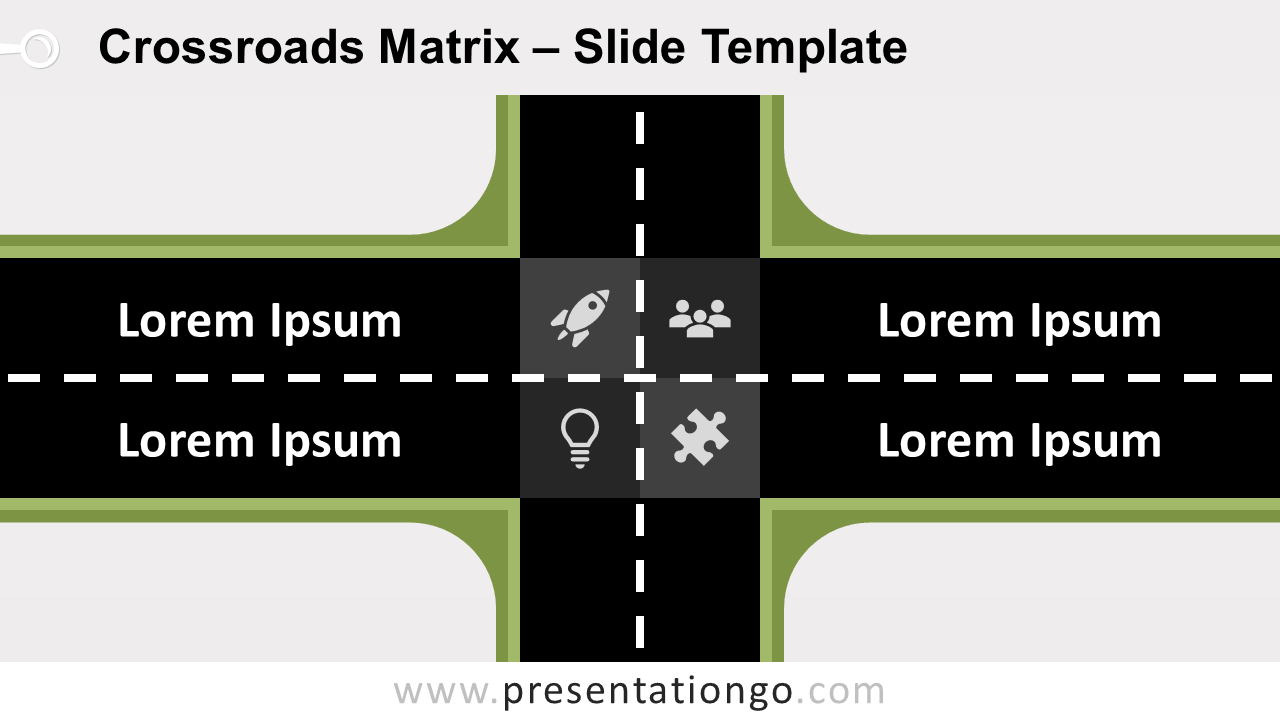
Free crossroads matrix template for PowerPoint and Google Slides. Interesection with 2 roads. Great slide for a matrix or to illustrate a crucial decision.
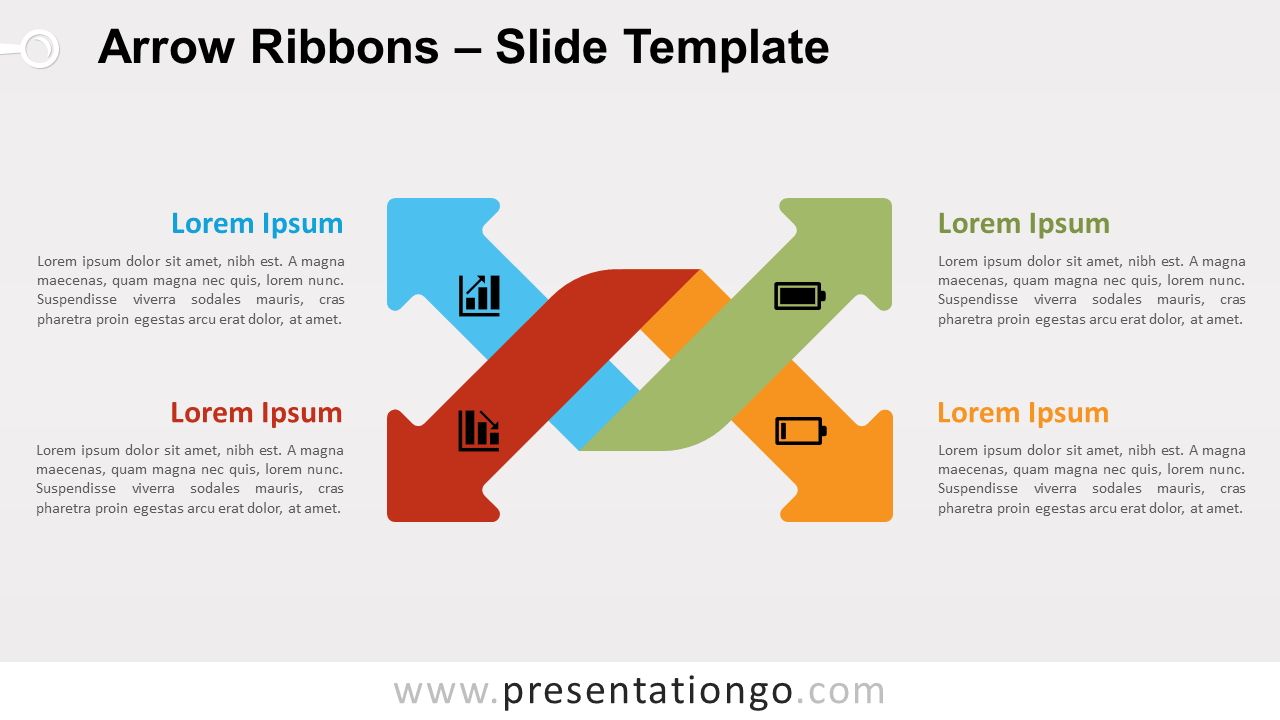
Free arrow ribbons for PowerPoint and Google Slides. A versatile infographic for your slides with 2 intertwined arrows. Editable graphics.
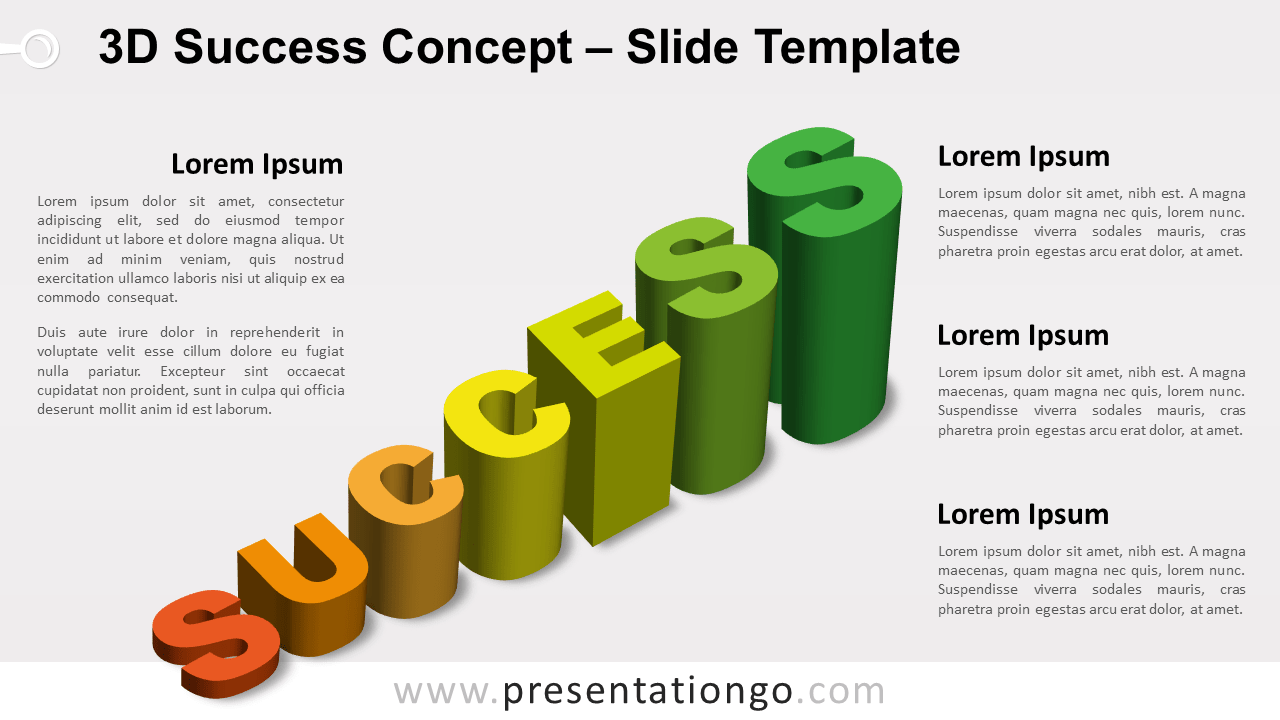
Free 3D success concept template for PowerPoint. The word success is designed with the 3-D function. Share with your audience your definition of success.
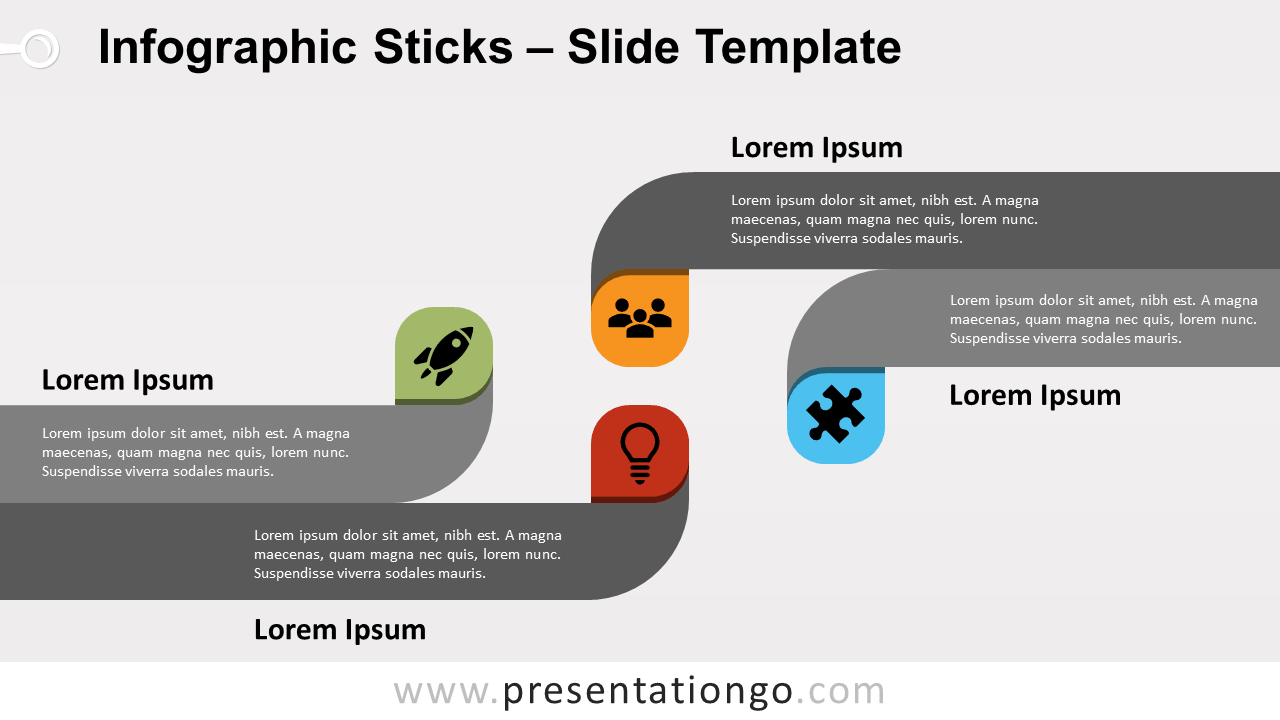
Free infographic sticks for PowerPoint and Google Slides. 2 sets of upside-down horizontal hockey stick-alike editable elements with colorful heads.
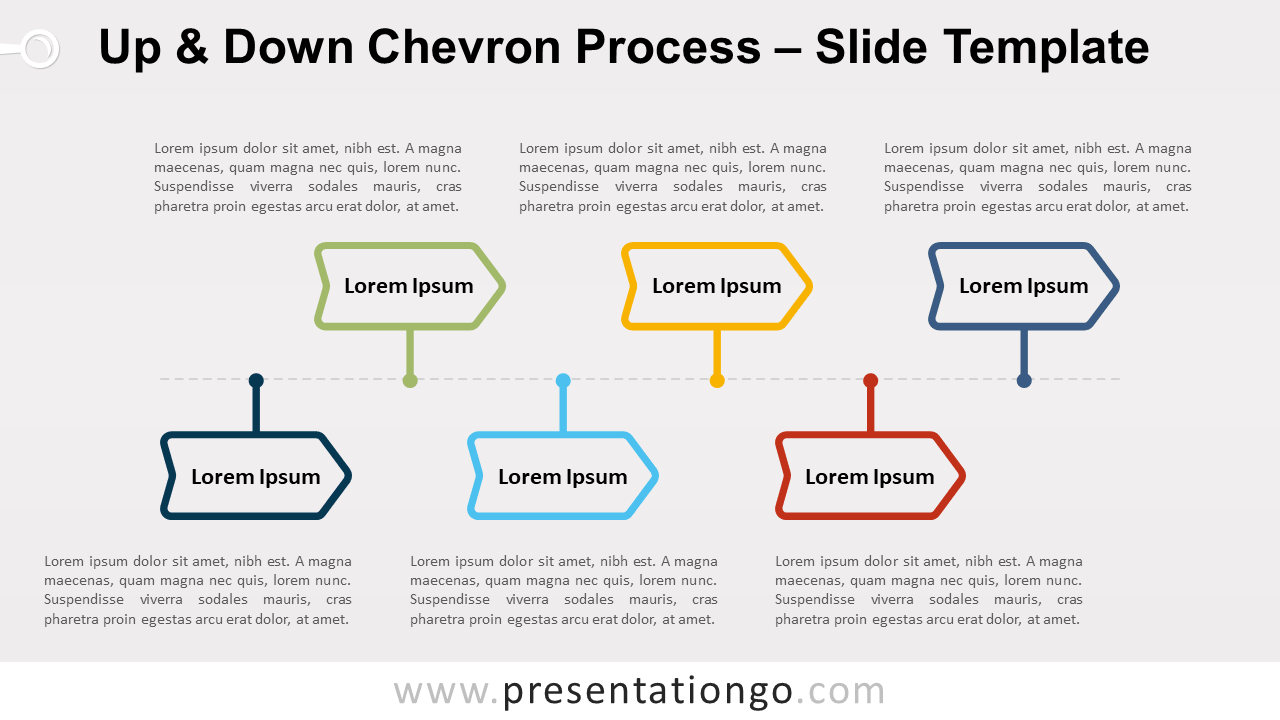
Free up and down chevron process for PowerPoint and Google Slides. Linear process diagram with upside-down directional chevron arrows on a horizontal line.
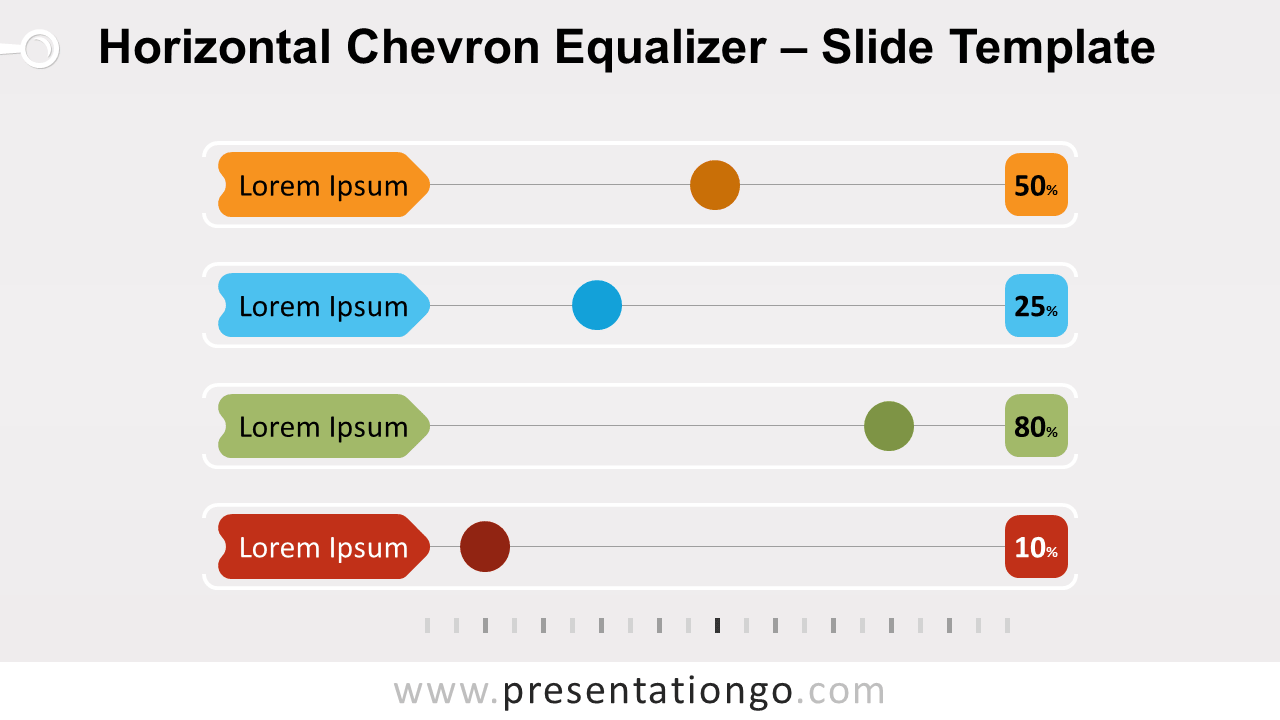
Free horizontal equalizer chevron equalizer for PowerPoint and Google Slides. An editable non-data-driven chart to illustrate and compare percentages.
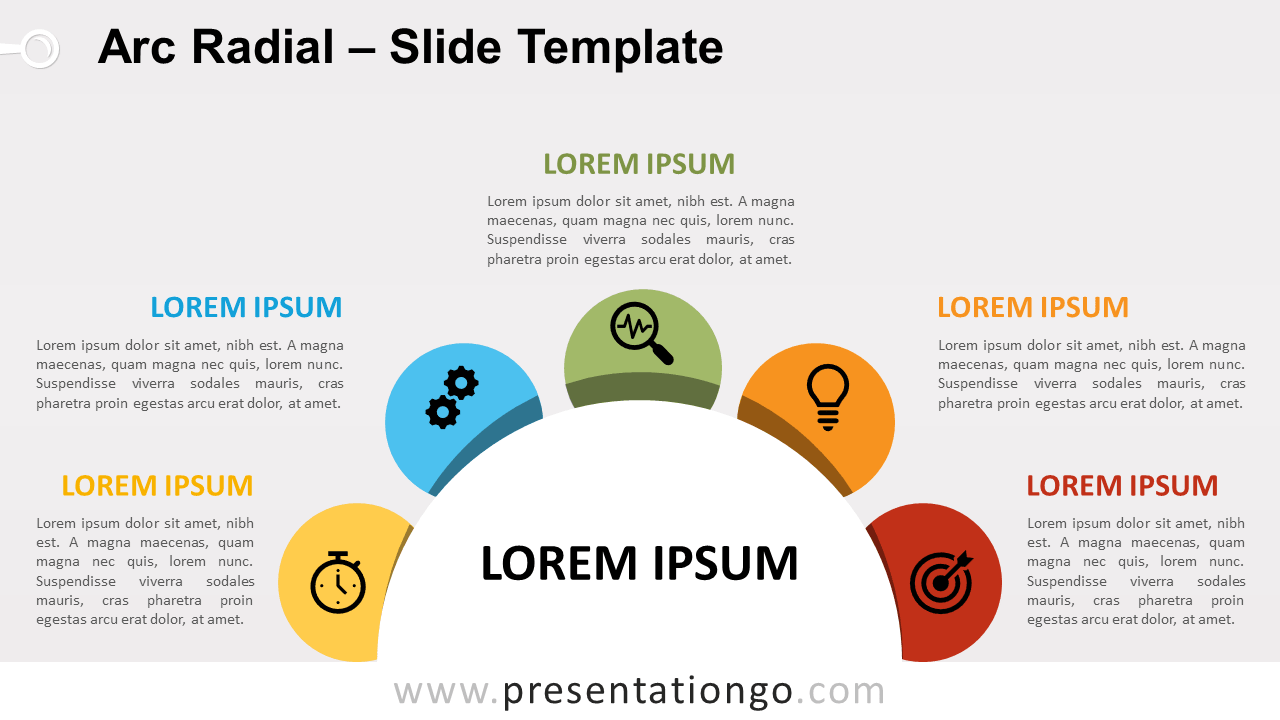
Free arc radial for PowerPoint and Google Slides. Five circle shapes around a semi-circle. An editable multi-stage diagram to explain a central concept.
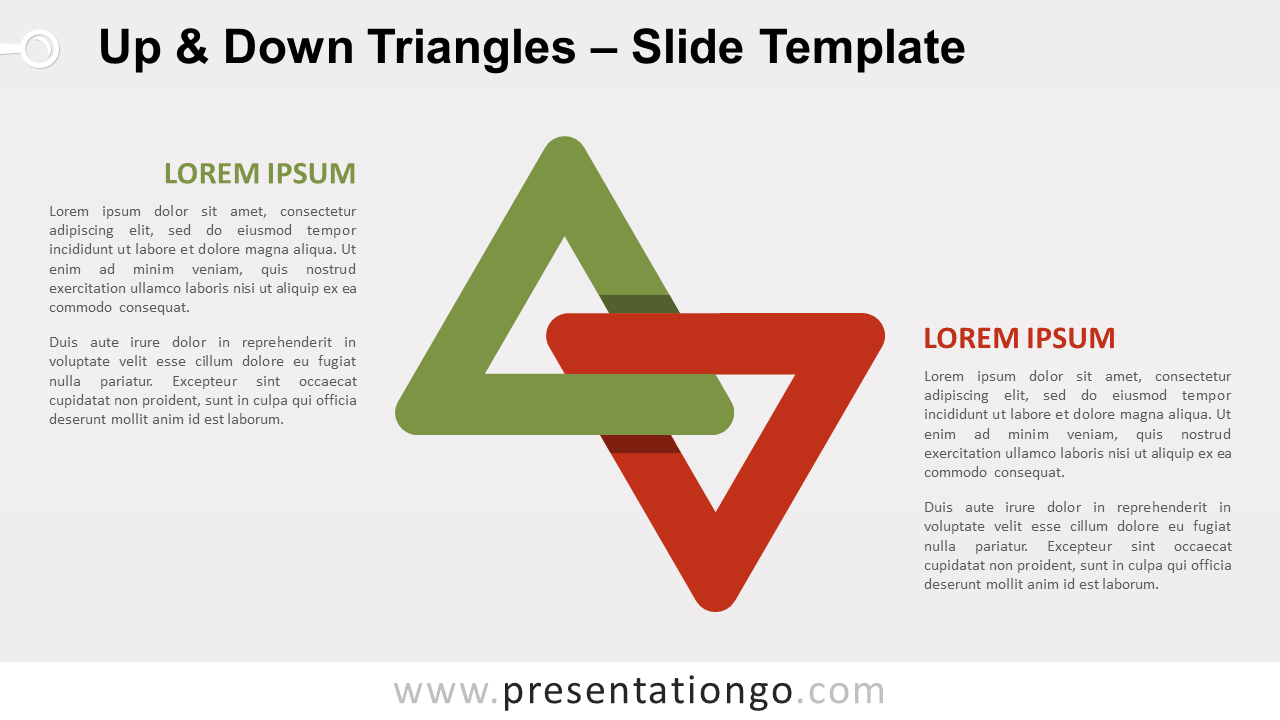
Free up and down triangles for PowerPoint and Google Slides. 2 entwined triangles pointing upwards and downwards. Great to show opposite ideas.