Loading resources…
Total 3480 resources
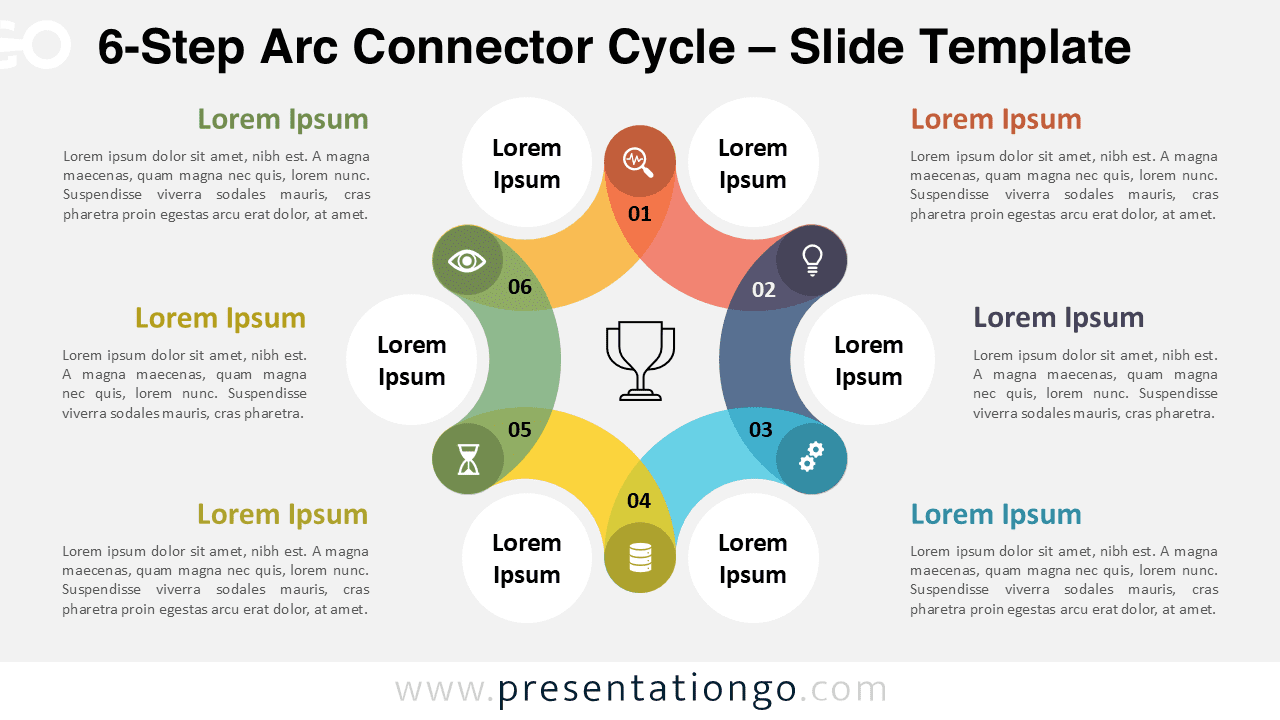
Free 6-Step Arc Connector Cycle PowerPoint and Google Slides template to visualize circular processes with editable arcs and icons.
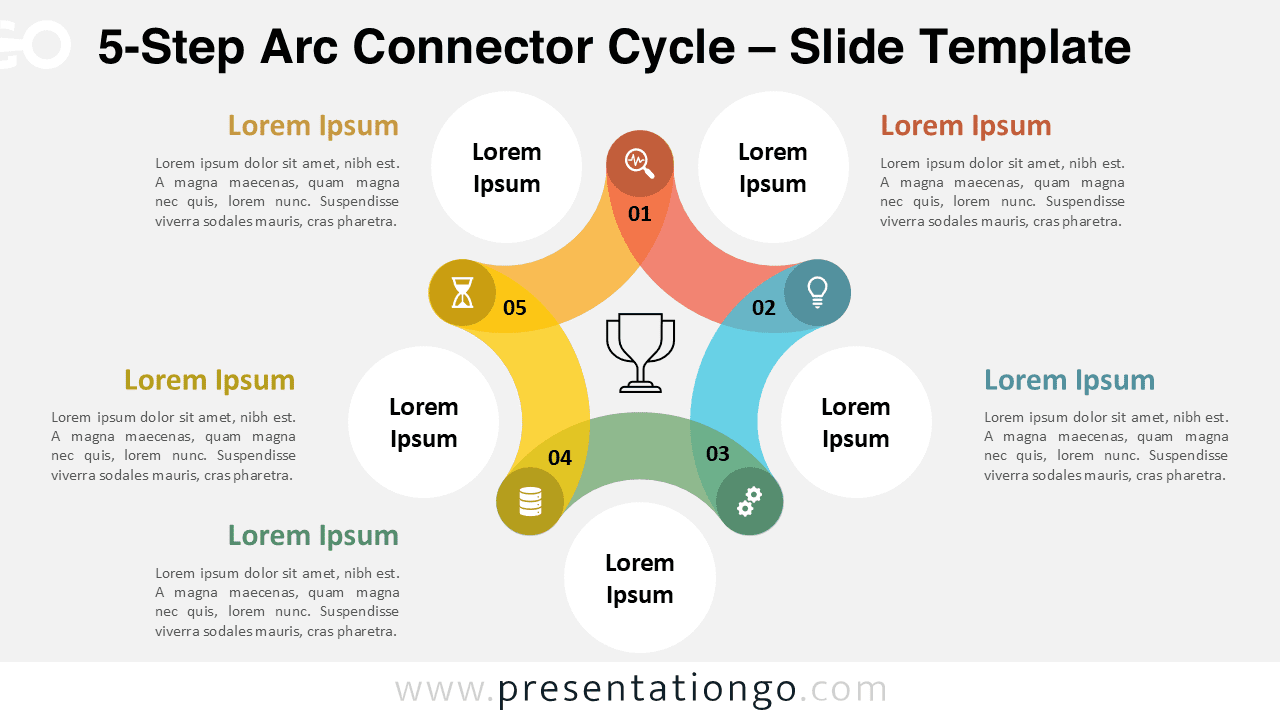
Free 5-Step Arc Connector Cycle PowerPoint template and Google Slides design for visualizing circular workflows, processes, and cycles.
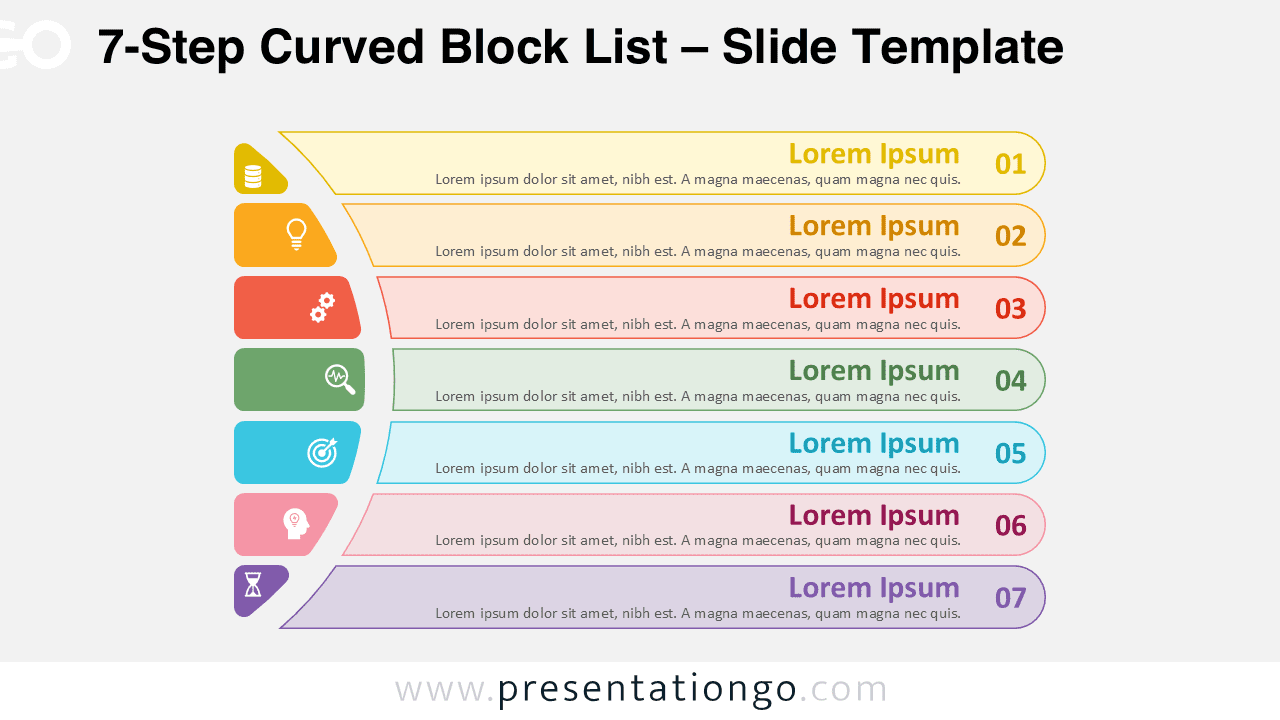
Download the 7-Step Curved Block List PowerPoint and Google Slides template to illustrate seven steps or stages in your presentation.
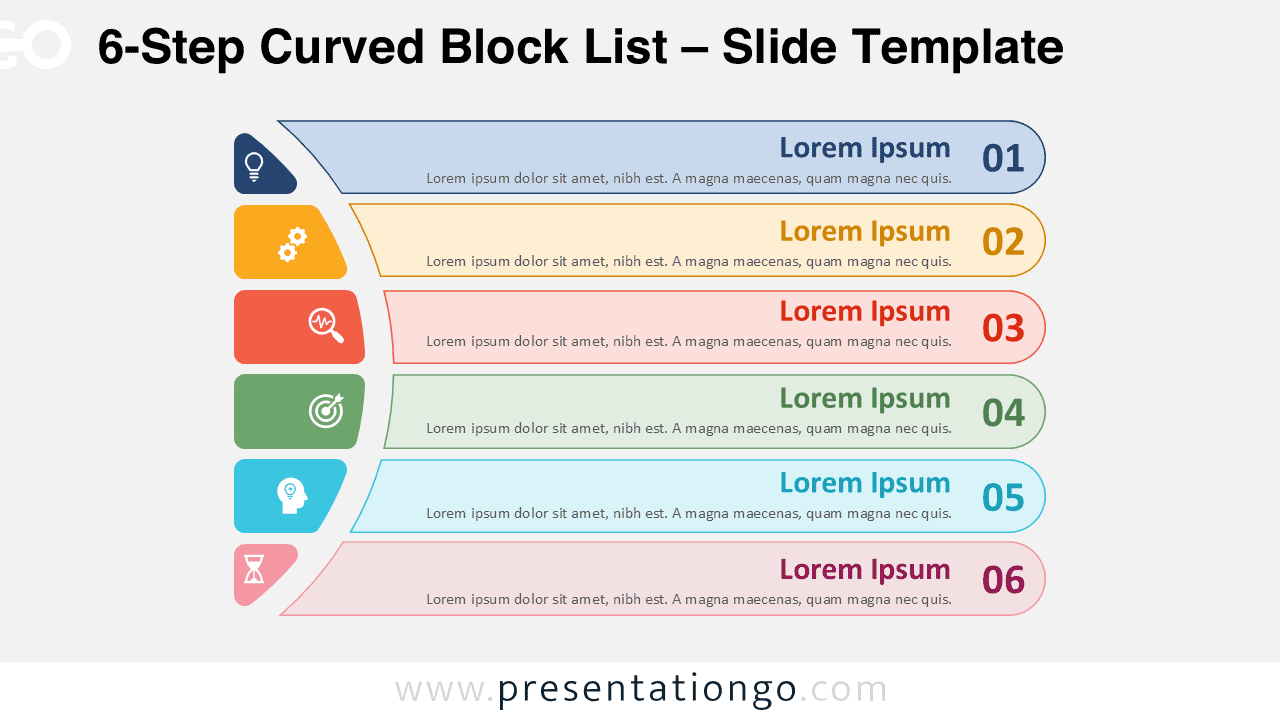
Download the 6-Step Curved Block List PowerPoint and Google Slides template to present workflows and ideas with six organized blocks.
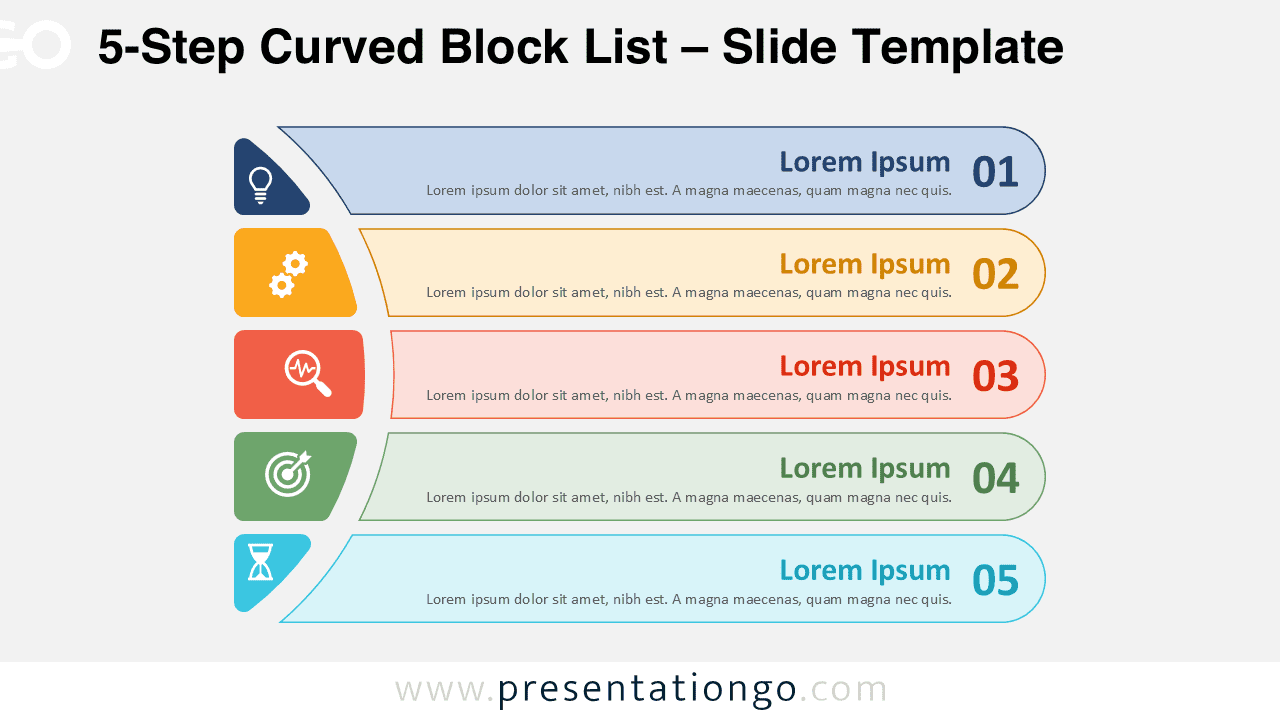
Download the 5-Step Curved Block List PowerPoint and Google Slides template to present five phases or categories in a clean diagram.
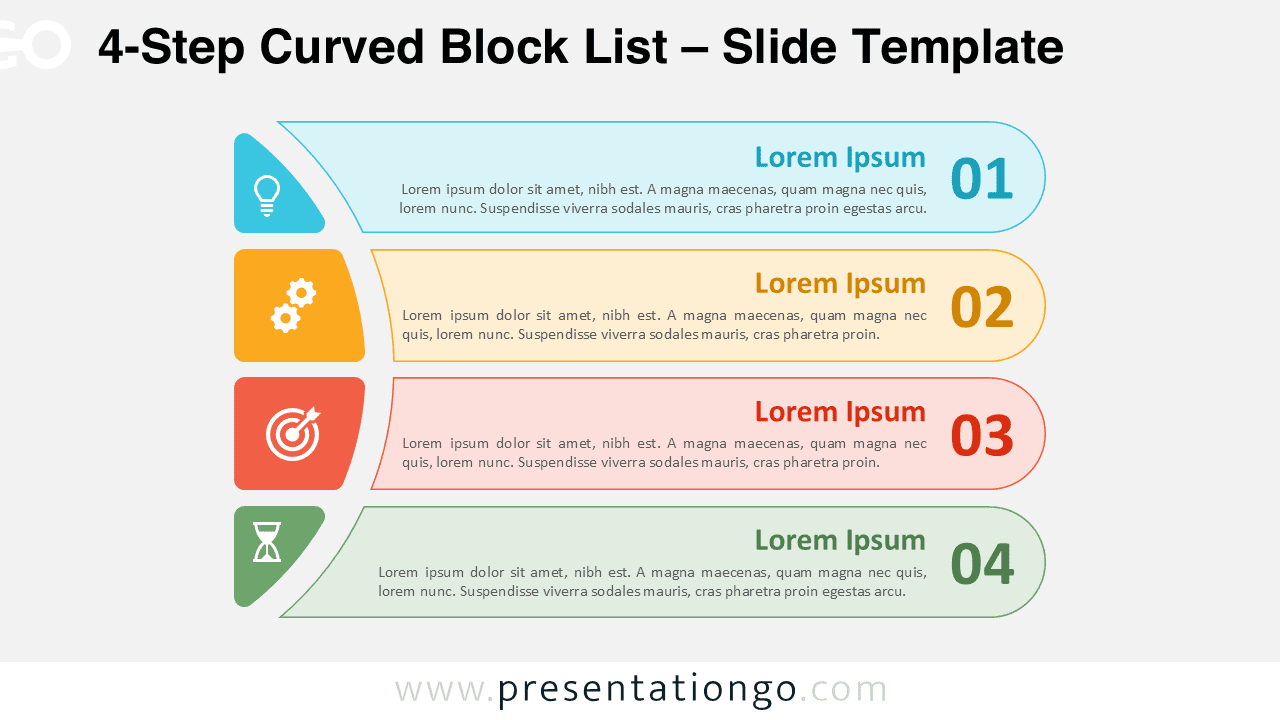
Download the 4-Step Curved Block List for PowerPoint and Google Slides with colorful, outlined, and dark background design options.
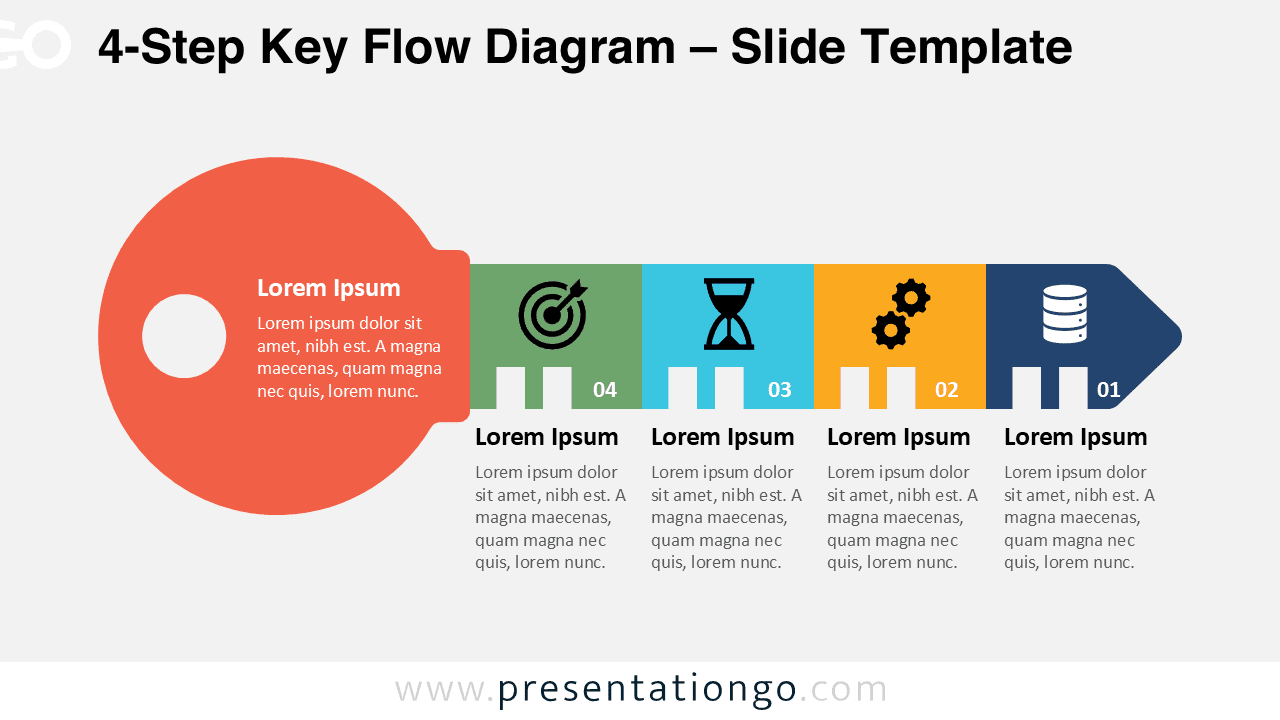
Download the 4-Step Key Flow Diagram for PowerPoint and Google Slides to illustrate processes with a symbolic and editable infographic.
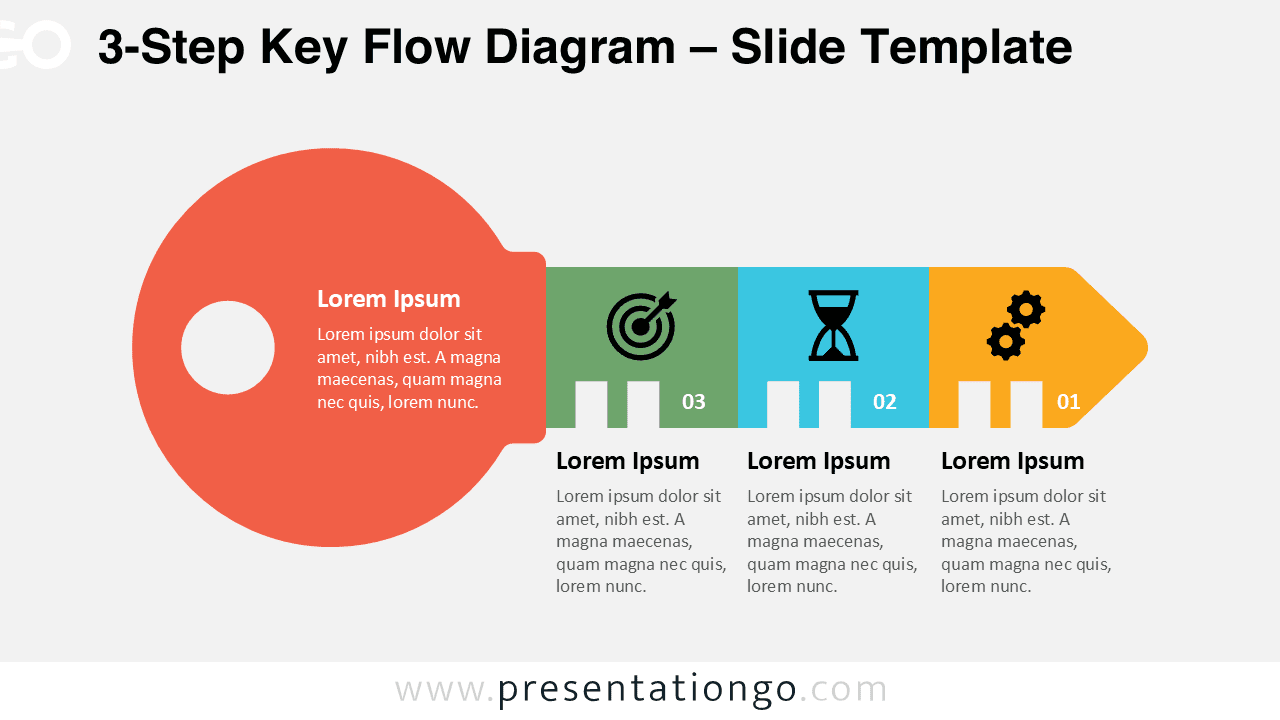
Download the 3-Step Key Flow Diagram for PowerPoint and Google Slides. Unlock ideas with a flat design key metaphor across three steps.
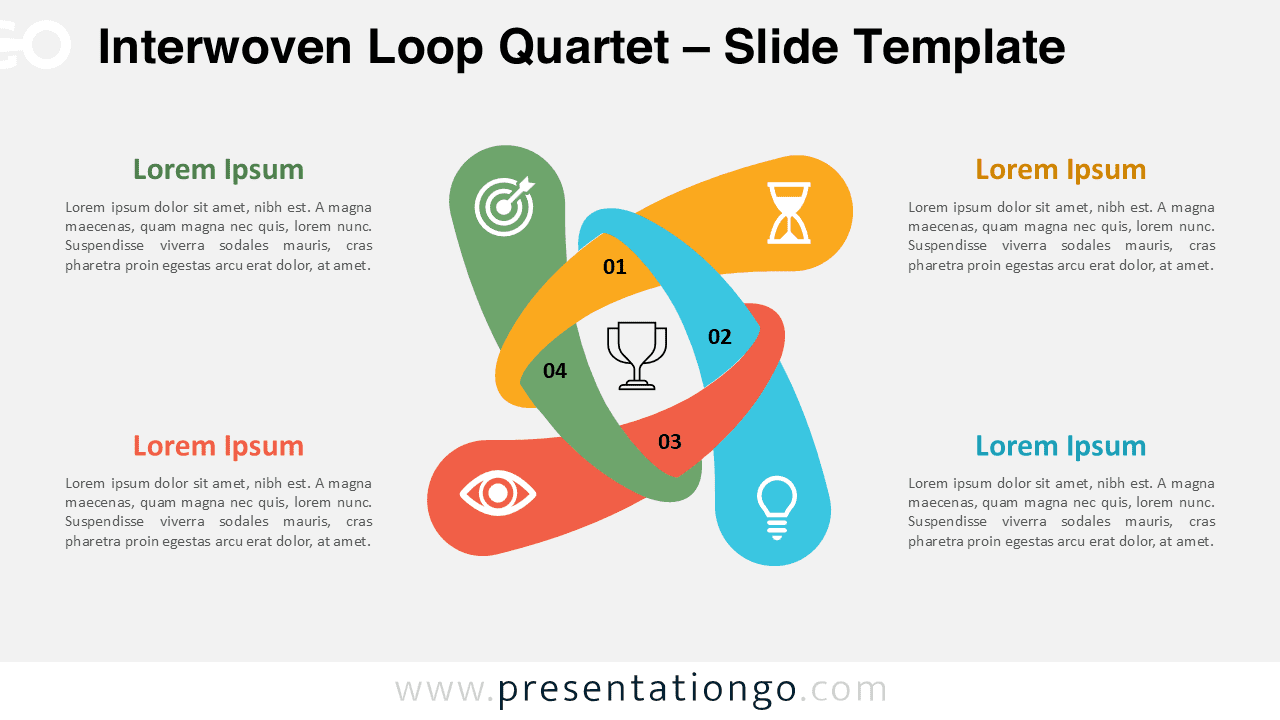
Download the Interwoven Loop Quartet PowerPoint and Google Slides template to present four connected steps in a clear and professional design.
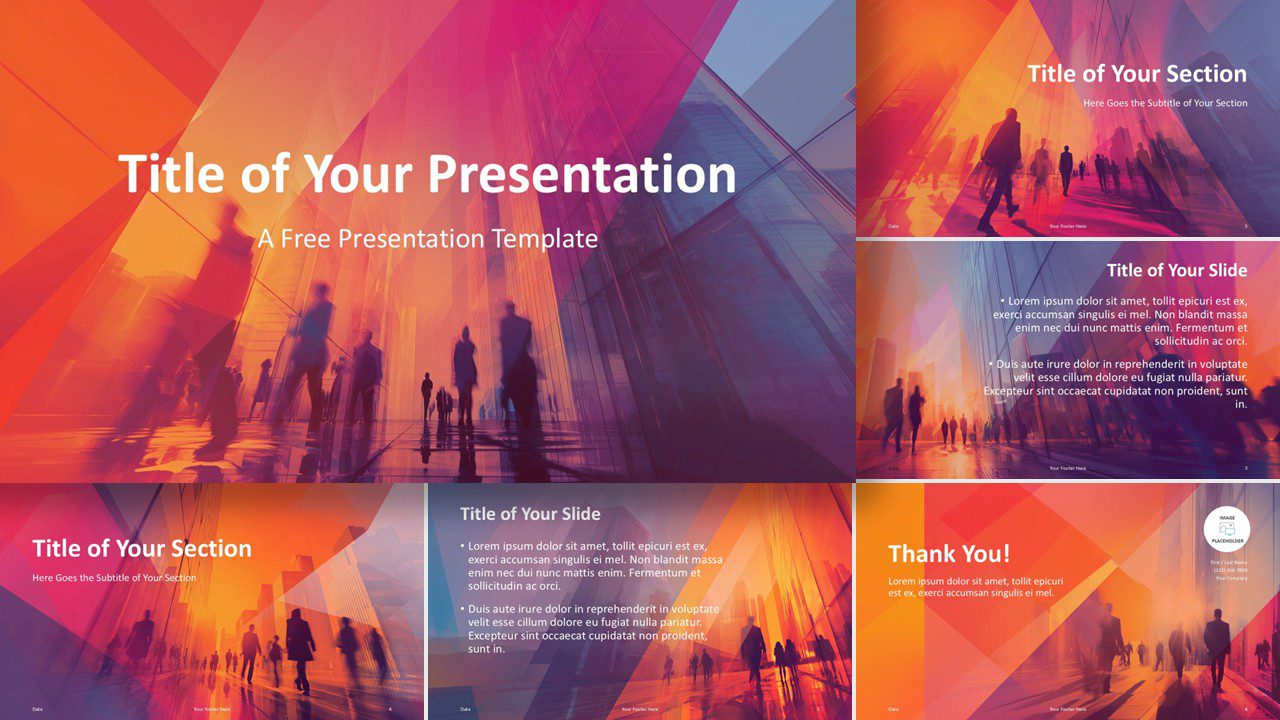
Download the Urban Horizon Template for PowerPoint & Google Slides. A professional design with urban energy for business or education.
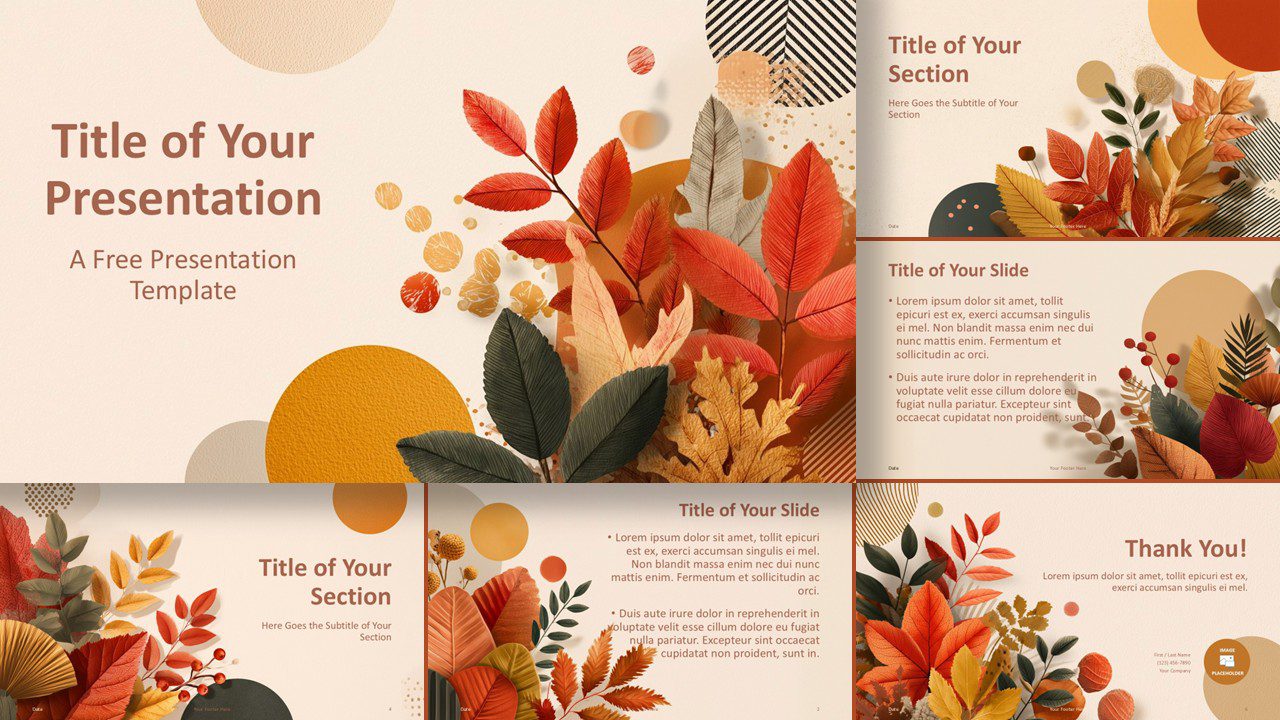
Download the Golden Season Template for PowerPoint & Google Slides. Nature-inspired fall design with 6 slides. Perfect for seasonal content.
Download this contemplative PowerPoint and Google Slides template featuring prayer hands photography. Ideal for faith-based presentations.
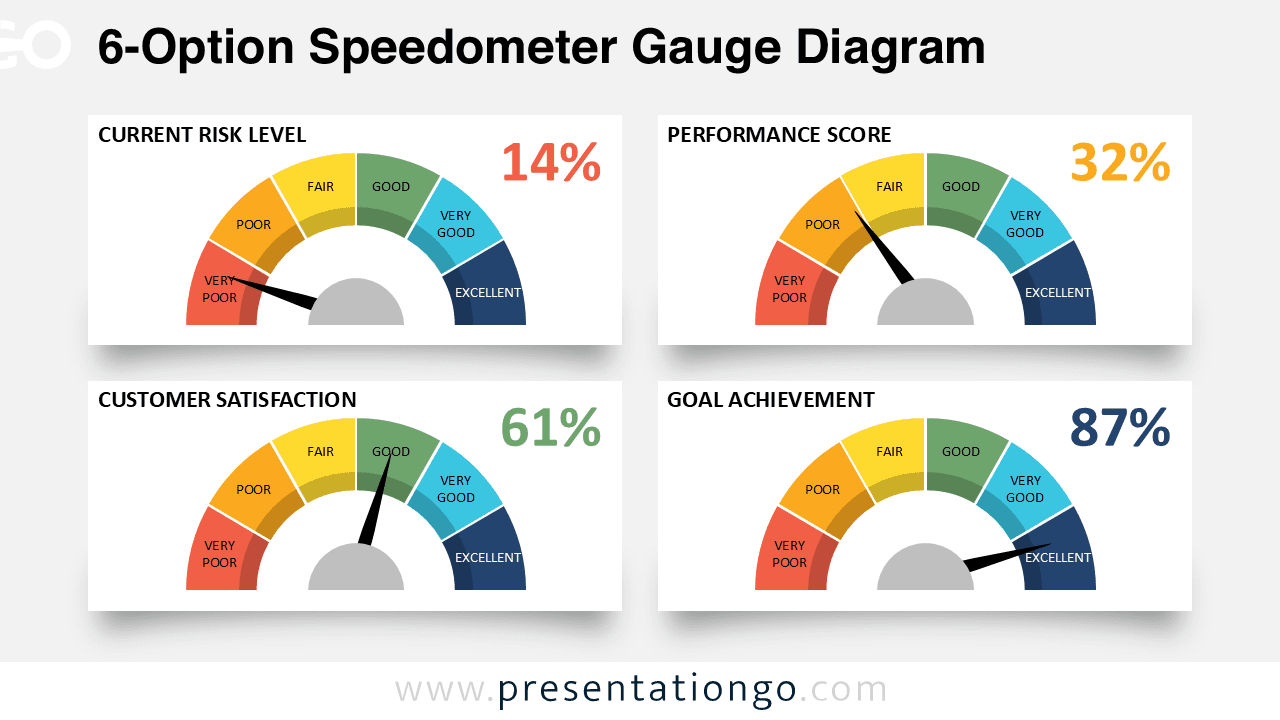
Use the 6-Option Speedometer Gauge Diagram for PowerPoint and Google Slides to track KPIs, goals, and performance across six levels.
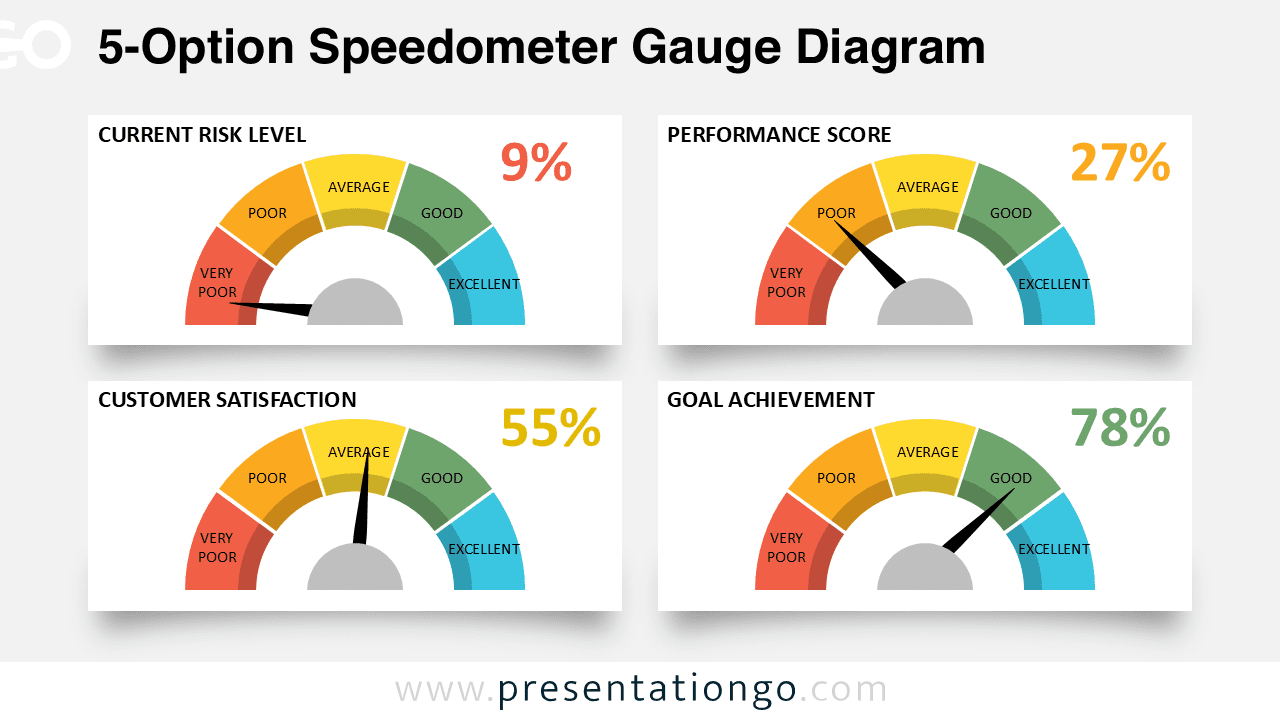
Free 5-Option Speedometer Gauge Diagram for PowerPoint and Google Slides. Compare KPIs with this clear and customizable five-level template.
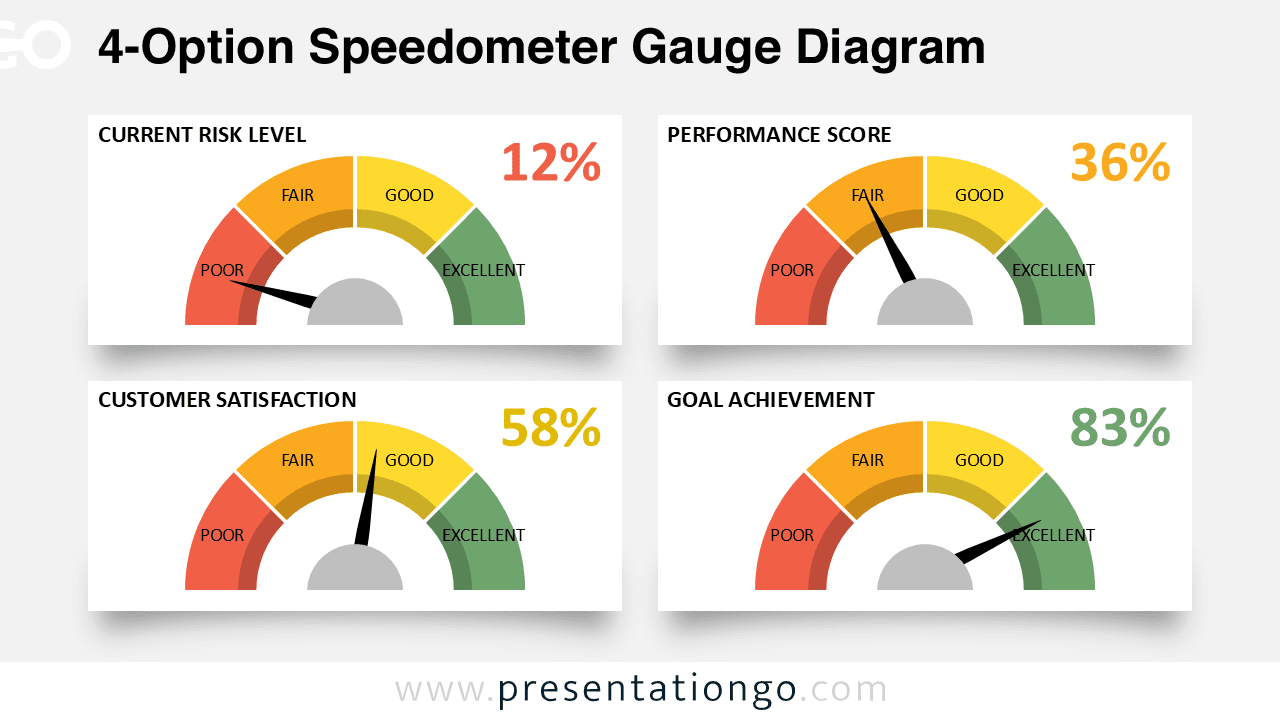
Download the 4-Option Speedometer Gauge Diagram for PowerPoint and Google Slides. Compare multiple performance metrics in one dashboard.
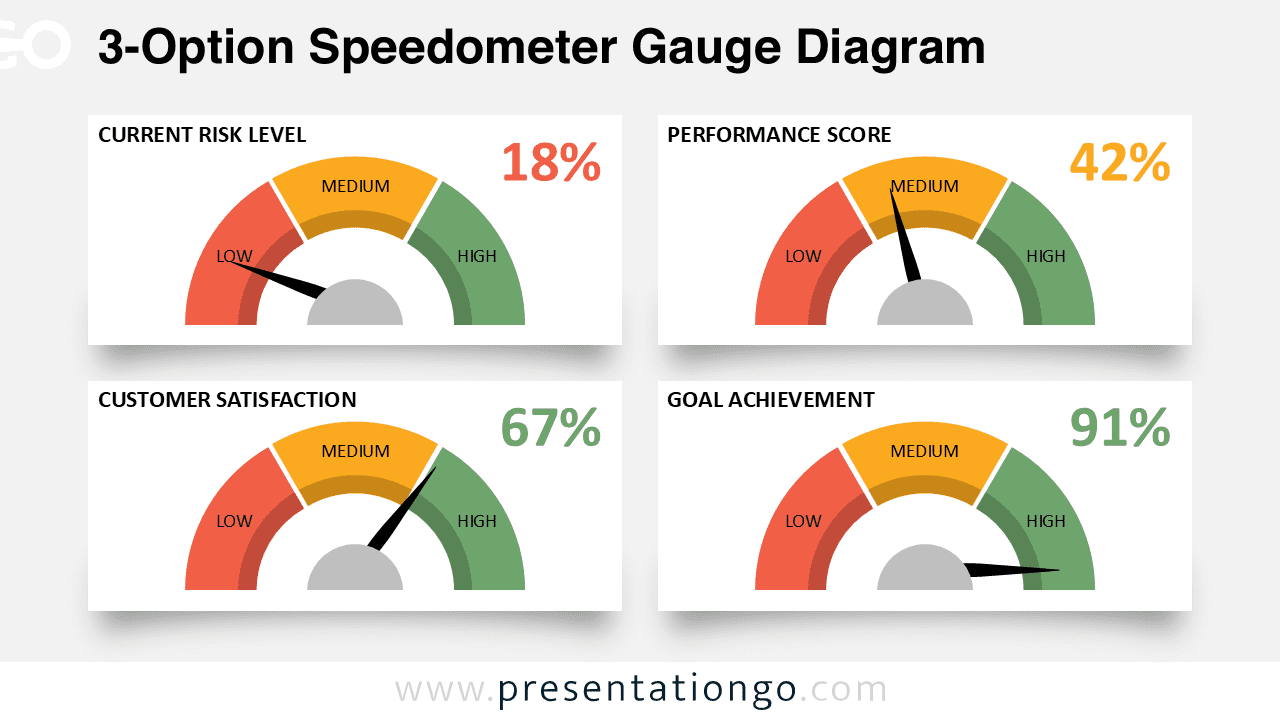
Download the 3-Option Speedometer Gauge Diagram PowerPoint & Google Slides template for quick KPI tracking and performance comparison.
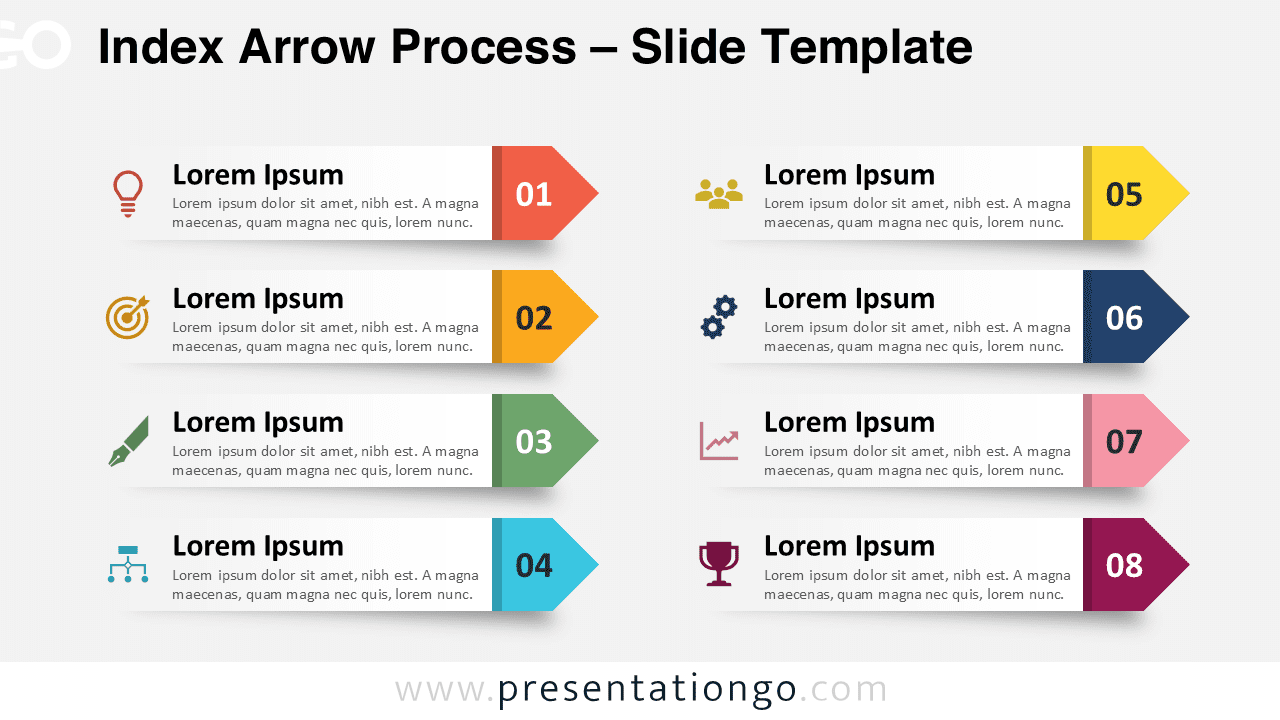
Download the Index Arrow Process for PowerPoint and Google Slides, a clear eight-step diagram for processes, workflows, and tasks.
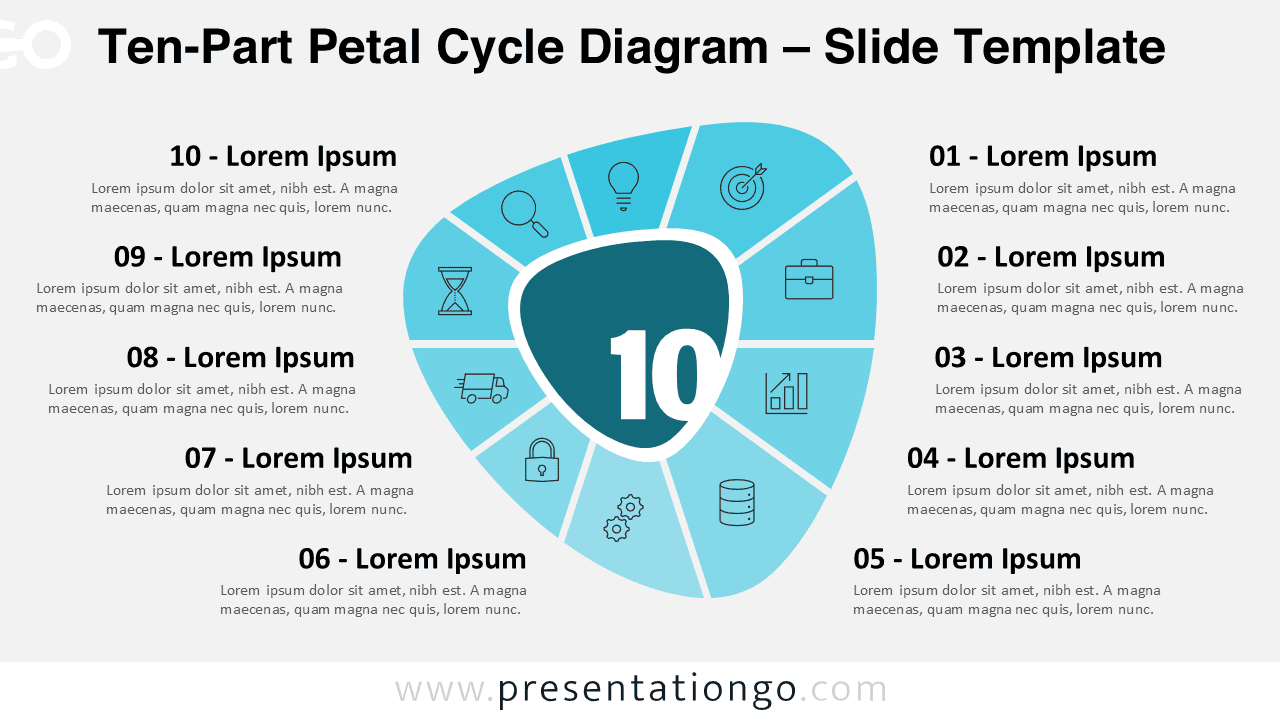
Download the Ten-Part Petal Cycle Diagram for PowerPoint and Google Slides. Show ten steps, phases, or principles in one circular flow.
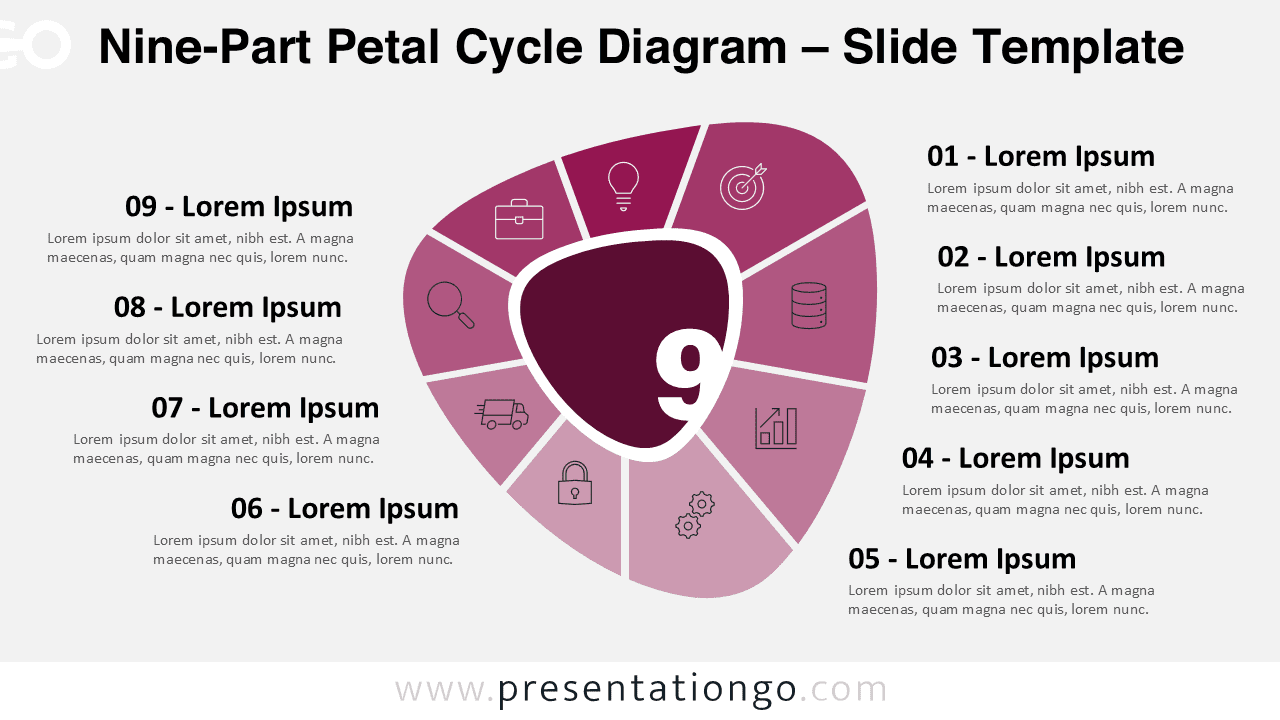
Free Nine-Part Petal Cycle Diagram for PowerPoint and Google Slides. Present nine related steps, features, or phases in a circular diagram.
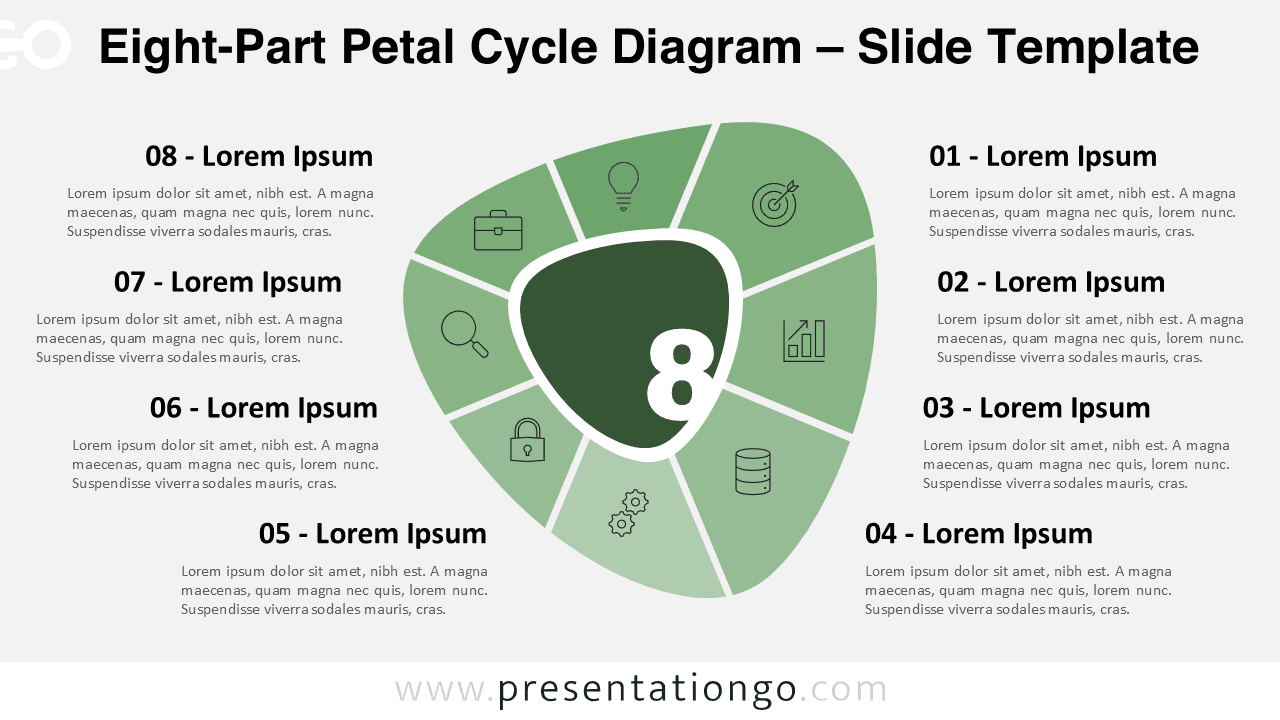
Download the Eight-Part Petal Cycle Diagram PowerPoint and Google Slides template featuring eight petals, icons, and editable shapes.
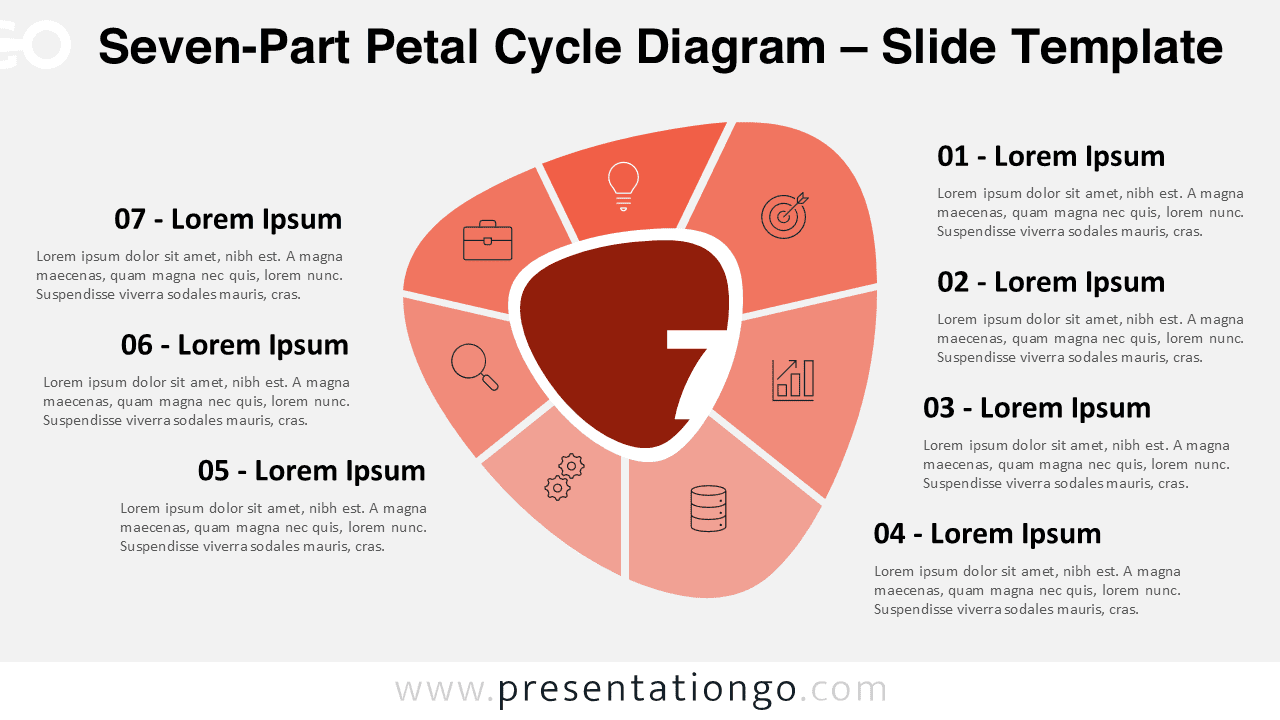
Create engaging visuals with the Seven-Part Petal Cycle Diagram PowerPoint & Google Slides template, including seven editable connected petals.
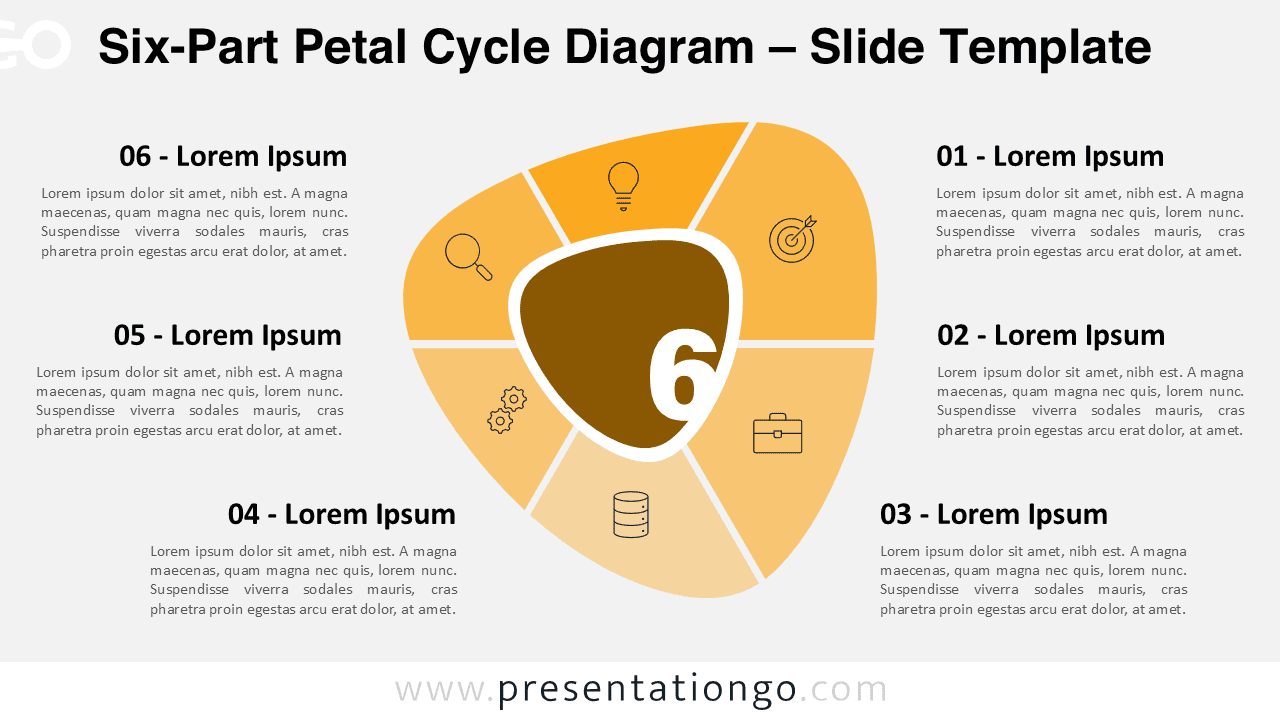
Download the Six-Part Petal Cycle Diagram for PowerPoint and Google Slides. Show six stages or concepts in a circular, petal design.
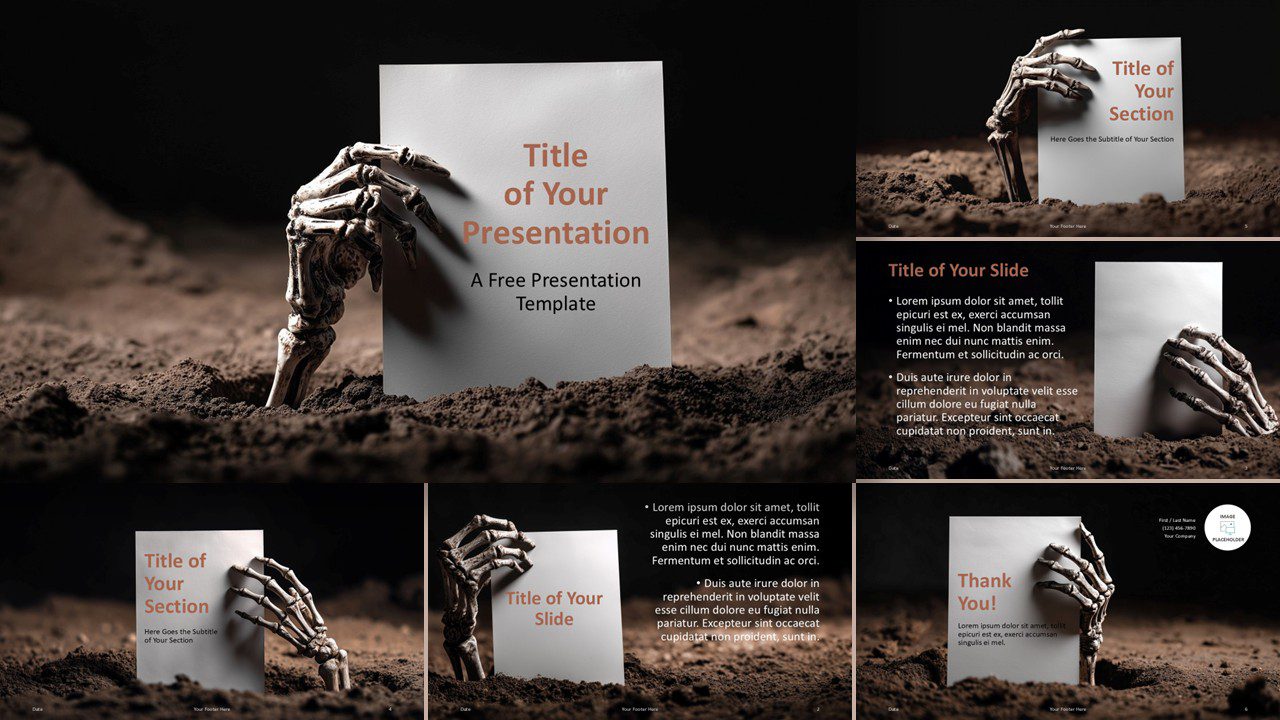
Download this free Creeping Hand Template for PowerPoint and Google Slides. Perfect for Halloween slides and horror-themed content presentations.
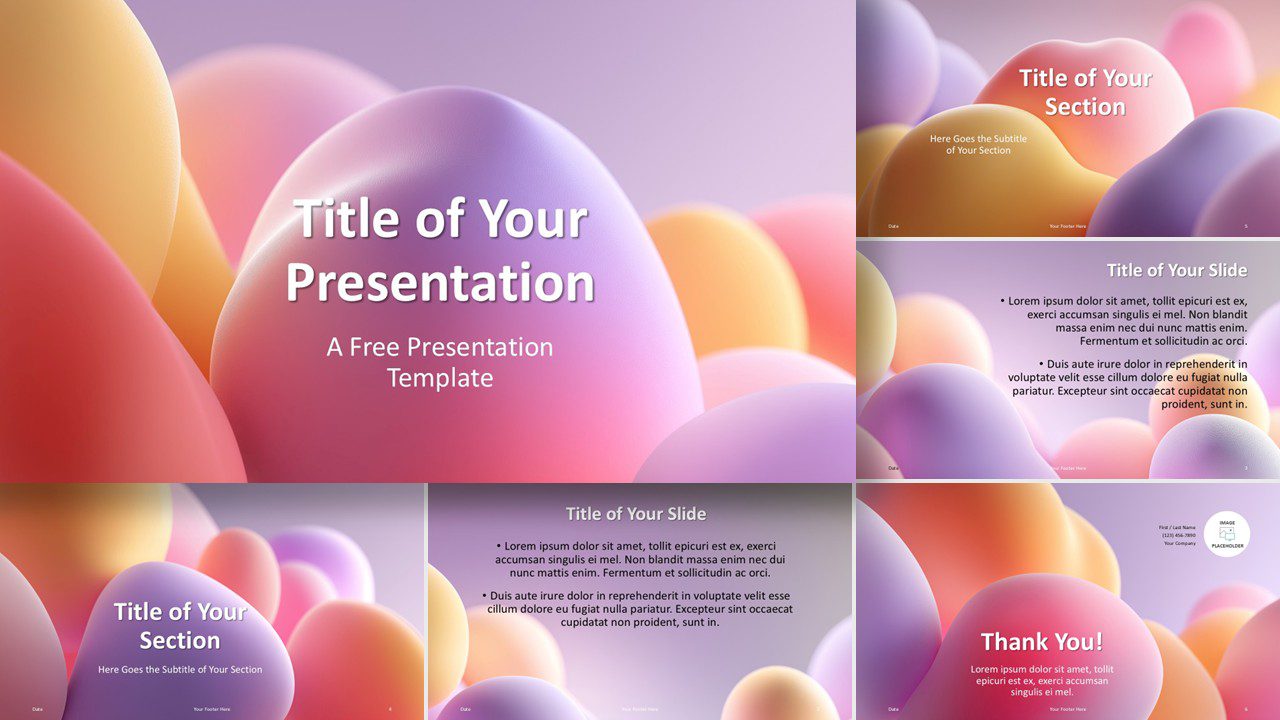
Download the Soft Dreamy Bubbles Template for PowerPoint & Google Slides. Create fresh, balanced slides with abstract pastel visuals.