Loading resources…
Total 8274 resources
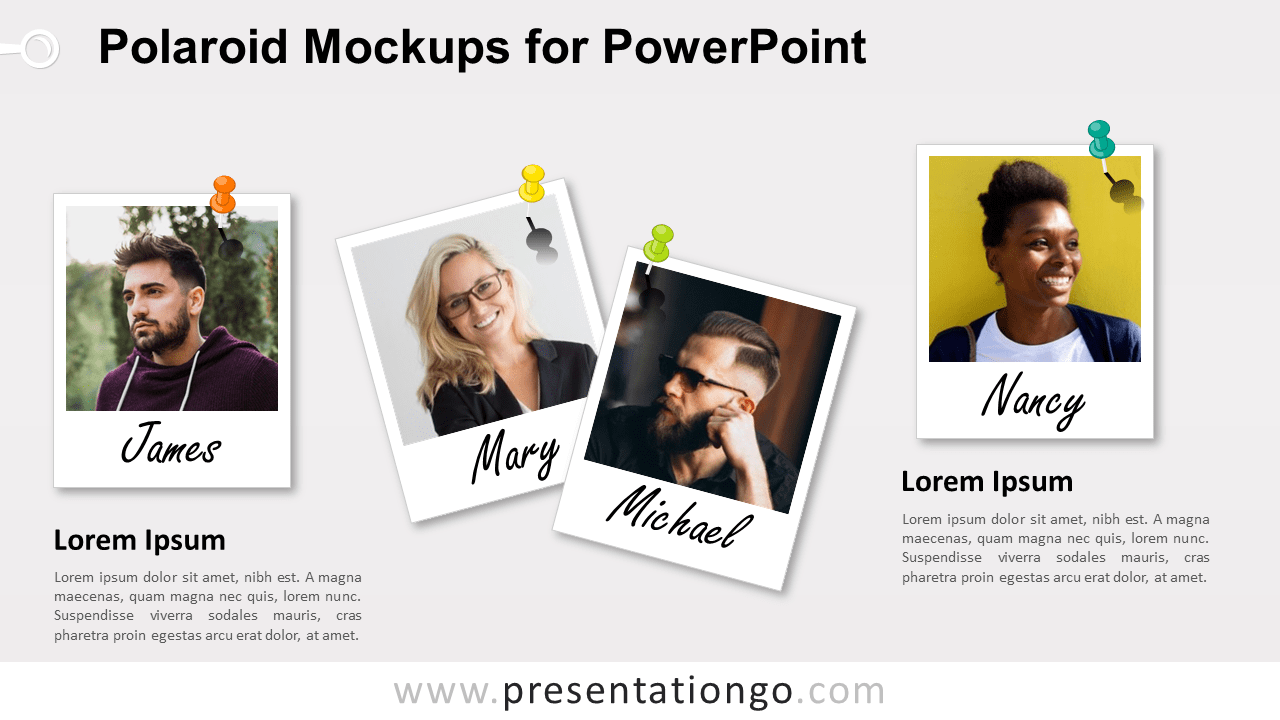
Free Polaroid mockups for PowerPoint. 4 lined-up Polaroid frames with different orientations, and push pins. Editable graphics with text placeholders.
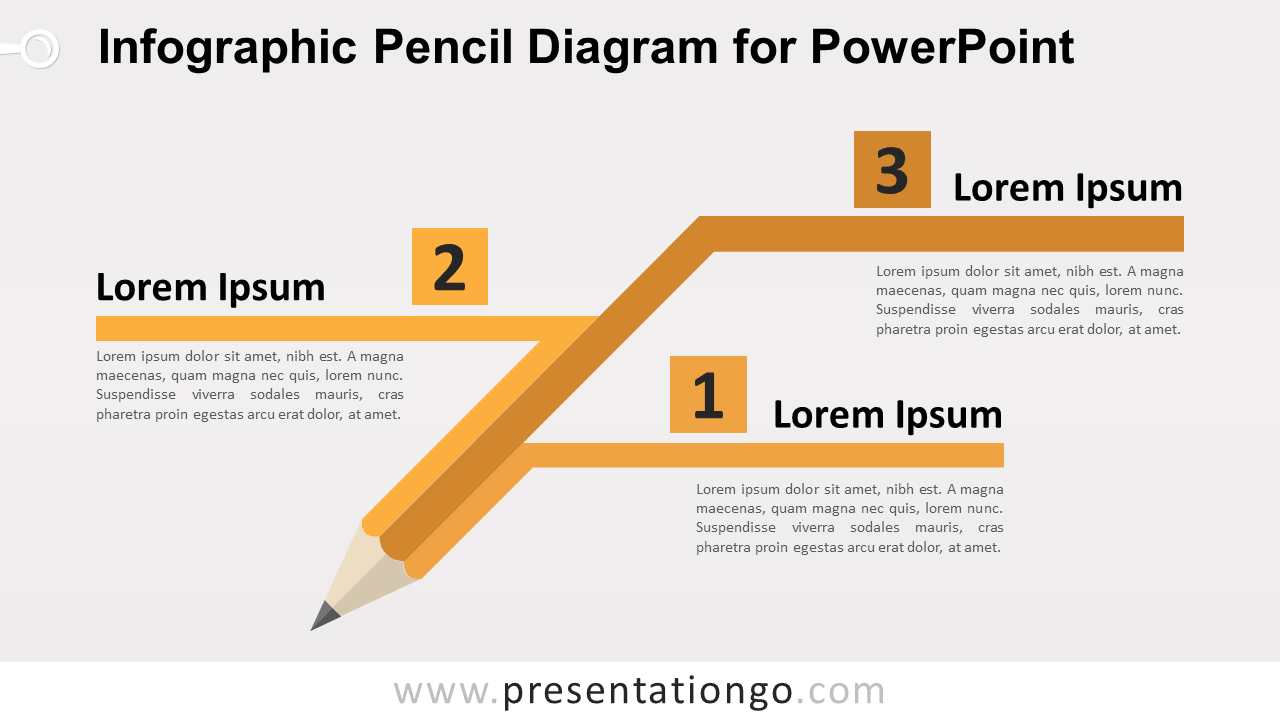
Free infographic pencil diagram for PowerPoint. Design illustration of a diagonal graphite pencil with 3 levels. Editable graphics with text placeholders.
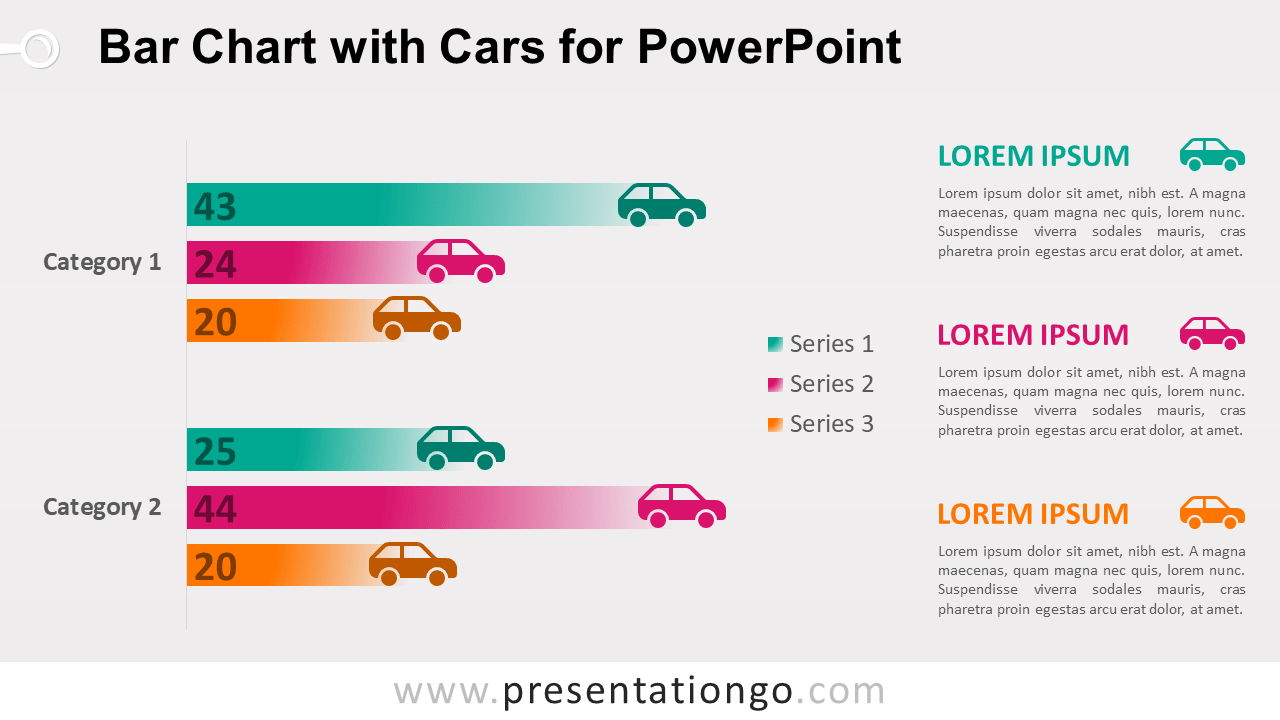
Free bar chart with cars for PowerPoint. Data-driven clustered bar chart with cars on the edge of each horizontal bars. Editable graphics.
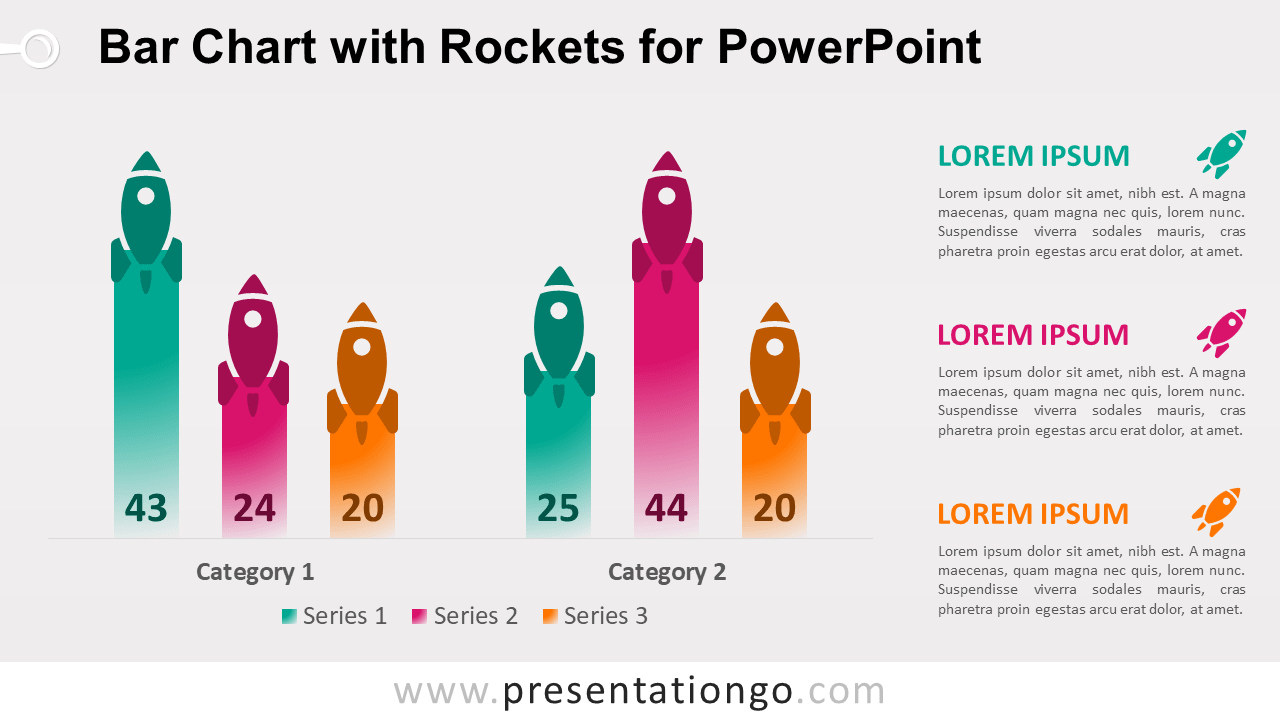
Free bar chart with rockets for PowerPoint. Data-driven clustered-column bar chart with colored rockets on top of each bars. 3 slides with editable graphics
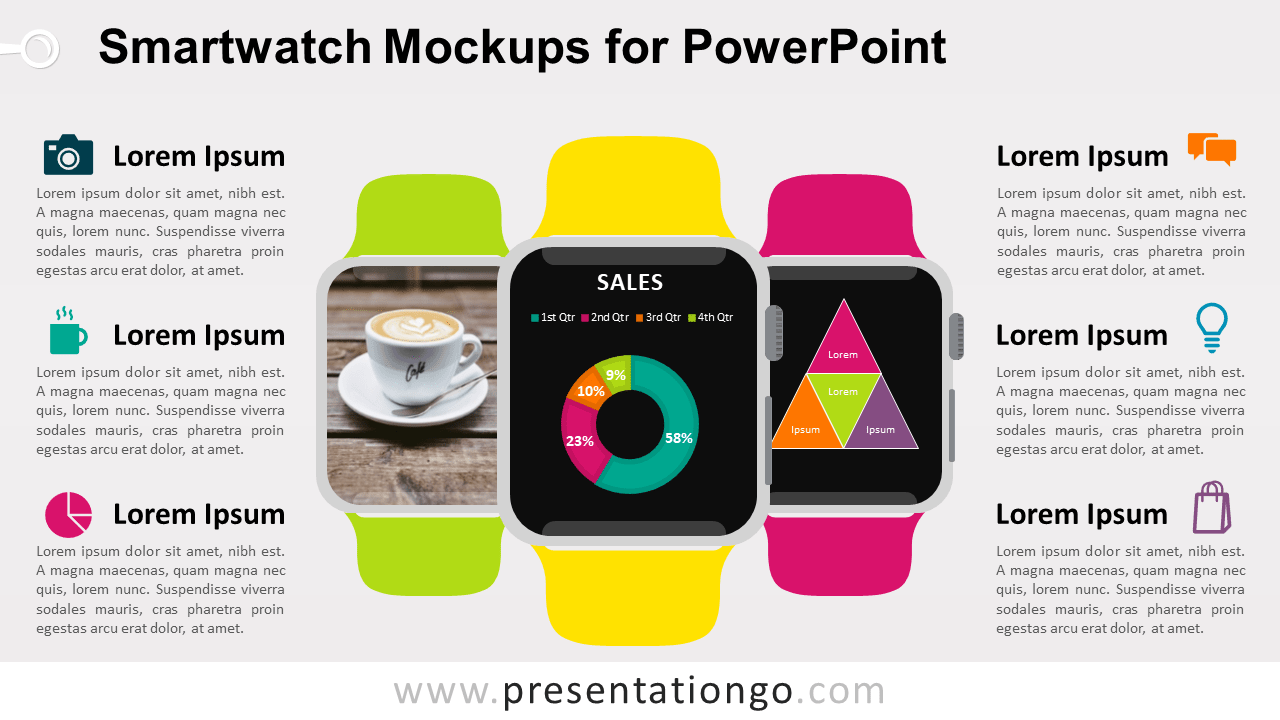
Free smartwatch mockups for PowerPoint. 3 lined-up smart watches (similar to the Apple Watch). Editable graphics with text and icon placeholders.
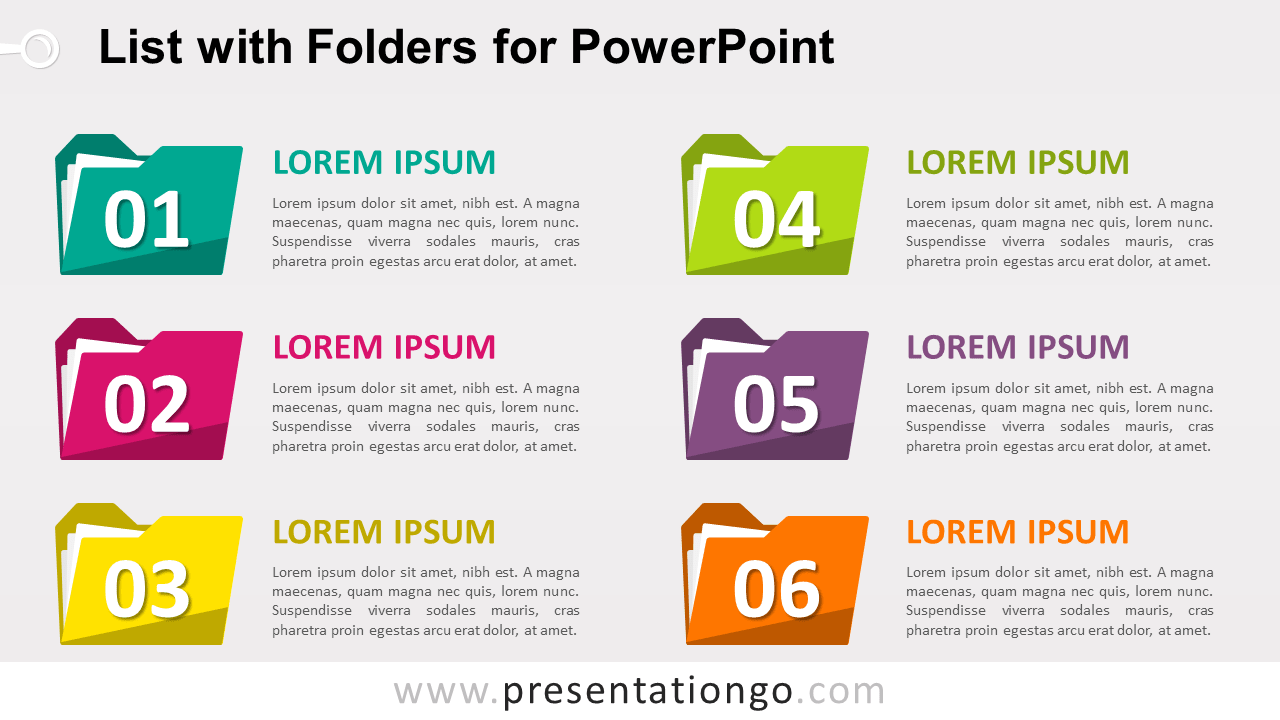
Free list with folders for PowerPoint. 6 colored file folder icons, with numbering and text. Editable graphics with text and icon placeholders.
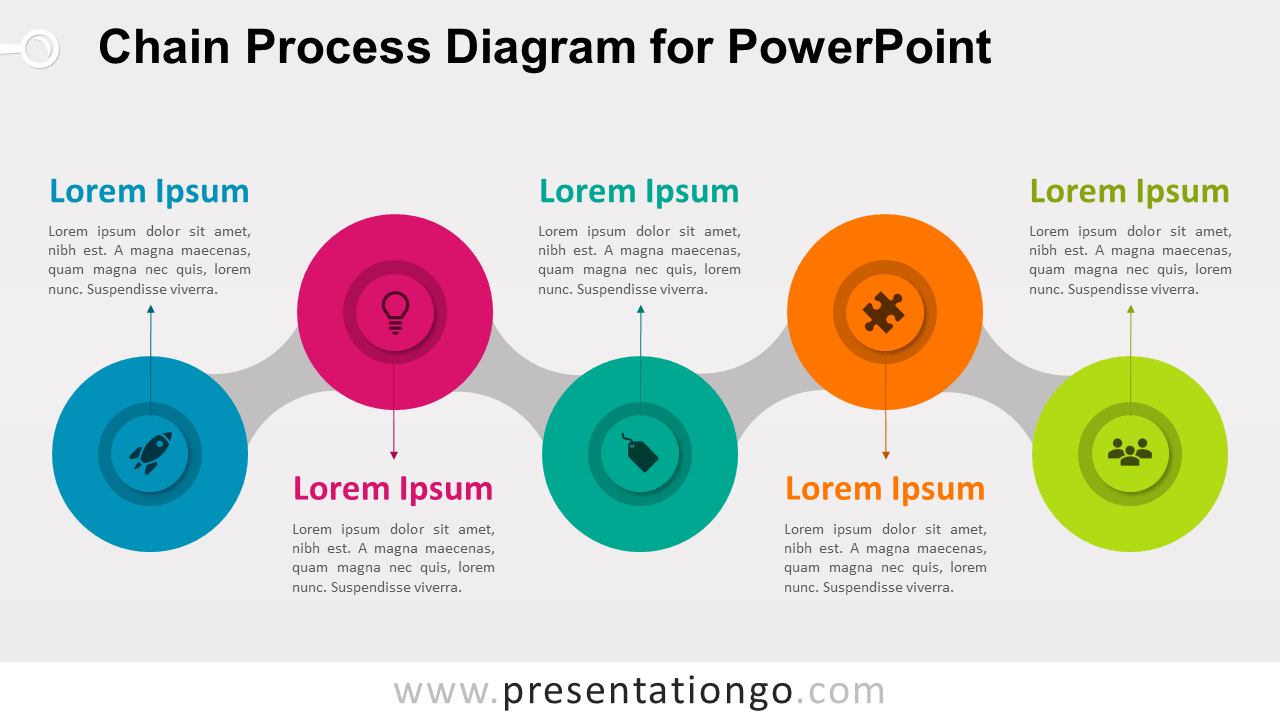
Free chain process diagram for PowerPoint. 5-step horizontal alternating process diagram with 5 chain links. Editable graphics with text placeholders.
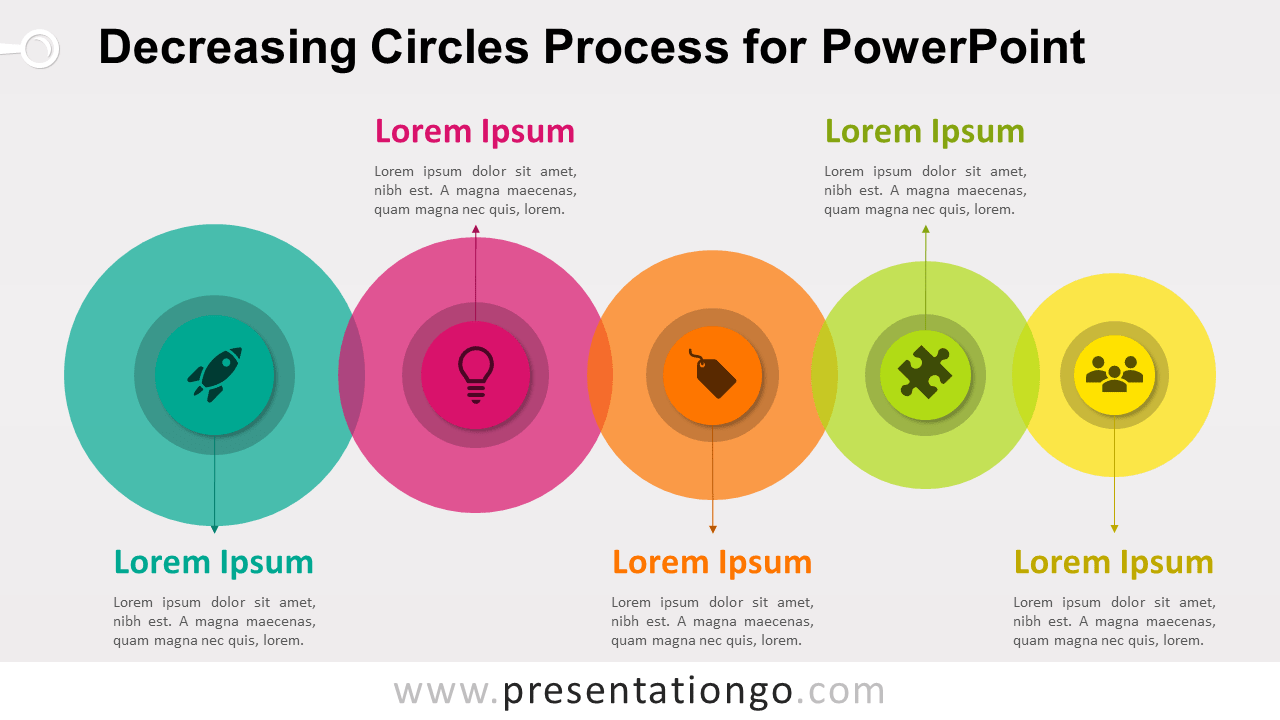
Free decreasing circles process for PowerPoint. 5 horizontally-aligned and partly overlapped colorful circles. Editable graphics with text placeholders.
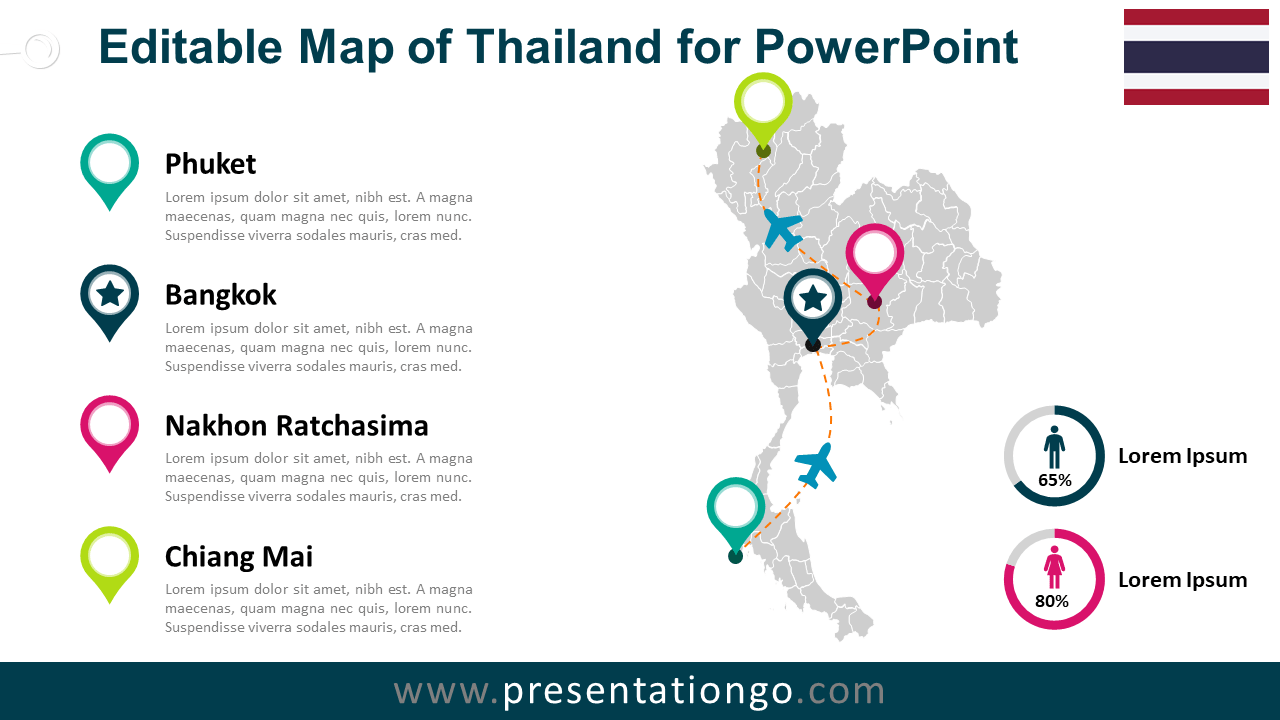
Free map of Thailand for PowerPoint. Map with Thai provinces and colored location pins. Fully editable graphics. Standard and widescreen layouts.
Free up and down arrows for PowerPoint. Flat design style arrows. To compare or oppose 2 ideas, concepts or results. Completely editable graphics.
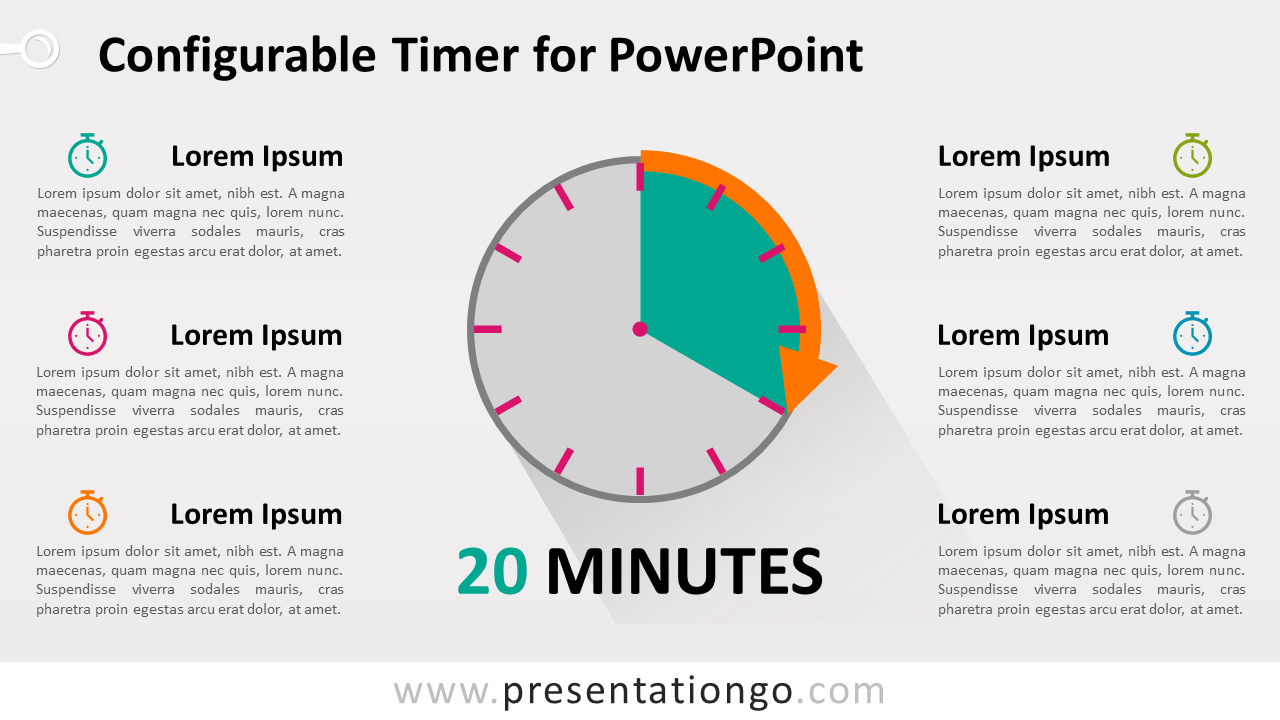
Free configurable timer for PowerPoint. Timer, stopwatch or chronometer illustration with easy-to-adjust time elapsed (1-click). Editable graphics.
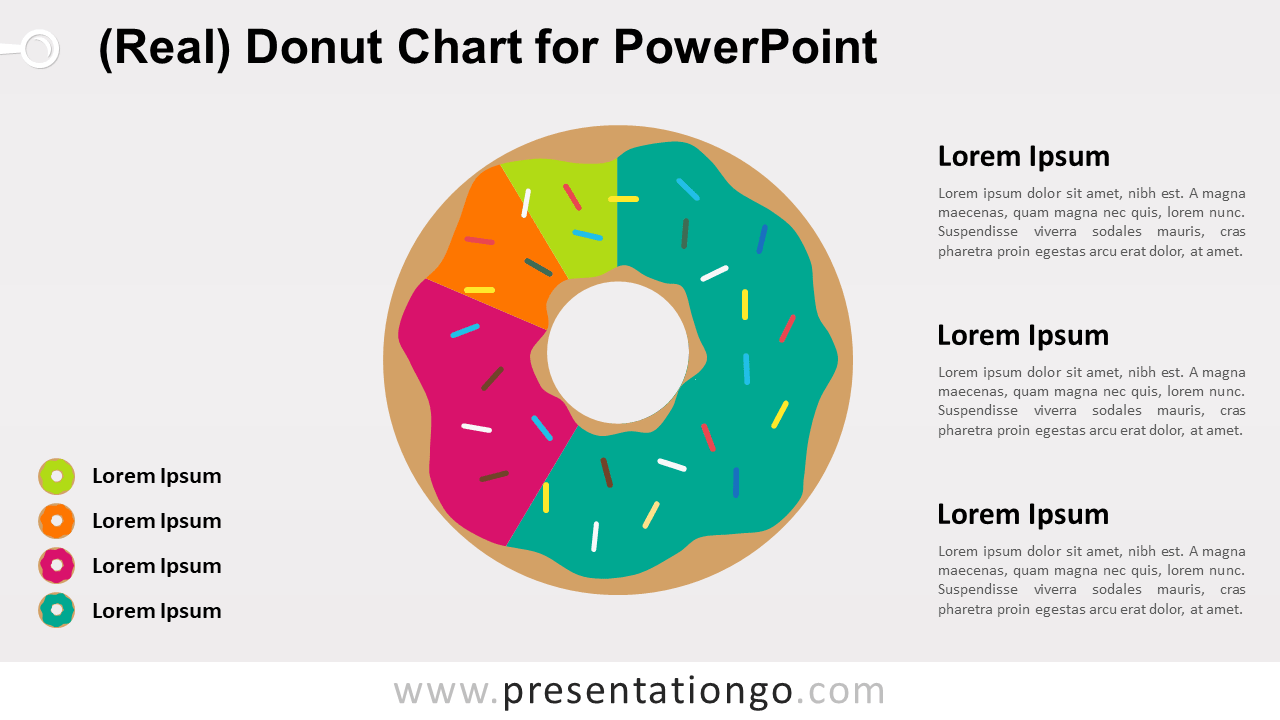
Show-off your creativity. Free real donut chart for PowerPoint. Colorful donut (or doughnut) design with data-driven pie chart. Standard and Widescreen.
Create a Powerpoint or Google Slides presentation fast using this free simple template. Background can be set to any color and all elements are editable.
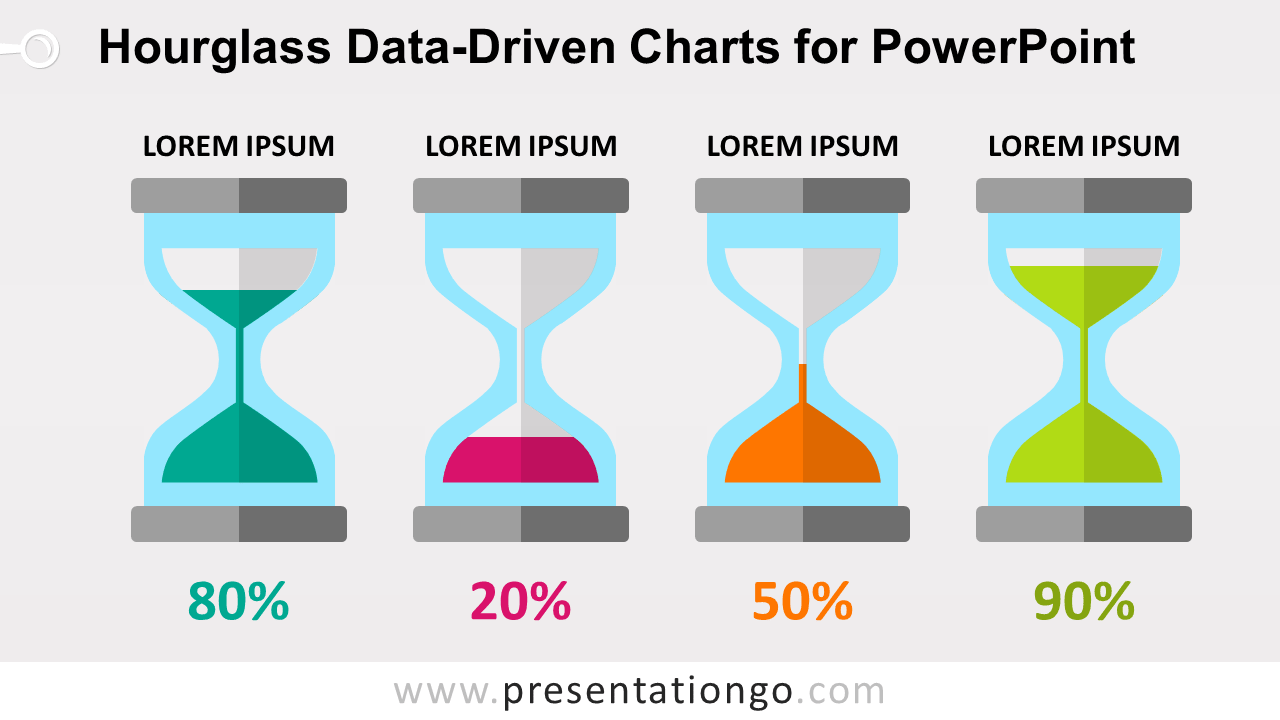
Free hourglass charts for PowerPoint. 4 hourglass graphics with data-driven charts using 100% stacked column for the sand level. Editable graphics.
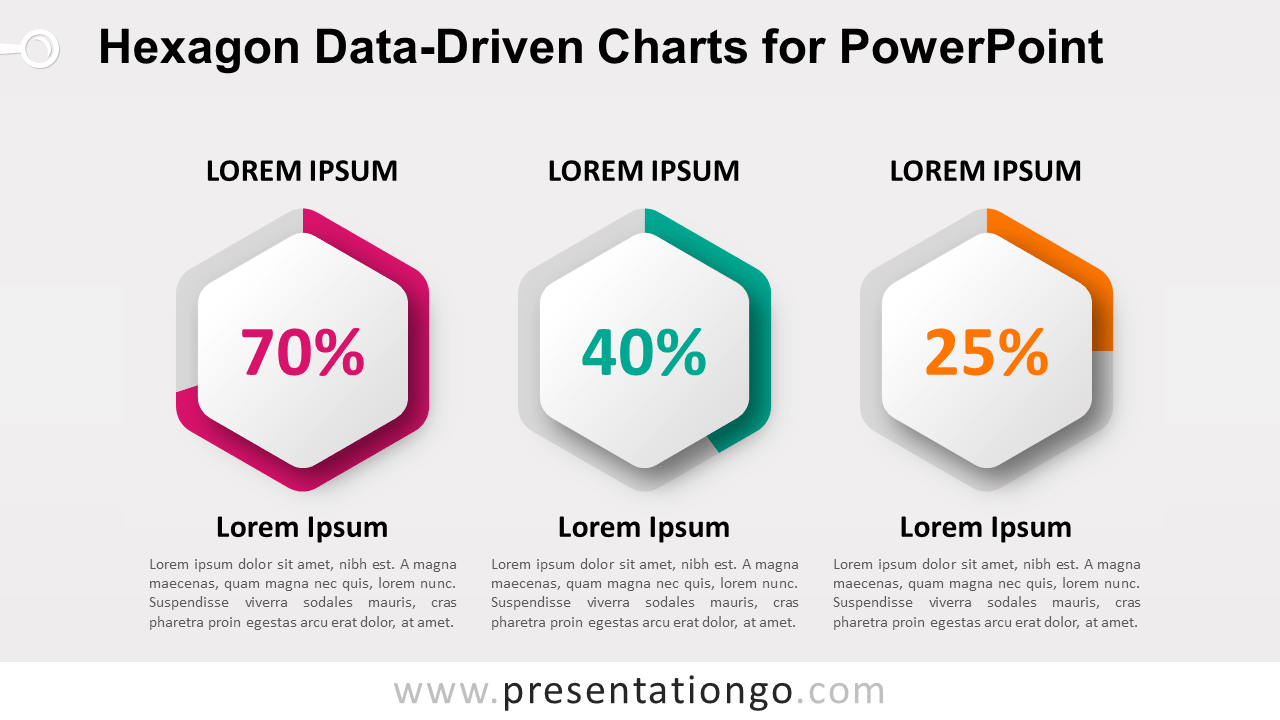
Free hexagon data-driven charts for PowerPoint. 3 hexagon shapes with data-driven pie charts, and percentage number in the middle. Editable graphics.
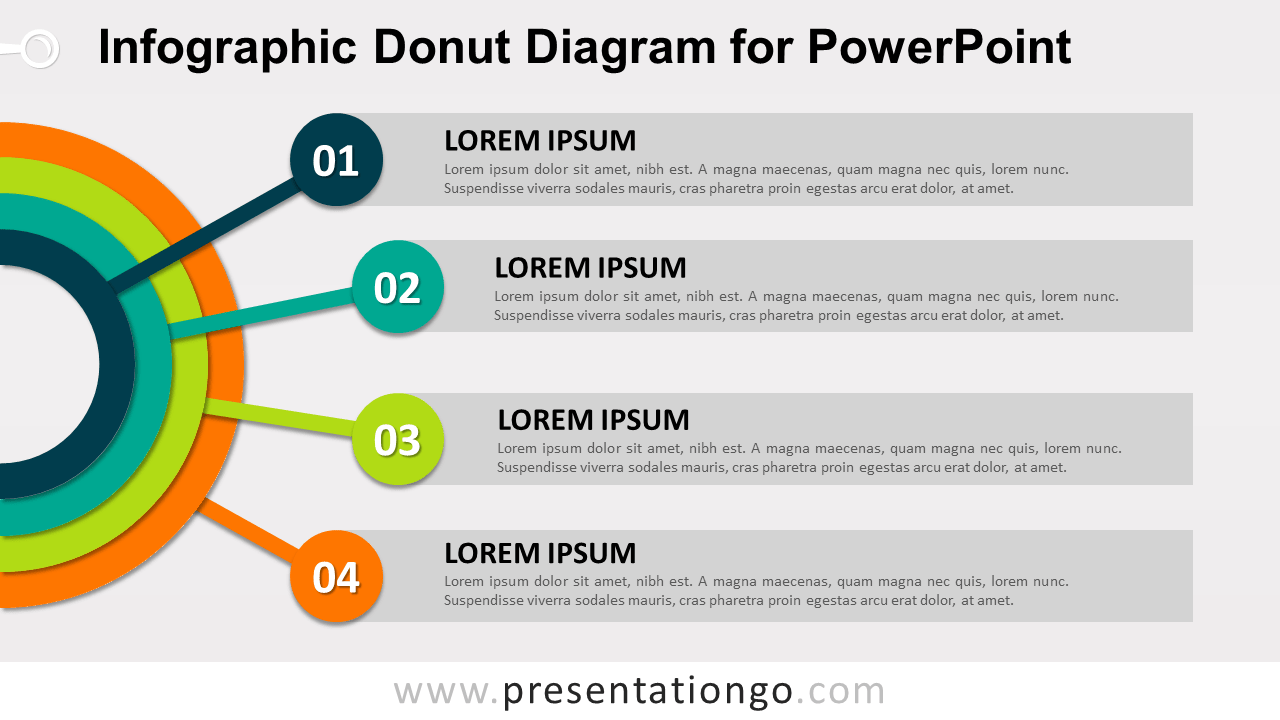
Free infographic donut diagram for PowerPoint. Colorful radial diagram with 4 layers of semi circle donut shapes (or block arcs).
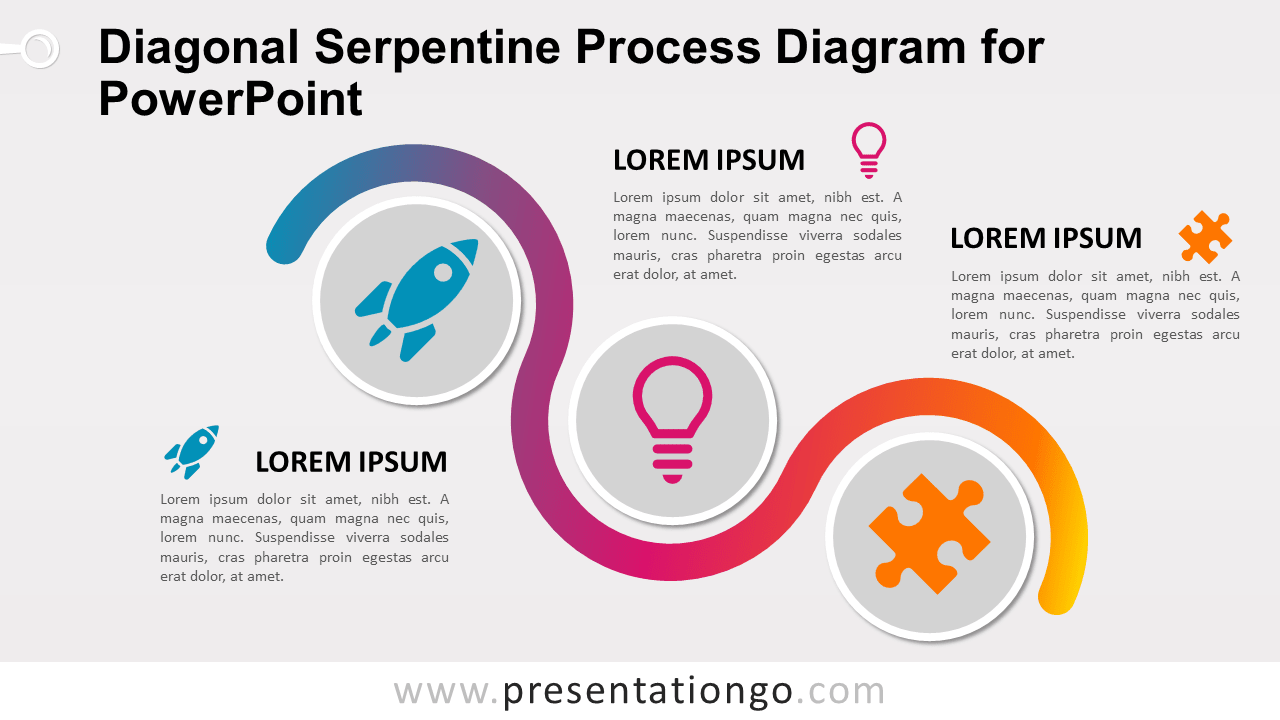
Free diagonal serpentine process diagram for PowerPoint. 3-step alternating process diagram with gradient colors. Editable graphics.
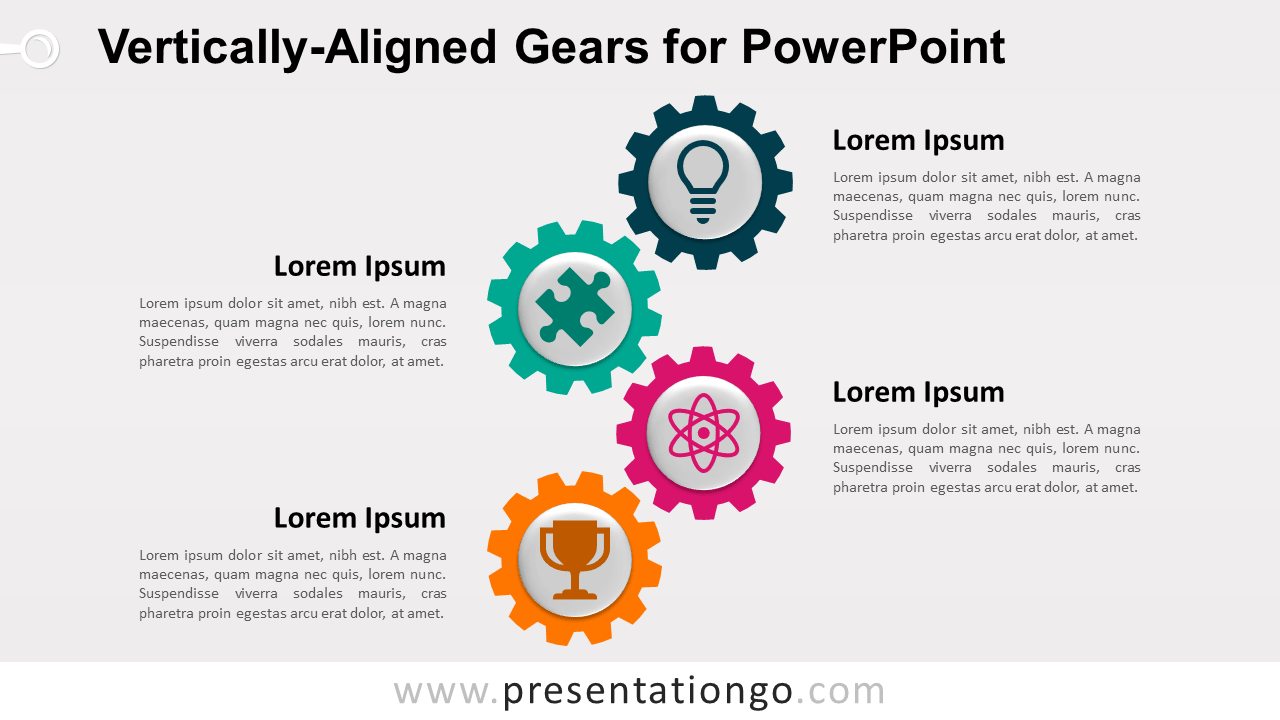
Free vertically-aligned gears for PowerPoint. Vertical set of 4 colorful gears. Editable graphics with text and icon placeholders.
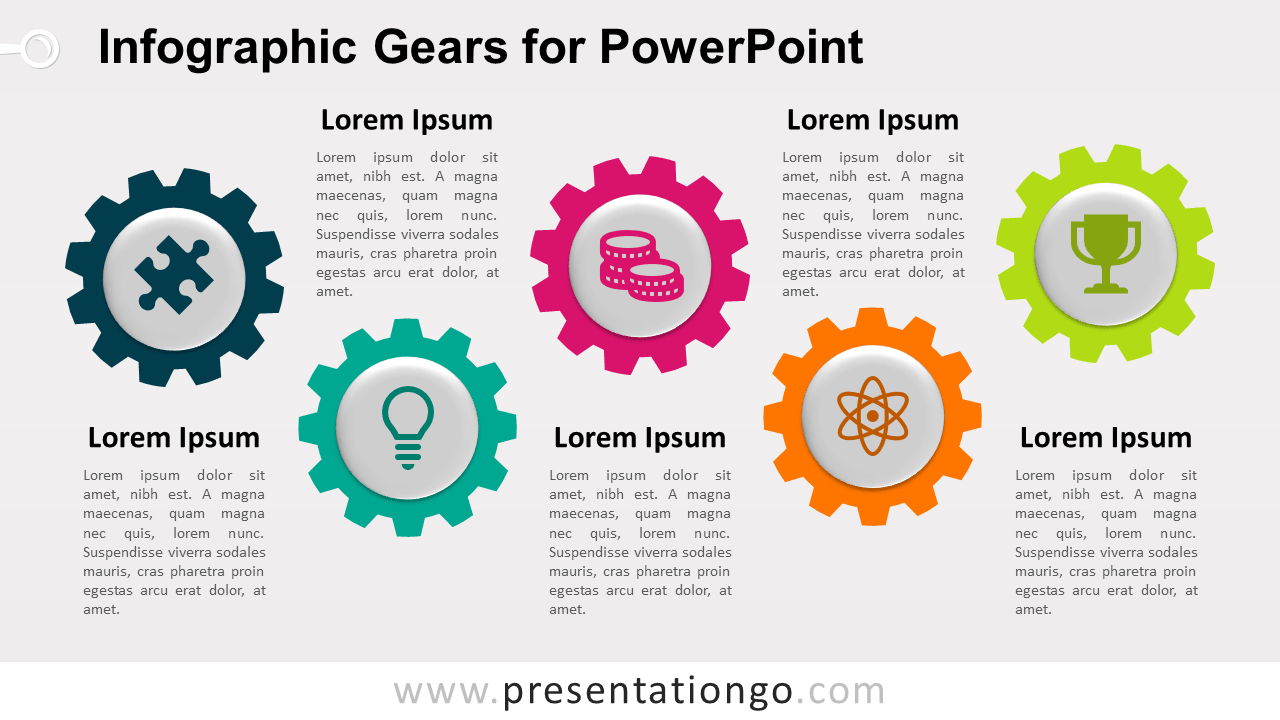
Free infographic gears for PowerPoint. 5 horizontally-aligned colorful gears. Editable graphics with text and icon placeholders.
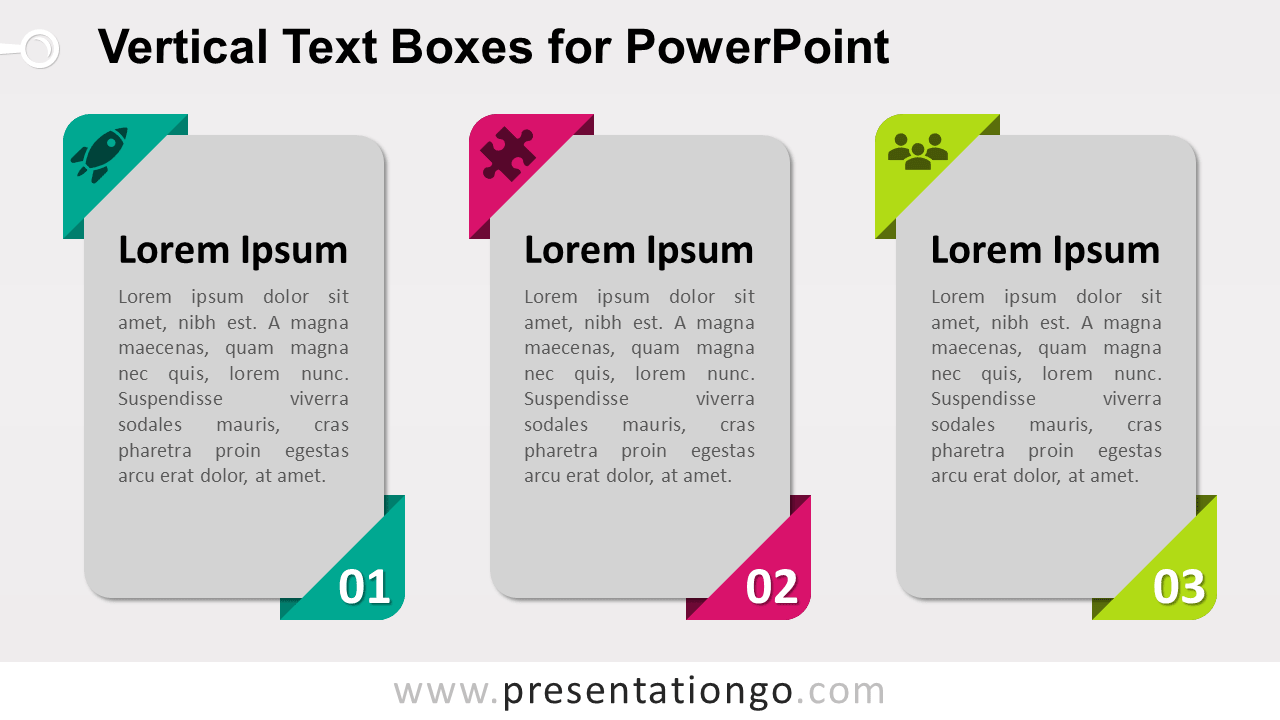
Free vertical text boxes for PowerPoint. 3 vertical rounded-corner rectangle banners with bookmark corners. Editable graphics.
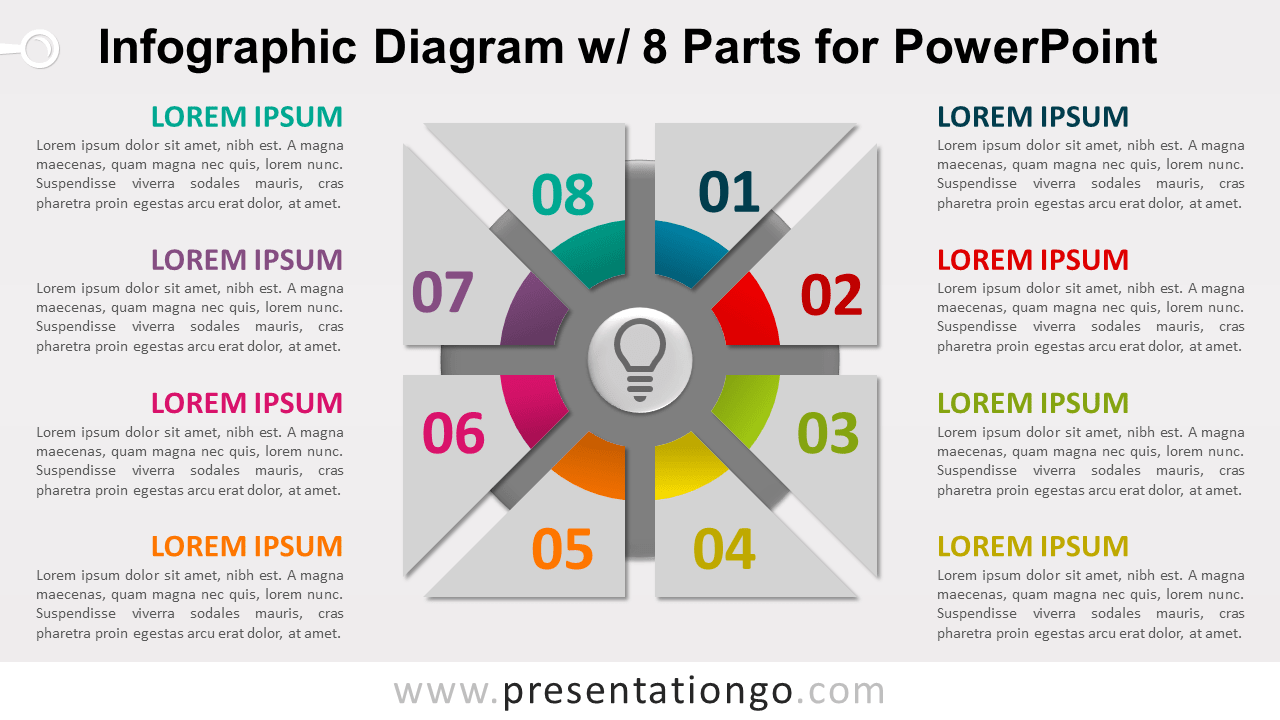
Free infographic diagram with 8 parts for PowerPoint. Rectangle or square shape divided in 8 equal parts and with 8 block arcs, or slices.
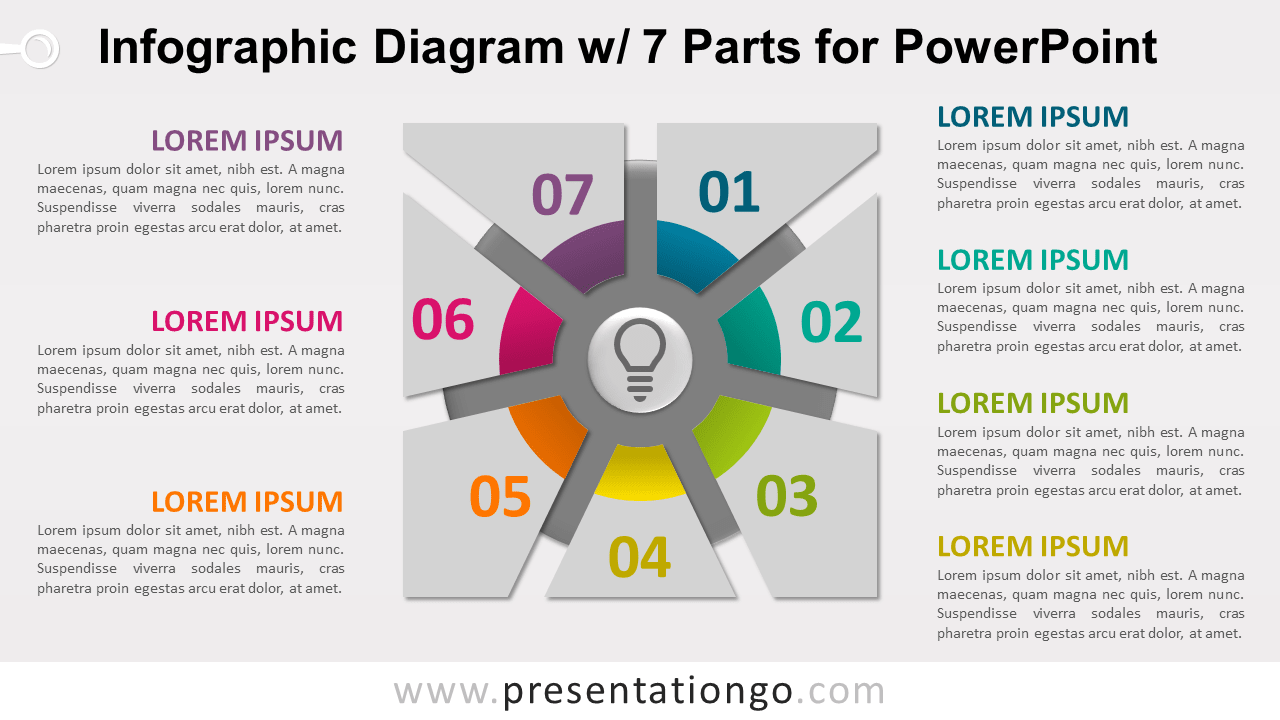
Free infographic diagram with 7 parts for PowerPoint. Rectangle or square shape divided in 7 equal parts and with 7 block arcs, or slices.
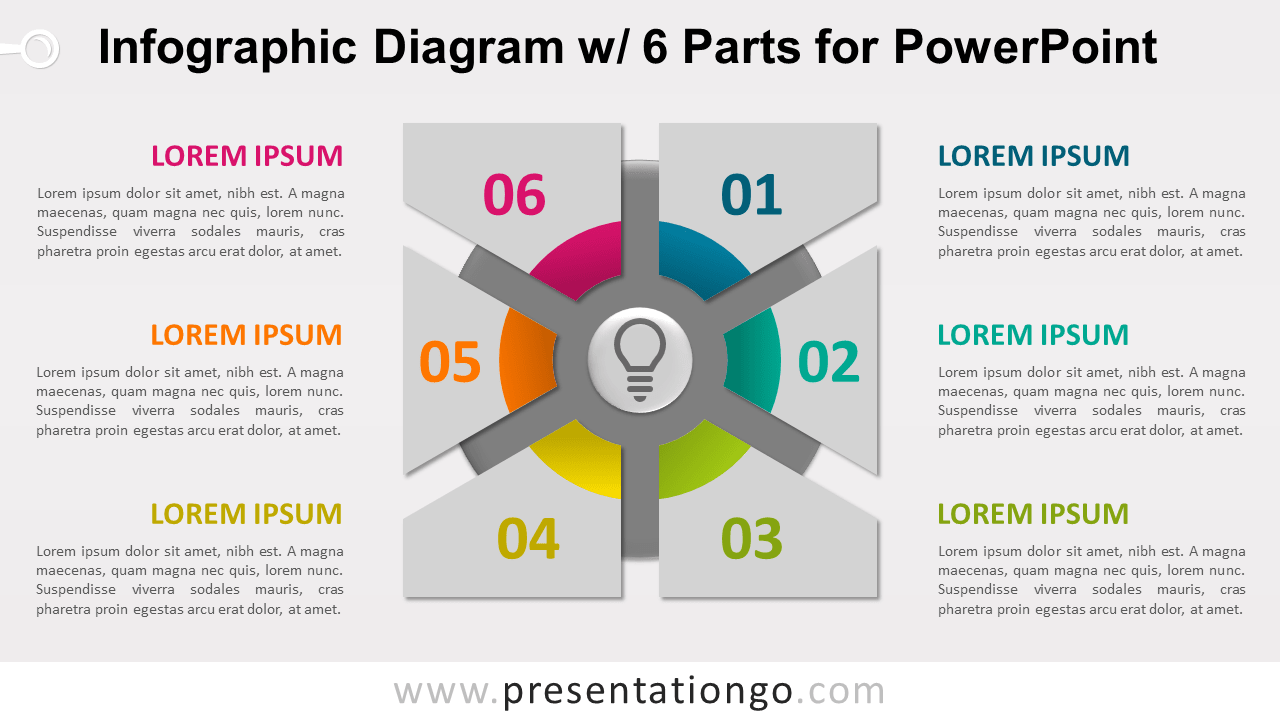
Free infographic diagram with 6 parts for PowerPoint. Rectangle or square shape divided in 6 equal parts and with 6 block arcs, or slices.
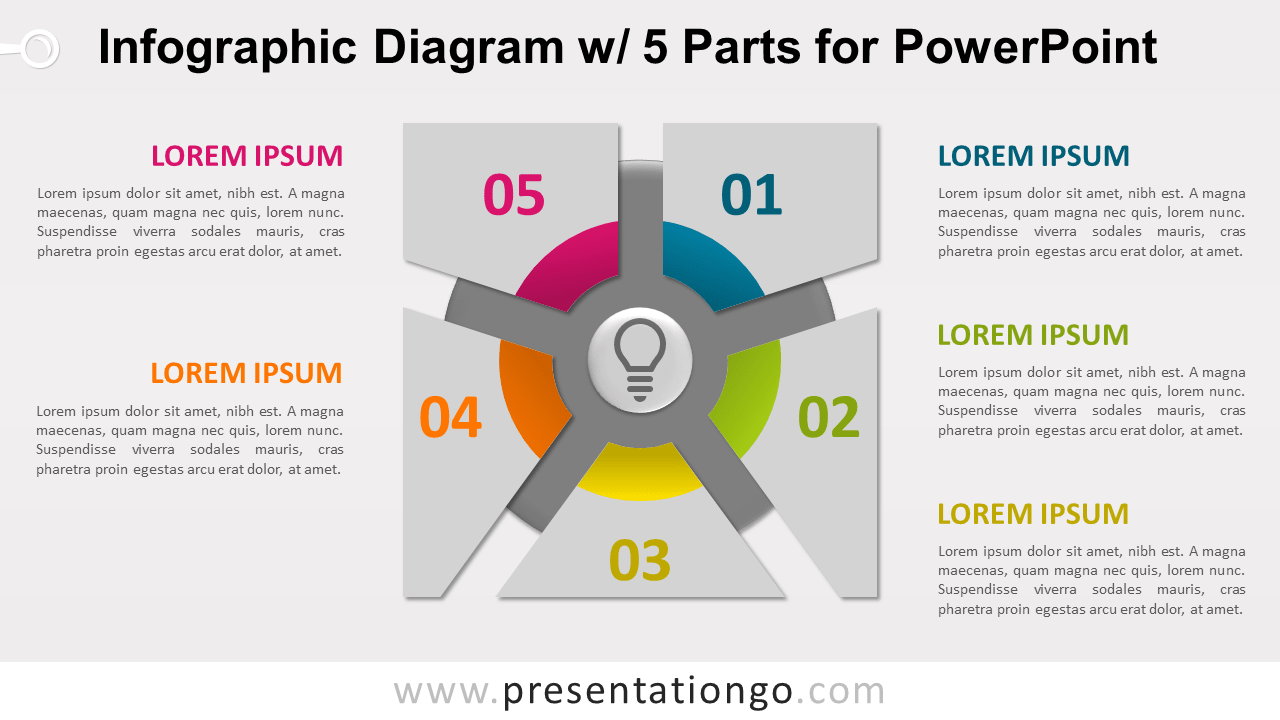
Free infographic diagram with 5 parts for PowerPoint. Rectangle or square shape divided in 5 equal parts and with 5 block arcs, or slices.